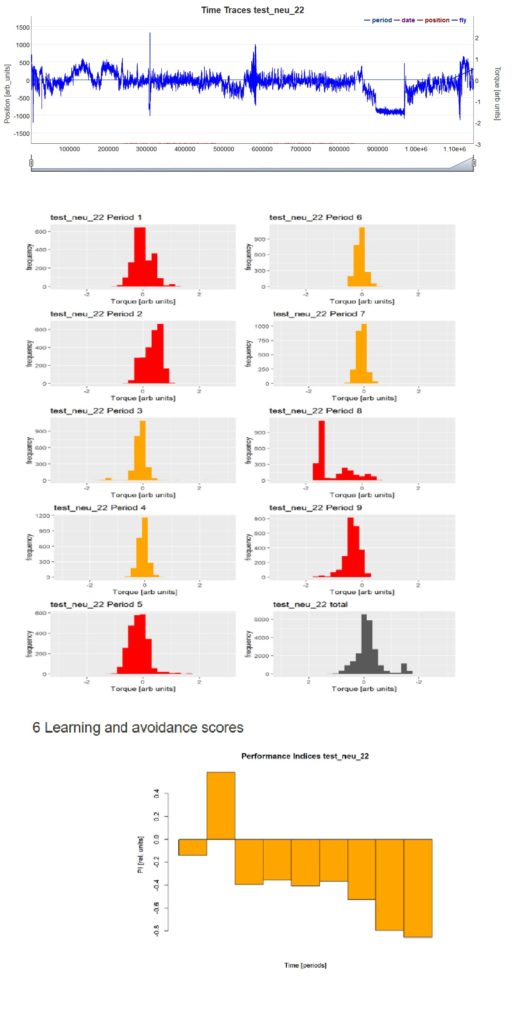
Updates on Optomotorics and DTS evaluation
on Monday, December 16th, 2019 1:57 | by Anders Eriksson
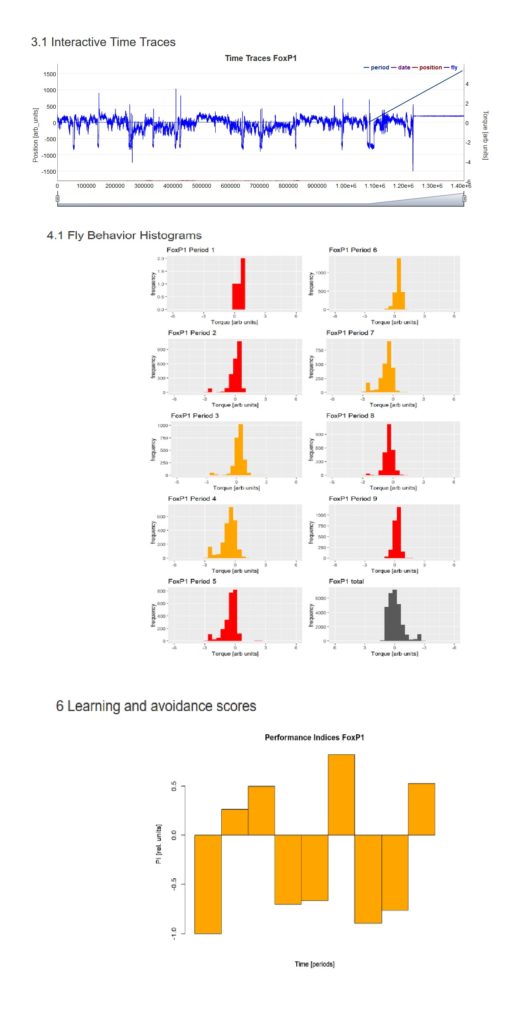
DTS: The graph below is an example image of how color according to category looks like. The output now adds a unique color for each category. The one below has three different colors as the pretest phase does not use any pattern and is therefor read as its own category.
Optomotorics: The software worked as it should although it had a couple of issues. Wrong information in xml sheet was one of them: this is now fixed so that it enters duration as seconds and the correct terms for a_pos and j_pos are used
The other issue was that at the end of the experiment about 40-50 data points were missing/removed. My speculation was that this either had to do with data being removed at the end of the experiment or that it ended prematurely. Turns out that the later was the cause.
As simple as it might seem, there was a lot of investigation to find this bug. To fix this I simply had to replace if curr_count >= self.test_time() - 100:
with if curr_count >= self.test_time() - 30:

Category: Uncategorized | No Comments
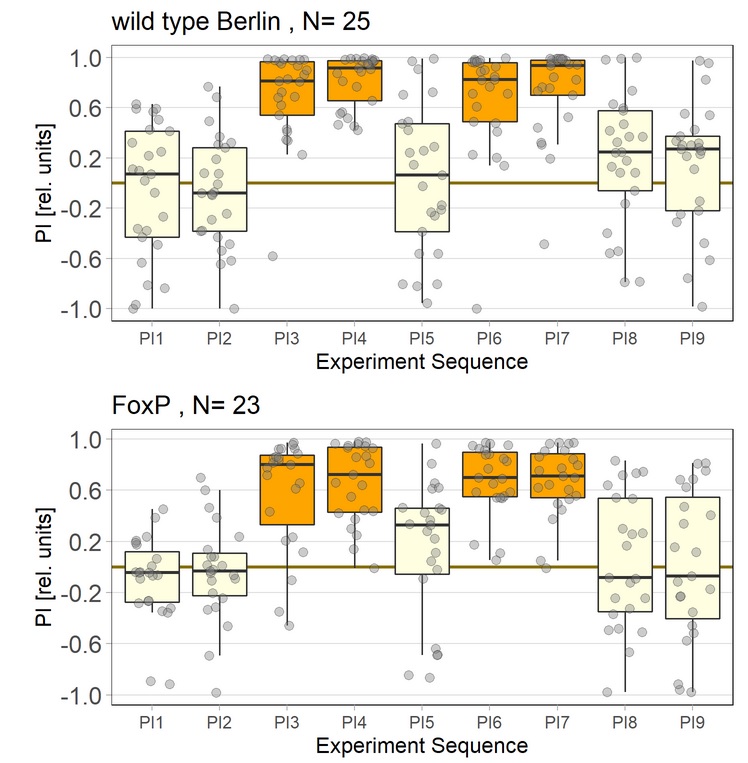
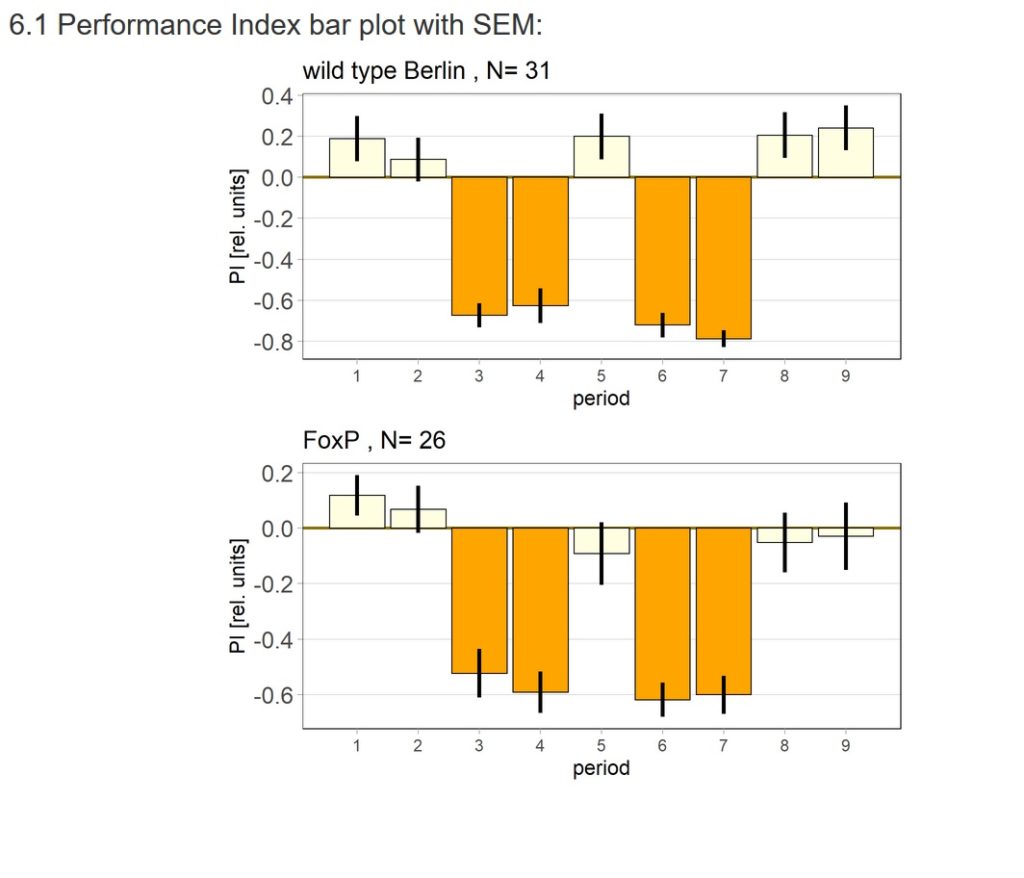
Recent data Wtb vs FoxP
on Monday, December 9th, 2019 12:50 | by Andreas Ehweiner
Category: Uncategorized | No Comments
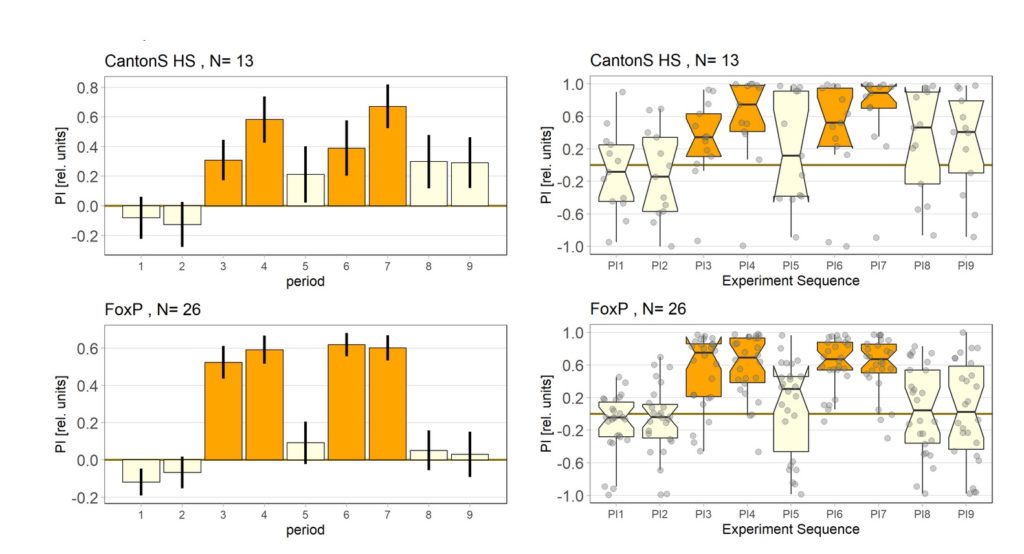
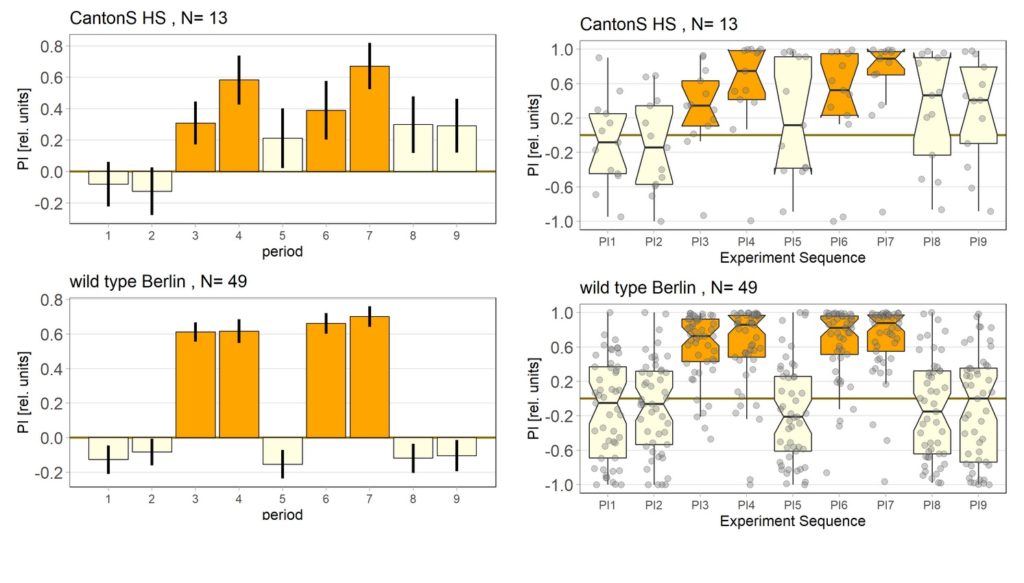
Pretest Wtb, Cs and FoxP
on Monday, December 2nd, 2019 1:59 | by Andreas Ehweiner
Pretest of standart yaw torque learning experiments. No learning behaviour yet, troubleshooting ongoing. ContonS fly’s seems to perform better. (Same Wtb, FoxP and Cs data for each graph)
Category: Uncategorized | No Comments
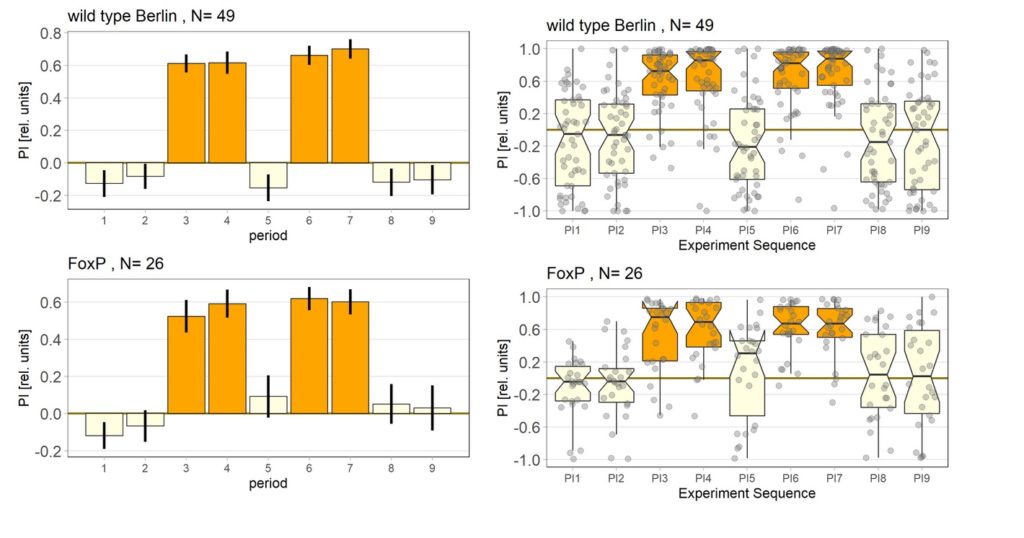
Inverted data Wtb vs FoxP
on Monday, November 25th, 2019 2:01 | by Andreas Ehweiner
Category: Uncategorized | No Comments
Testing the code for the shiming divice data
on Monday, November 25th, 2019 1:58 | by Andreas Ehweiner
Changing the contingency for the data.
Category: Uncategorized | No Comments
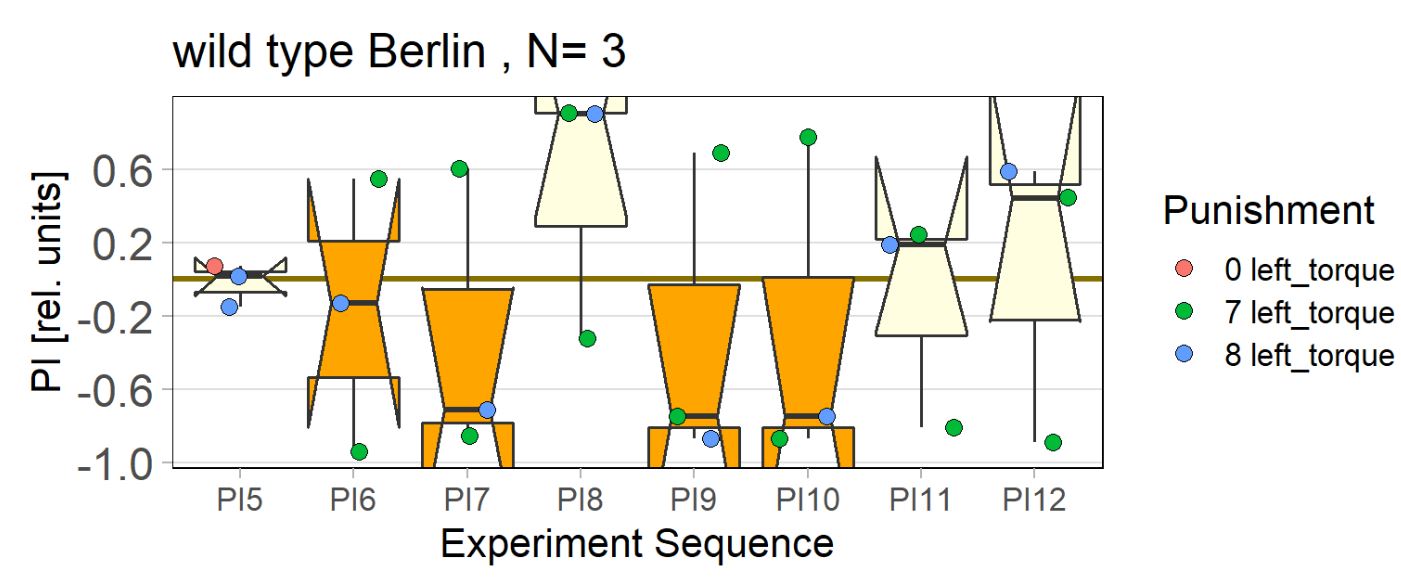
Pretest with Wtb fly’s
on Monday, November 11th, 2019 1:31 | by Andreas Ehweiner
Pretest with Wtb fly’s to evaluate if the setup is working correctly.
N=16, negative score: 9, positive score 5, indifferent 2.
Learning deficit due to old age?
Scores shuld be inverted. 3 example PIs
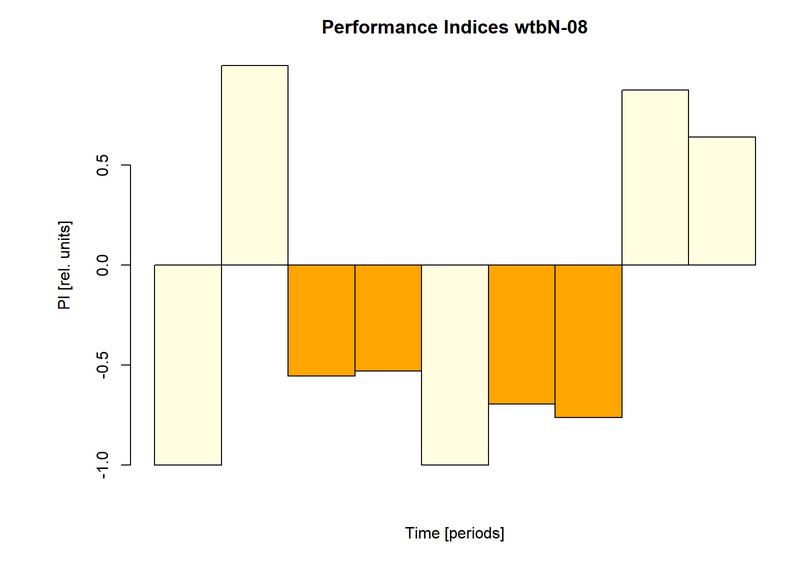
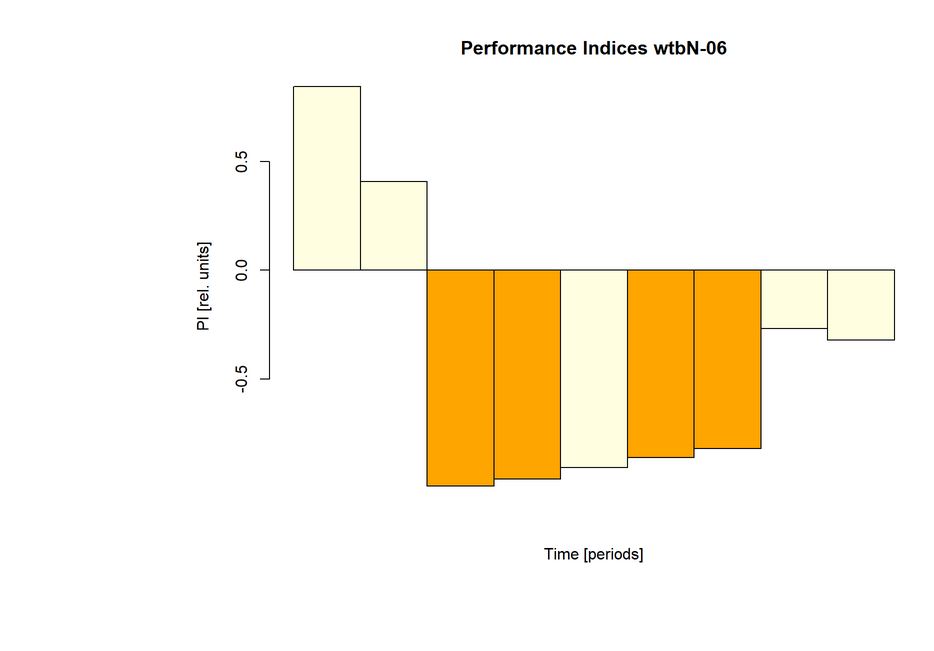
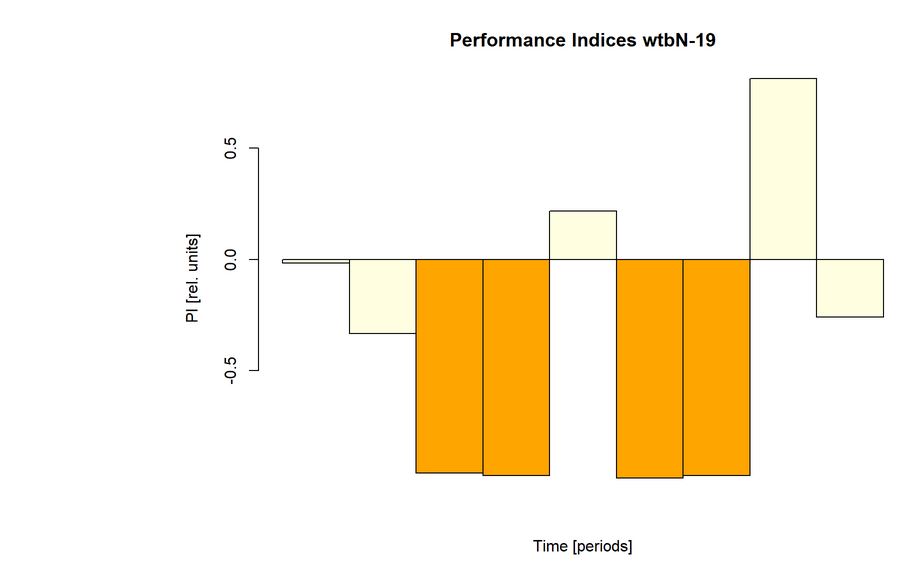
Indifferent
Category: Uncategorized | No Comments
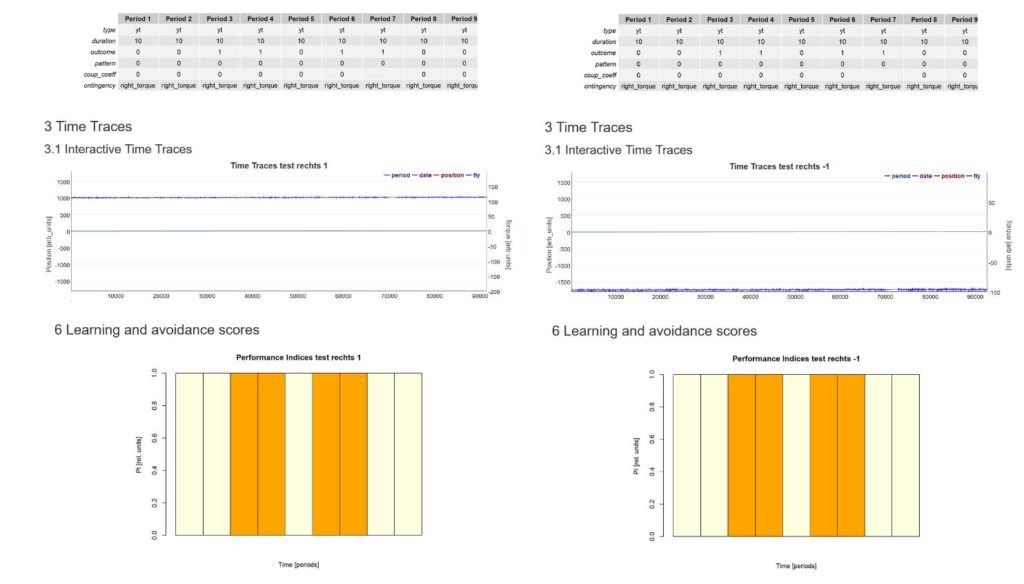
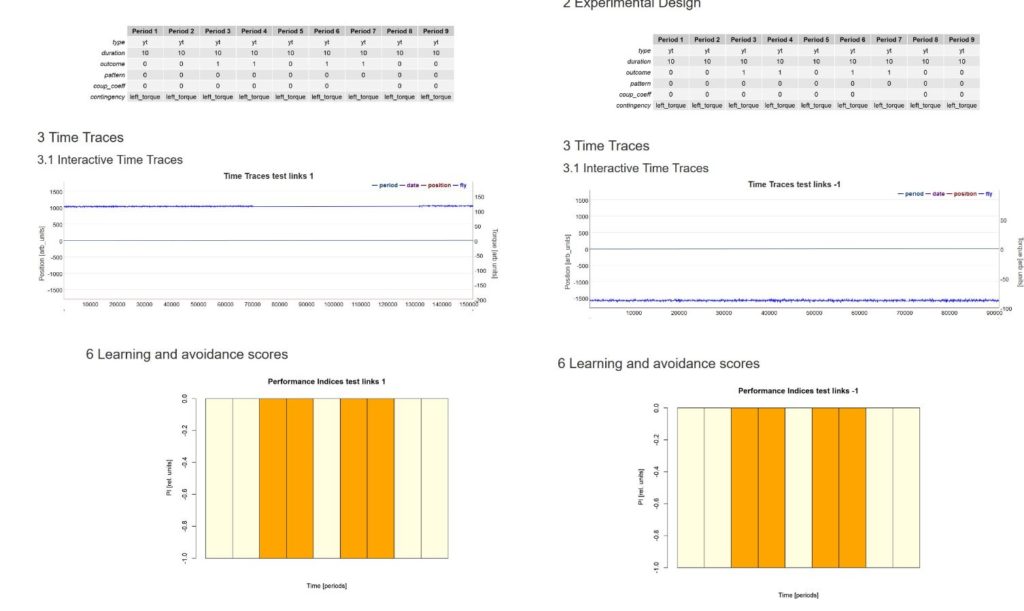
General test of the produced data with the evaluation code.
on Monday, November 11th, 2019 12:47 | by Andreas Ehweiner
Test files for 10 sec, with fixed value (1, -1) and swiching the contingency (left punished, right punished). Evaluation file makes no sens.
Category: Uncategorized | No Comments
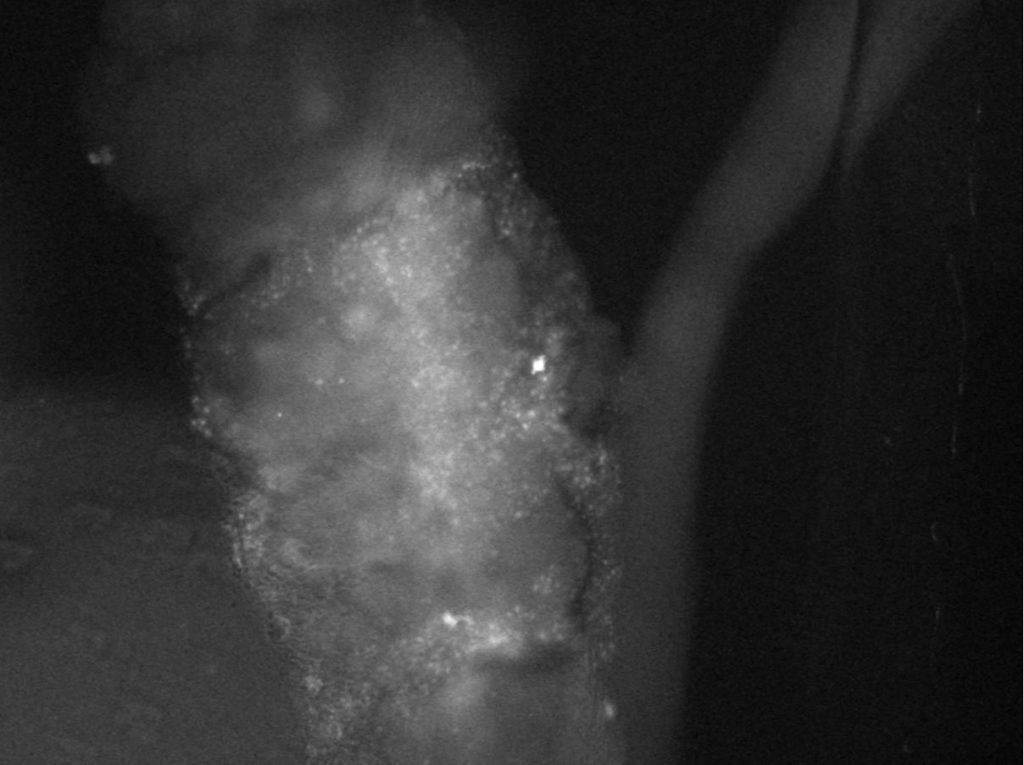
Flight simulator pre-test
on Monday, September 16th, 2019 1:26 | by Andreas Ehweiner
Category: Uncategorized | No Comments
Test cross
on Monday, September 16th, 2019 1:13 | by Andreas Ehweiner
Category: Uncategorized | No Comments
Results of T-maze experiments (yellow light)
on Monday, August 19th, 2019 1:43 | by kader semiz
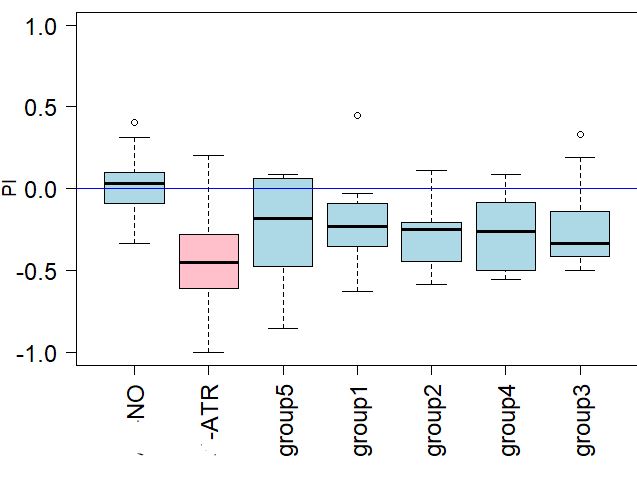
T- maze experiments were done with Norpa/Crimson x Gr28bd/TrpA1 lines without ATR (n=28) and with ATR (n=28). We have done all experiments which belong to Norpa/Crimson x Gr28bd/TrpA1lines. End of all experiments with them; the ATR ones seem like tend to escape from the yellow light as shown at the graph. NO ATR ones seem like moving more randomly.
On the other hand 5 different groups (THD’-GAL4xNorpA/Crimson with and without ATR, THD1-GAL4xNorpA/Crimson with and without ATR and W[1118]x NorpA/Crimson). Group1 (n=10) Group2(n=11) Group3(n=9) Group4 (n=10) Group5(n=9). Still, we don’t know that the which lines belong to which groups. The graph shows the PI numbers according to the T-maze experiments that we have done.
Category: Uncategorized | No Comments