Graph for Darkpink4
Our experiments are performed after blinding ie we do not know the genotype of the flies tested. Code for this line is Darkpink4. Intensity was approximately 400 Lux. The frequency of yellow light was 20Hz with 50:50 duty cycle.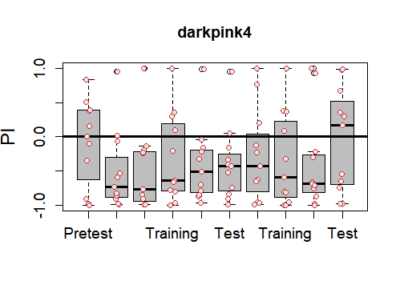
Graph for Darkpink3
Our experiments are performed after blinding ie we do not know the genotype of the flies tested. Code for this line is Darkpink3. Intensity was approximately 400 Lux. The frequency of yellow light was 20Hz with 50:50 duty cycle.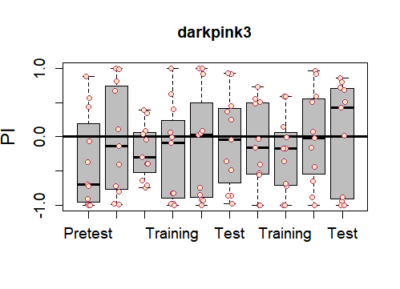
Graph for Darkpink2
Our experiments are performed after blinding ie we do not know the genotype of the flies tested. Code for this line is Darkpink2. Intensity was approximately 400 Lux. The frequency of yellow light was 20Hz with 50:50 duty cycle.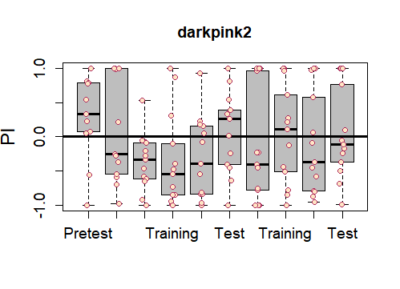
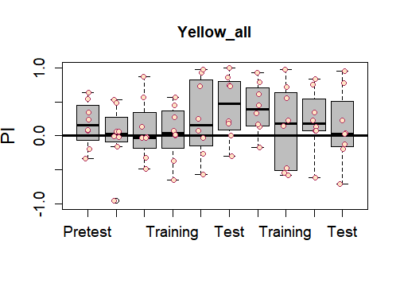
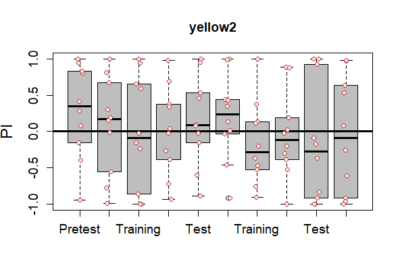
Graph for darkyellow2
Our experiments are performed after blinding ie we do not know the genotype of the flies tested. Code for this line is Yellow2. Intensity was approximately 400 Lux. The frequency of yellow light was 20Hz with 50:50 duty cycle.
Graph for Red2
Our experiments are performed after blinding ie we do not know the genotype of the flies tested. Code for this line is Red2. Intensity was approximately 400 Lux. The frequency of yellow light was 20Hz with 50:50 duty cycle.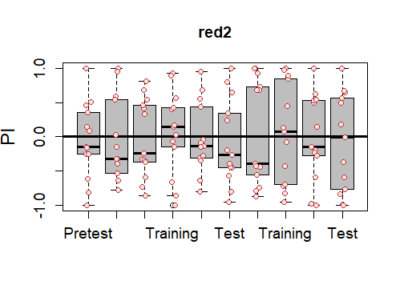
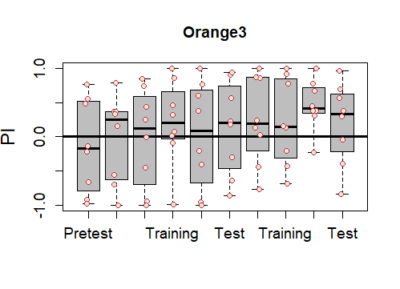
Graph for Orange3
Our experiments are performed after blinding ie we do not know the genotype of the flies tested. Code for this line is Orange3. Intensity was approximately 400 Lux. The frequency of yellow light was 20Hz with 50:50 duty cycle.