T-Maze CIs and JoyStick Last Training PIs for yellow and red light.
on Tuesday, January 7th, 2025 1:45 | by Daniel Döringer
| Strain | DA neurons | Reference |
| SS56699 | PPL1-FB | Hulse et al. eLife 2021 |
| TH-D-DBD; TH-C-AD | PPM2 | Xie et al. Cell Reports 2018 |
| TH-FLP-p10; 64H06 | PPM3 | Xie et al. Cell Reports 2018 |
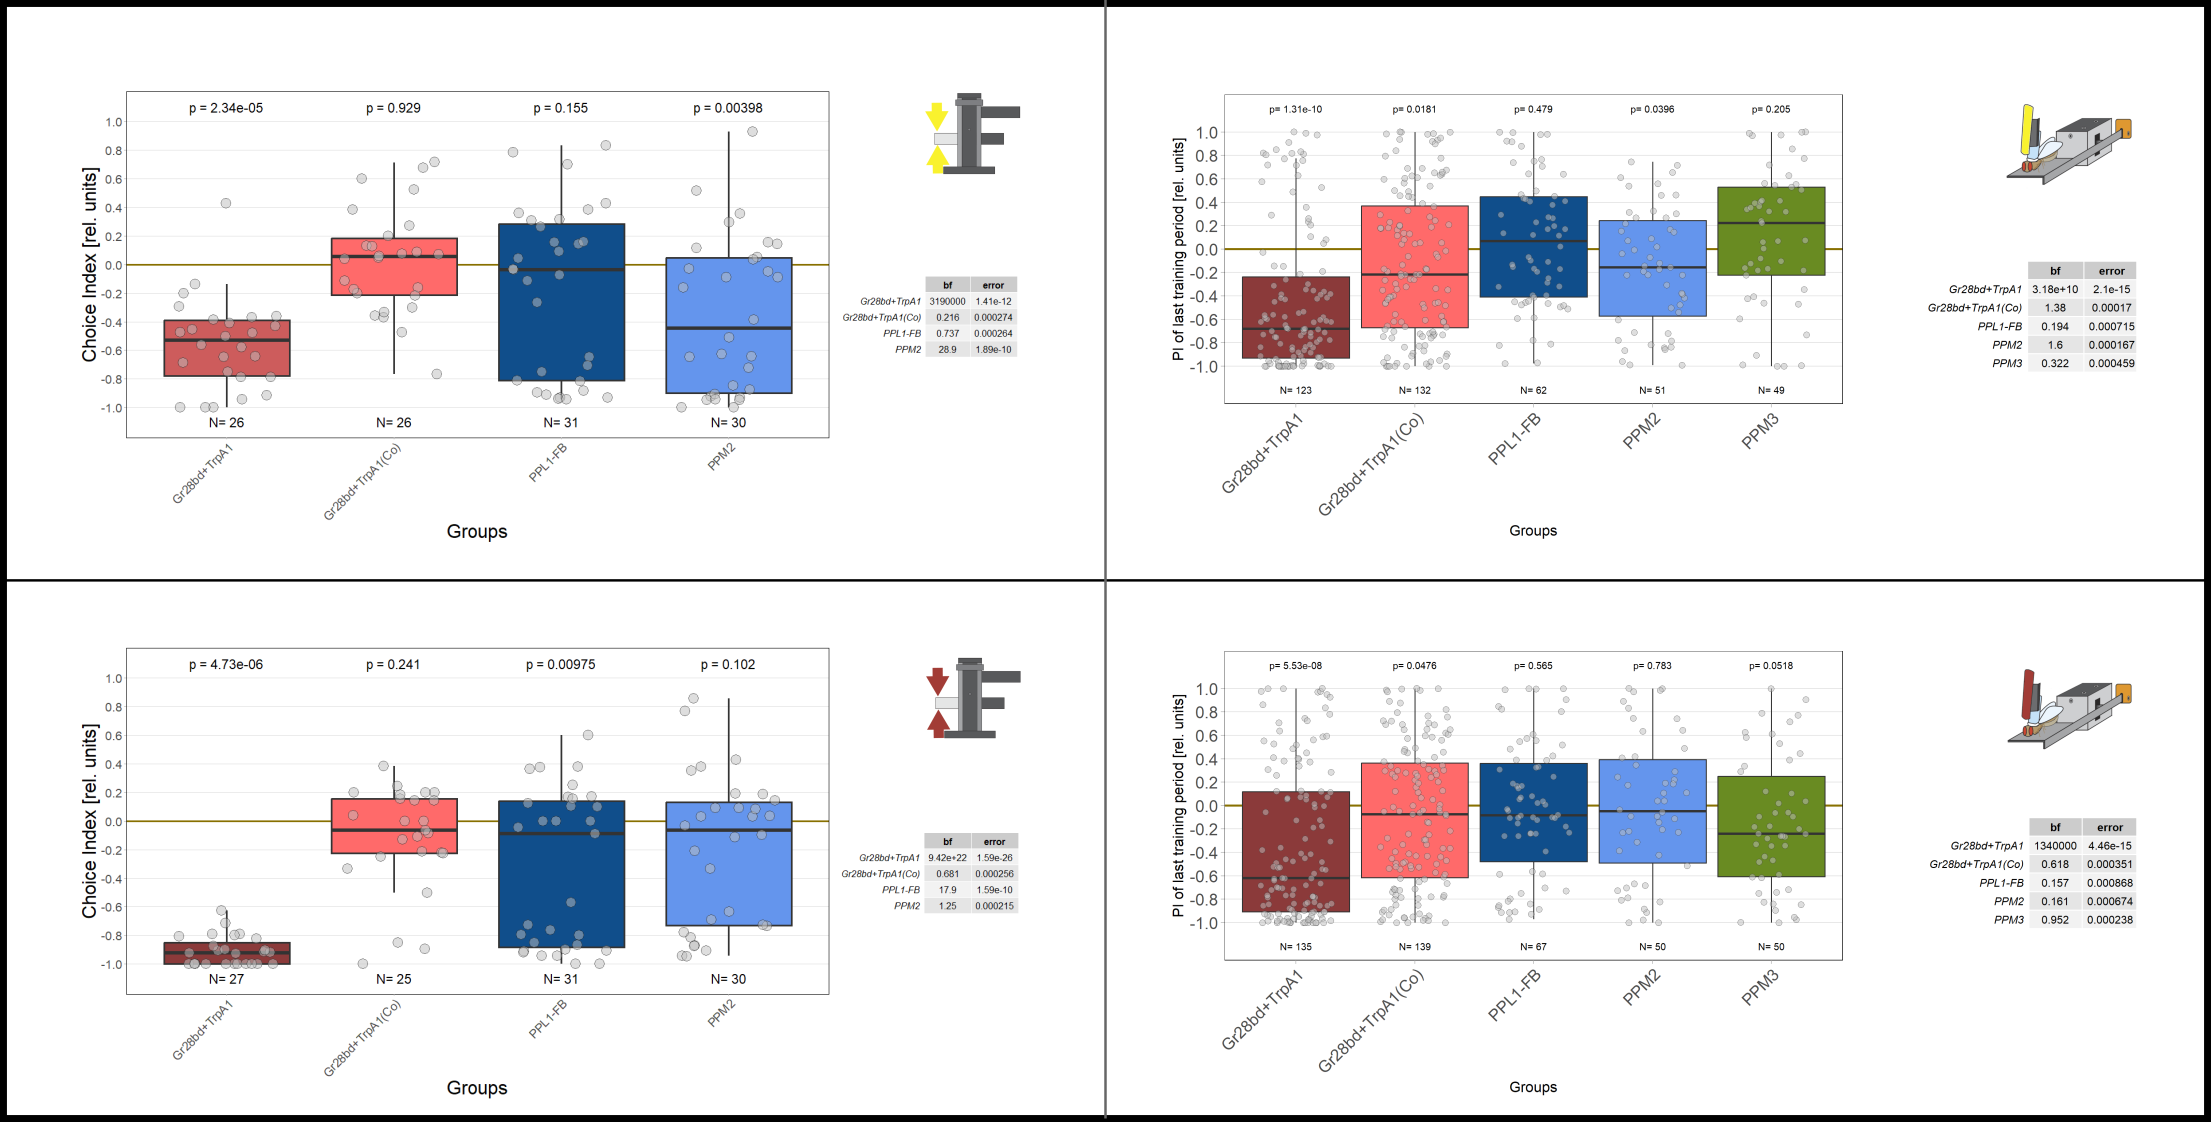
The left-hand side of the figure displays the choice indices (CIs) for the different groups tested for 1 minute in the T-Maze setting. On the right-hand side, the preference indices (PIs) for the final training period in the JoyStick setting are shown. Since flies of the TH_Flp_p10;64H06 line were not blind, they could not be tested in the T-Maze setting. The upper part of the figure refers to experiments conducted with yellow light, while the bottom part to experiments with red light, as indicated by the graphics.
In previous posts I referred to the different dopaminergic neurons (DA neurons) with the names of the driver lines used for the crossings. The table below the figure connects the fly strains to the targeted neurons and gives the reference. Gr28bd+TrpA1 target heat sensing neurons and acted as a control, since flies expressing the chrisom channel in these heat sensing neurons would avoid light activation. Flies were fed with all-trans retinal (ATR) for 2 days before the experiments, to enable light activation of the targeted neurons. For the negative control ethanol was used.
In the T-Maze experiments, flies were tested for 1 minute without prior exposure to light, whereas the JoyStick results reflect preferences after nine 1-minute training periods. Therefore, the T-Maze experiments should be repeated using longer testing periods. Additionally, PIs from the initial training periods in the JoyStick experiments will be included to allow for better comparison.
Hulse et al. eLife 2021: https://doi.org/10.7554/eLife.66039
Xie et al. Cell Reports 2018: https://doi.org/10.1016/j.celrep.2018.03.068

Category: Optogenetics
Leave a Reply