WTB Test for Torquemeter February 19-20
on Friday, February 27th, 2026 5:26 | by Ipek Subay
10 flies completed out of 36 flies.
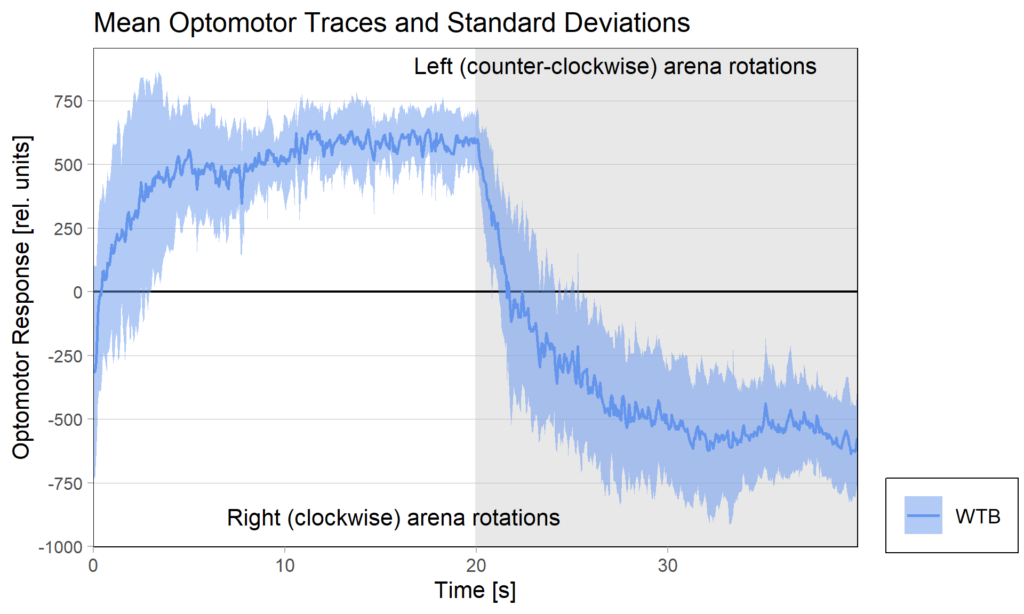
Optomotor traces (right/left) at start of experiment
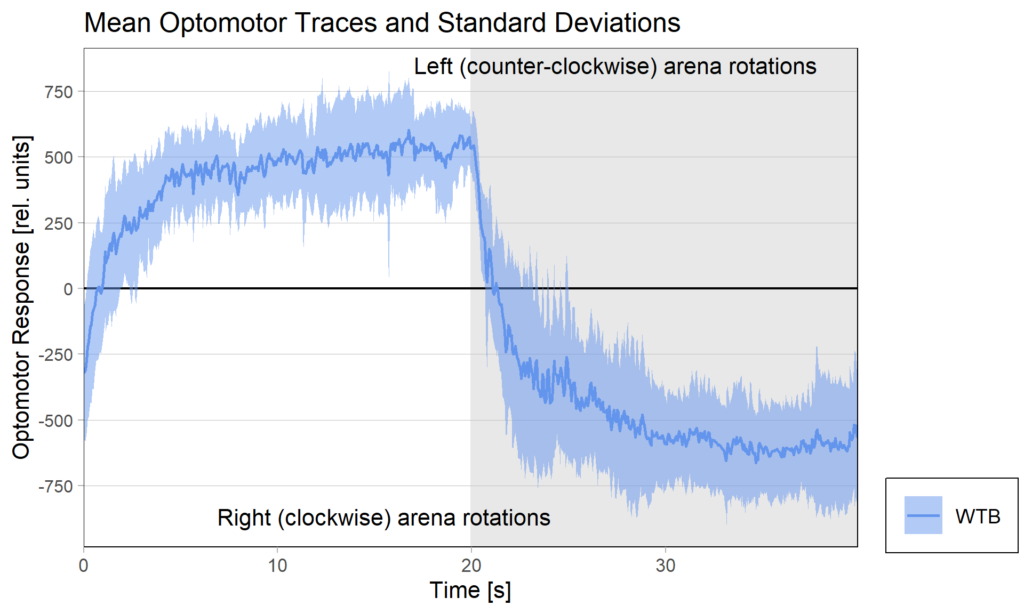
Optomotor traces (right/left) at end of experiment
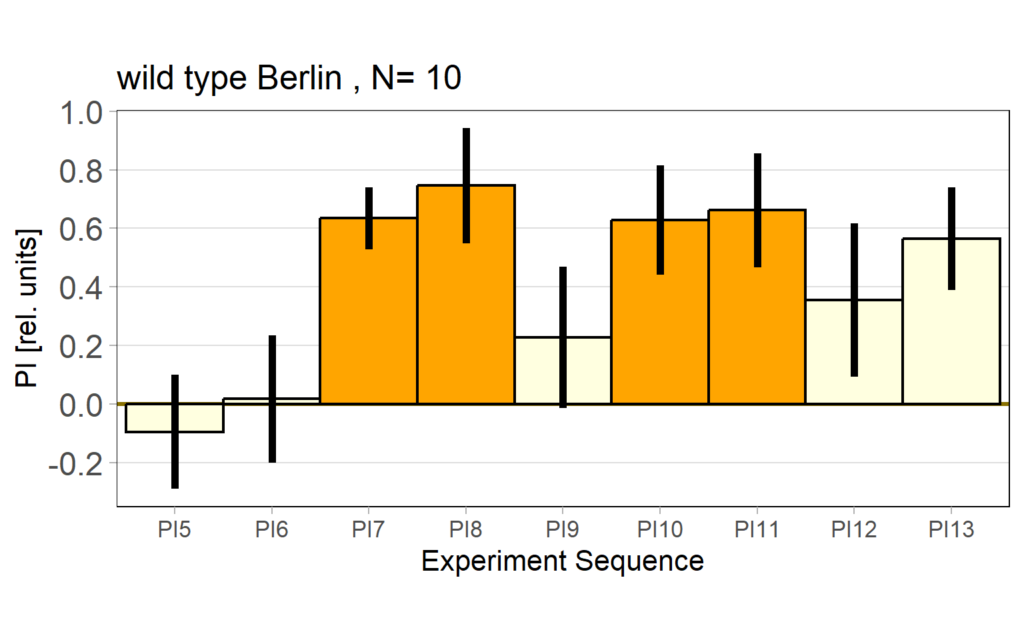
Performance Index bar plot with SEM:
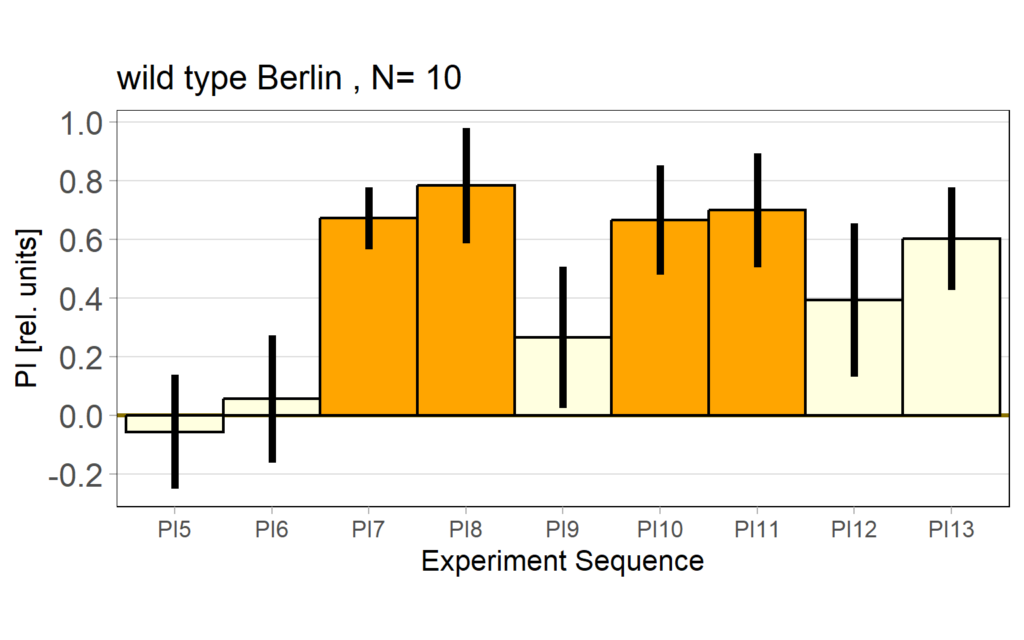
Performance Index bar plot – preference subtracted:
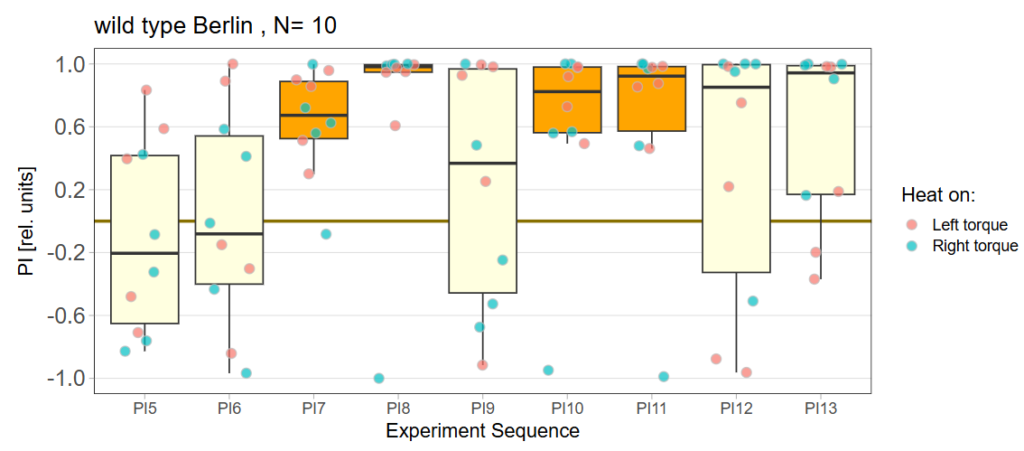
Performance Index box&dotplot without notches:
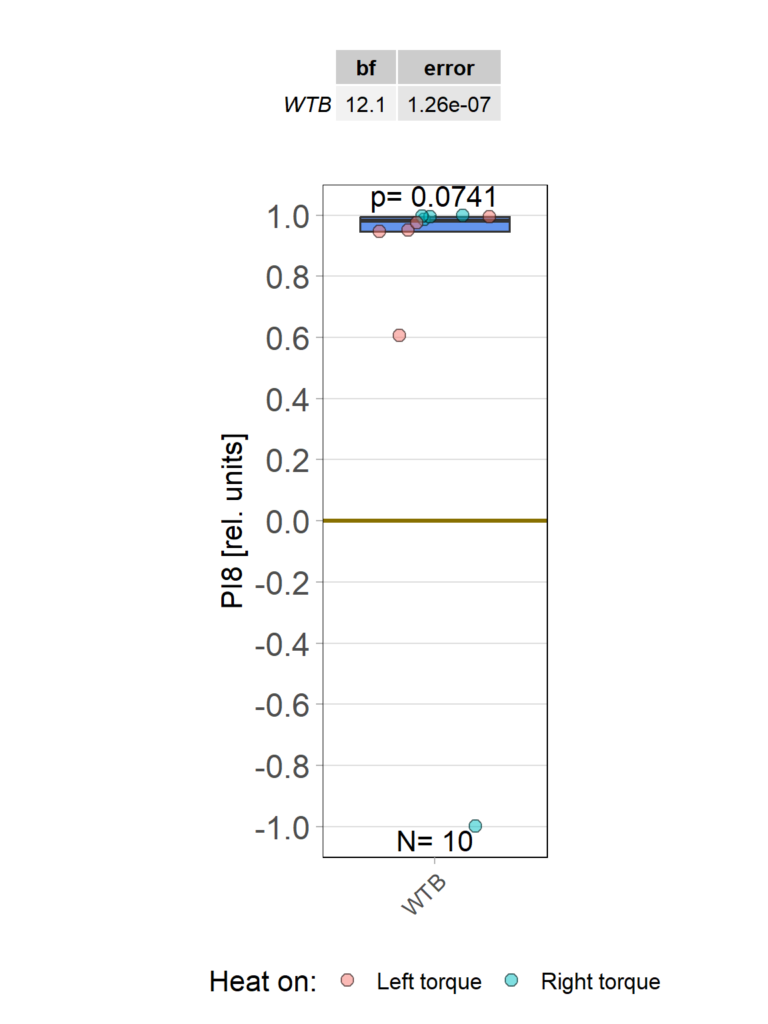
Statistical tests of single groups against zero

Category: Uncategorized
Leave a Reply