T maze experiment with yellow light
on Monday, July 12th, 2021 1:21 | by Parva Nasimi
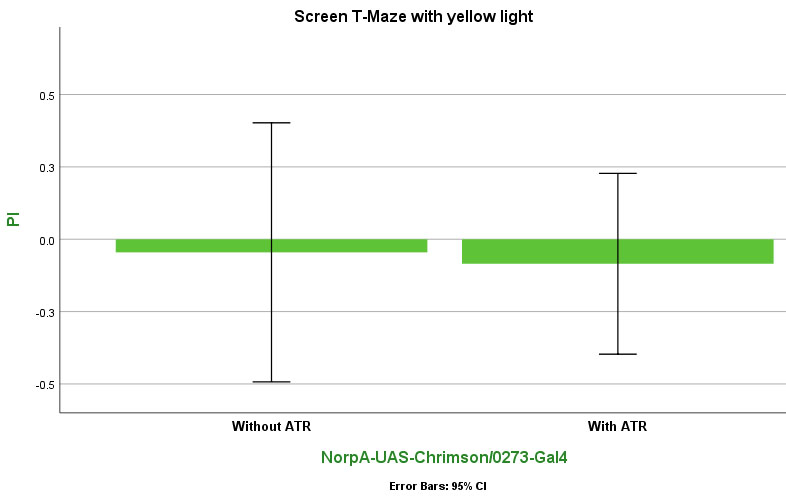
Graph shows “Mean Performance Index” for NorpA-UAS-Chrimson/0273-Gal4 flies.
Comparison between Control (Without ATR, n=5) and flies were given ATR-treated foods for 2days (n=12).

Category: Uncategorized
Leave a Reply