Update: Variability of Phototaxis 4: Buridan
on Friday, November 13th, 2015 11:06 | by Isabelle Steymans
Because the data in the last experiments seemed to be very similar in each of the different tubes and there were many problems with the evaluation of this data, I decided to redo this experiment.
I started testing the tubes 0 to 2, with only a number of 4 flies in group 0, 5 flies in group 1 and 7 flies in group 2. This difference in the number of flies is due to the previous Benzer-experiments I did to split the flies.
Below there are the new transitionplots of the different tubes tested (Fig.1) In this case we see that the different plots differ more form each other than in the last experiment.
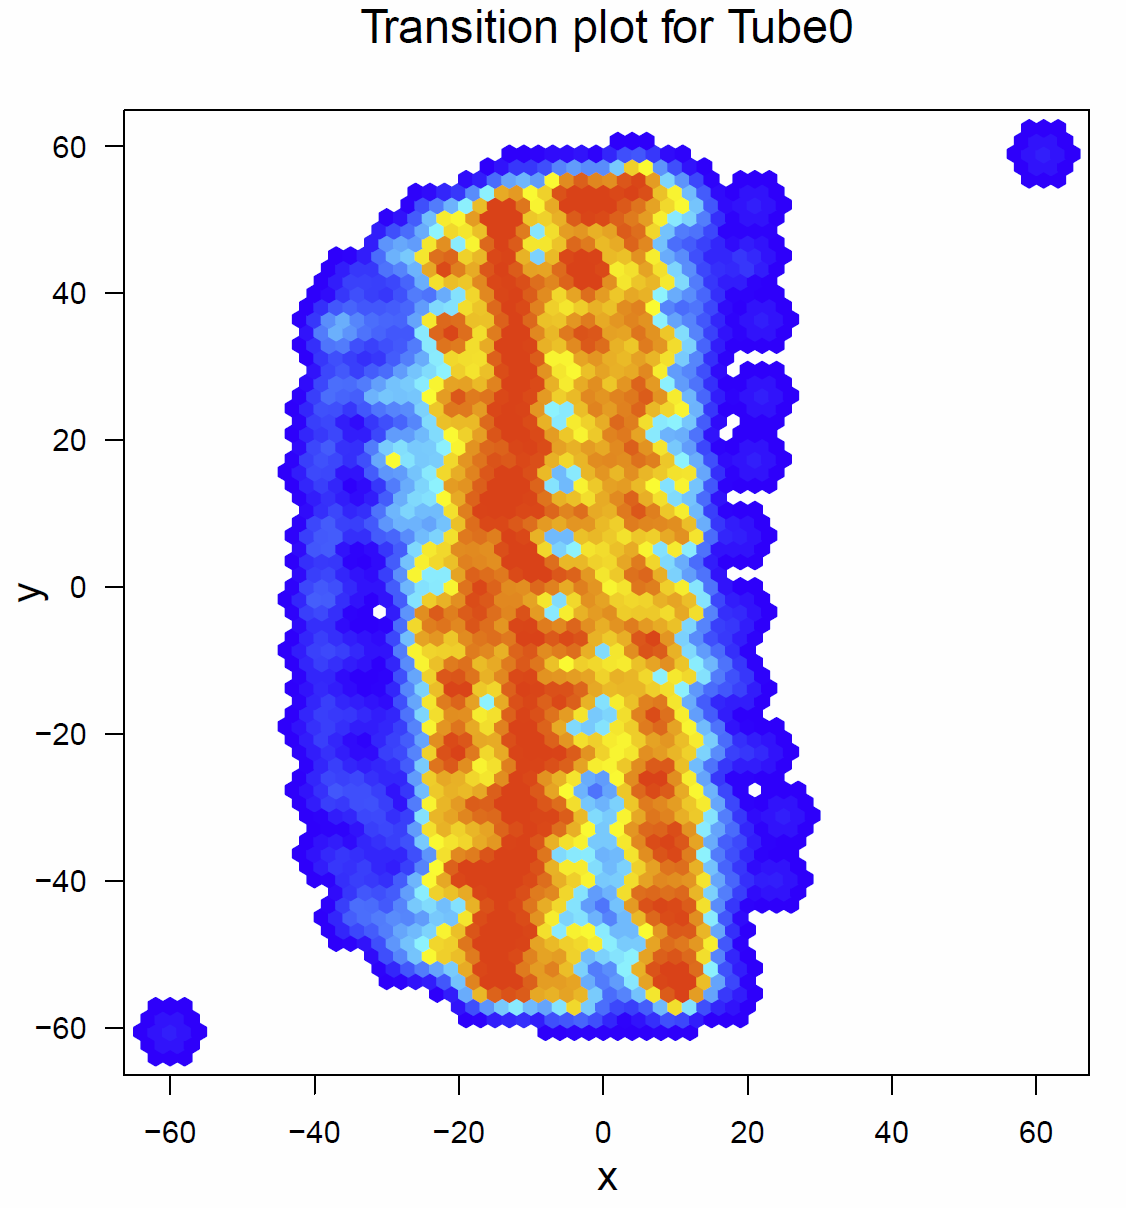
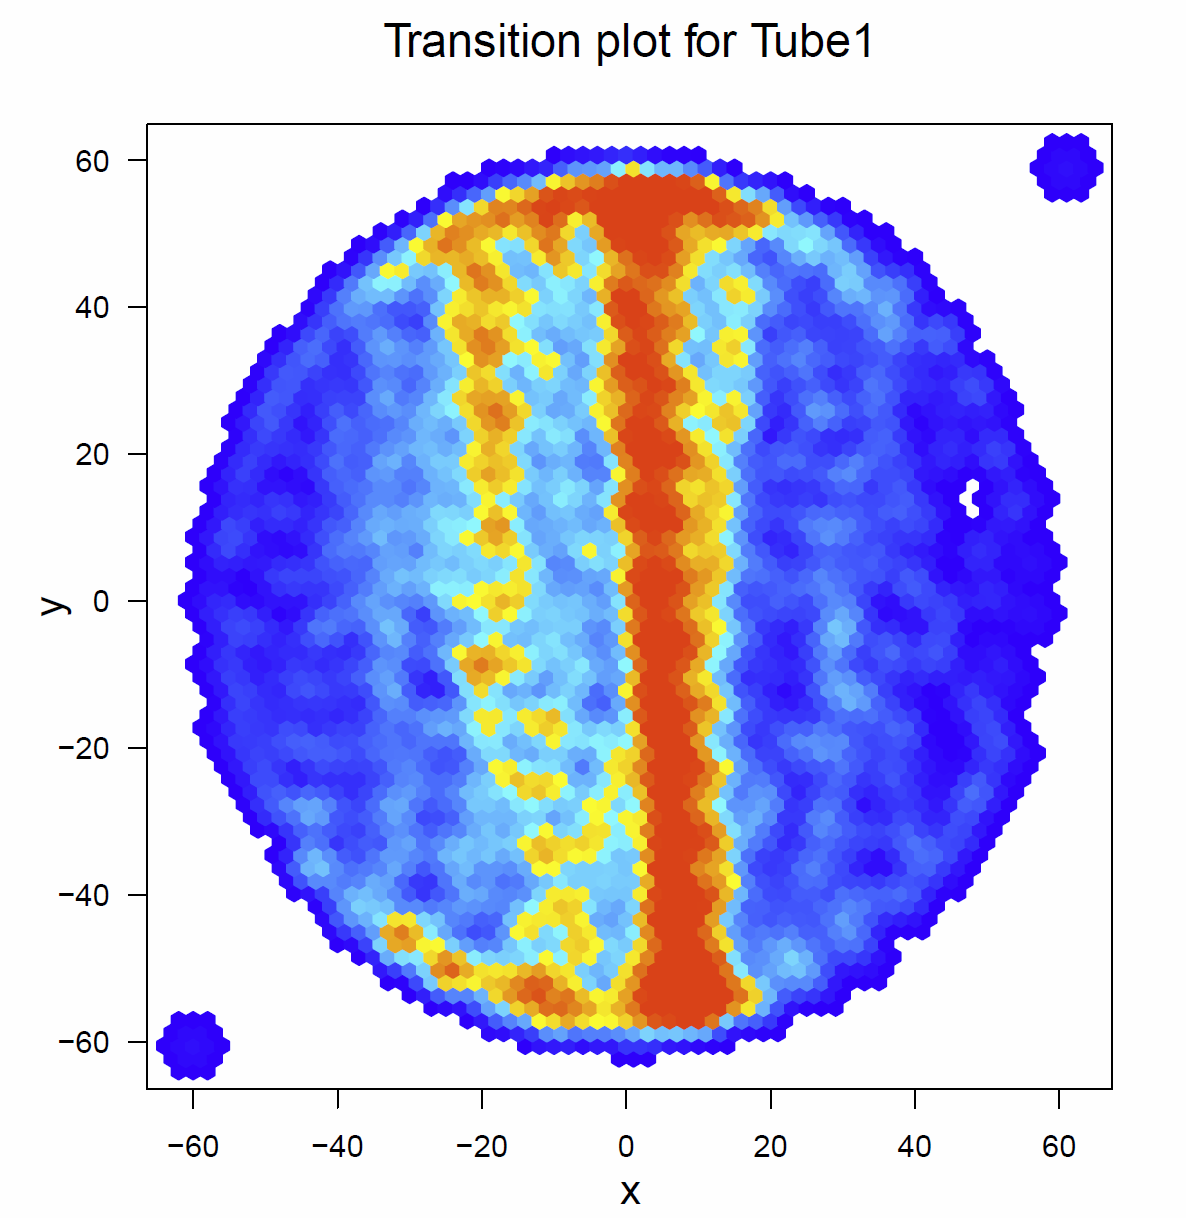
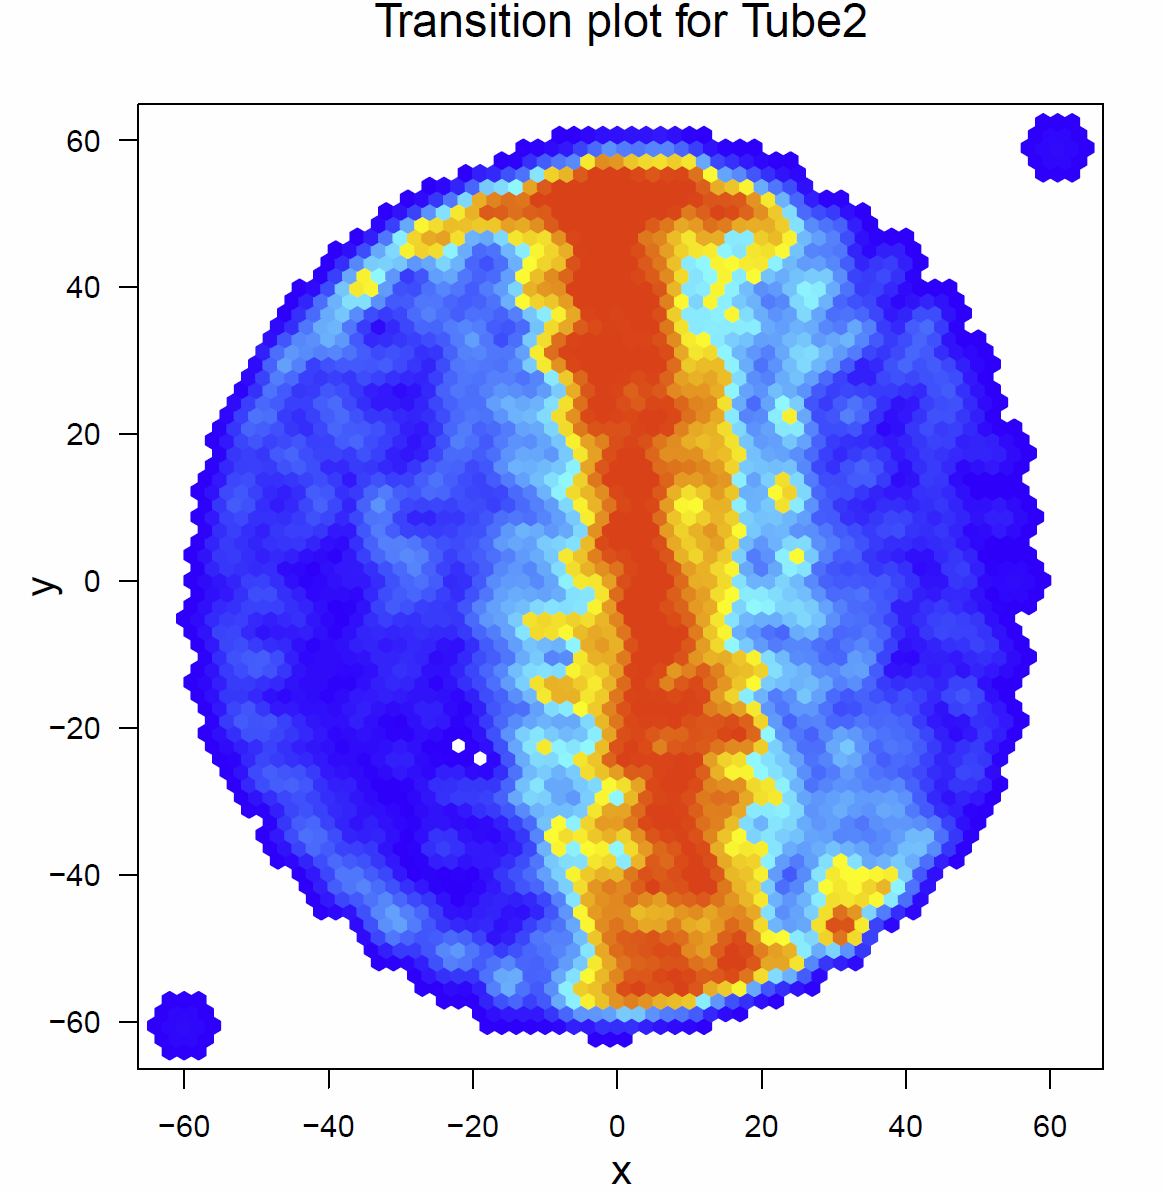
Fig. 1 Transitionplots Tube 0-2
This time I also had a look on the distance traveled per minute and the median speed (Fig. 2), the activitytime per minute (Fig. 3 & 4) , the pause duration and length, the number of pauses per minute (Fig. 5&6)
We see that the median speed, the pause duration and the number of pauses per minute are similar in all the groups. But there is a difference in the distance the flies traveled and the activitytime of these flies. Both are reduced in the flies of tube 0, whereas the flies of tube 1 and 2 are quite similar.
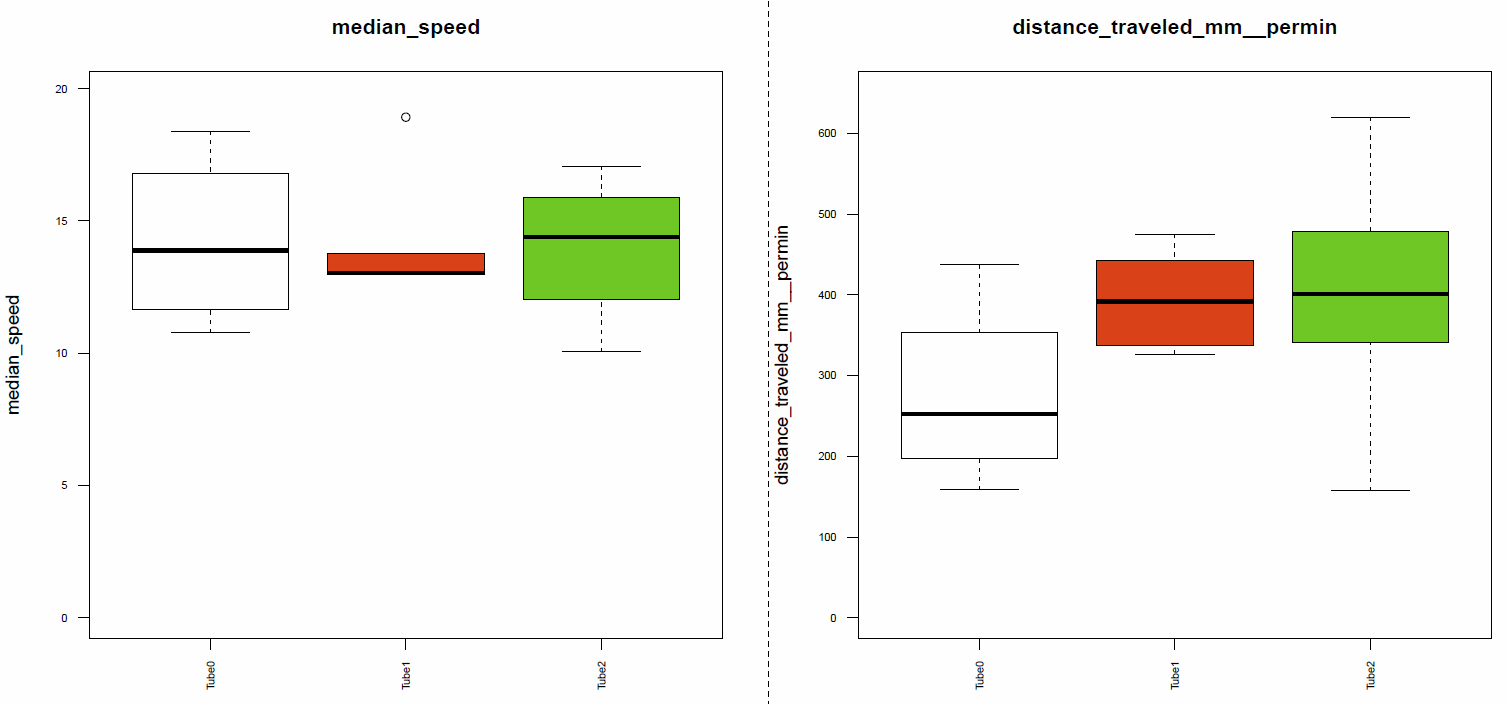
Fig. 2 median speed & distance traveled
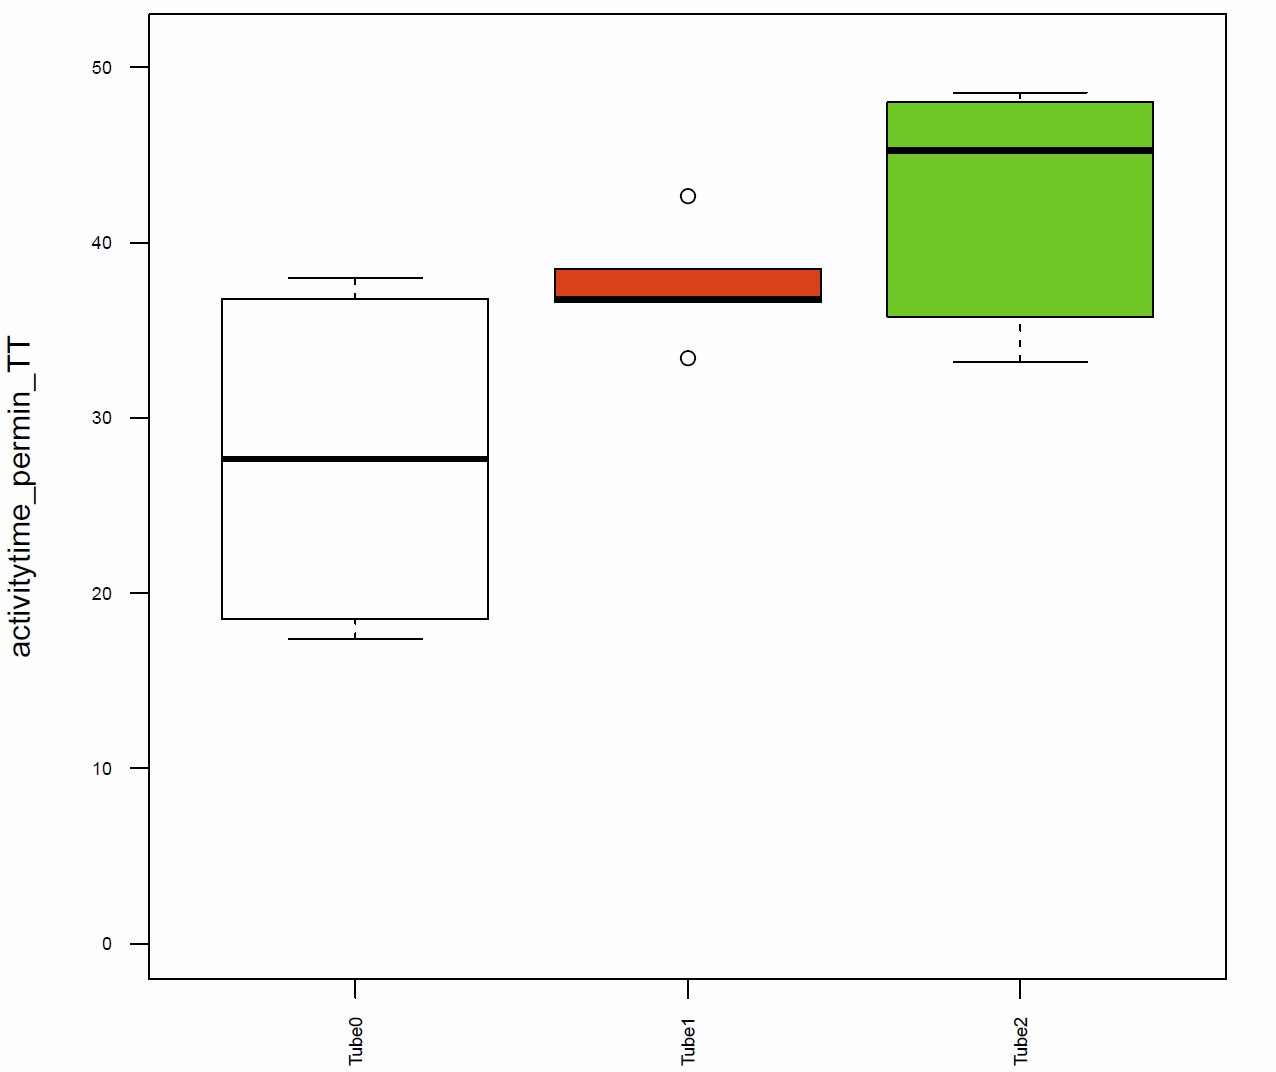
Fig. 3 Activitytime per minute (TT)
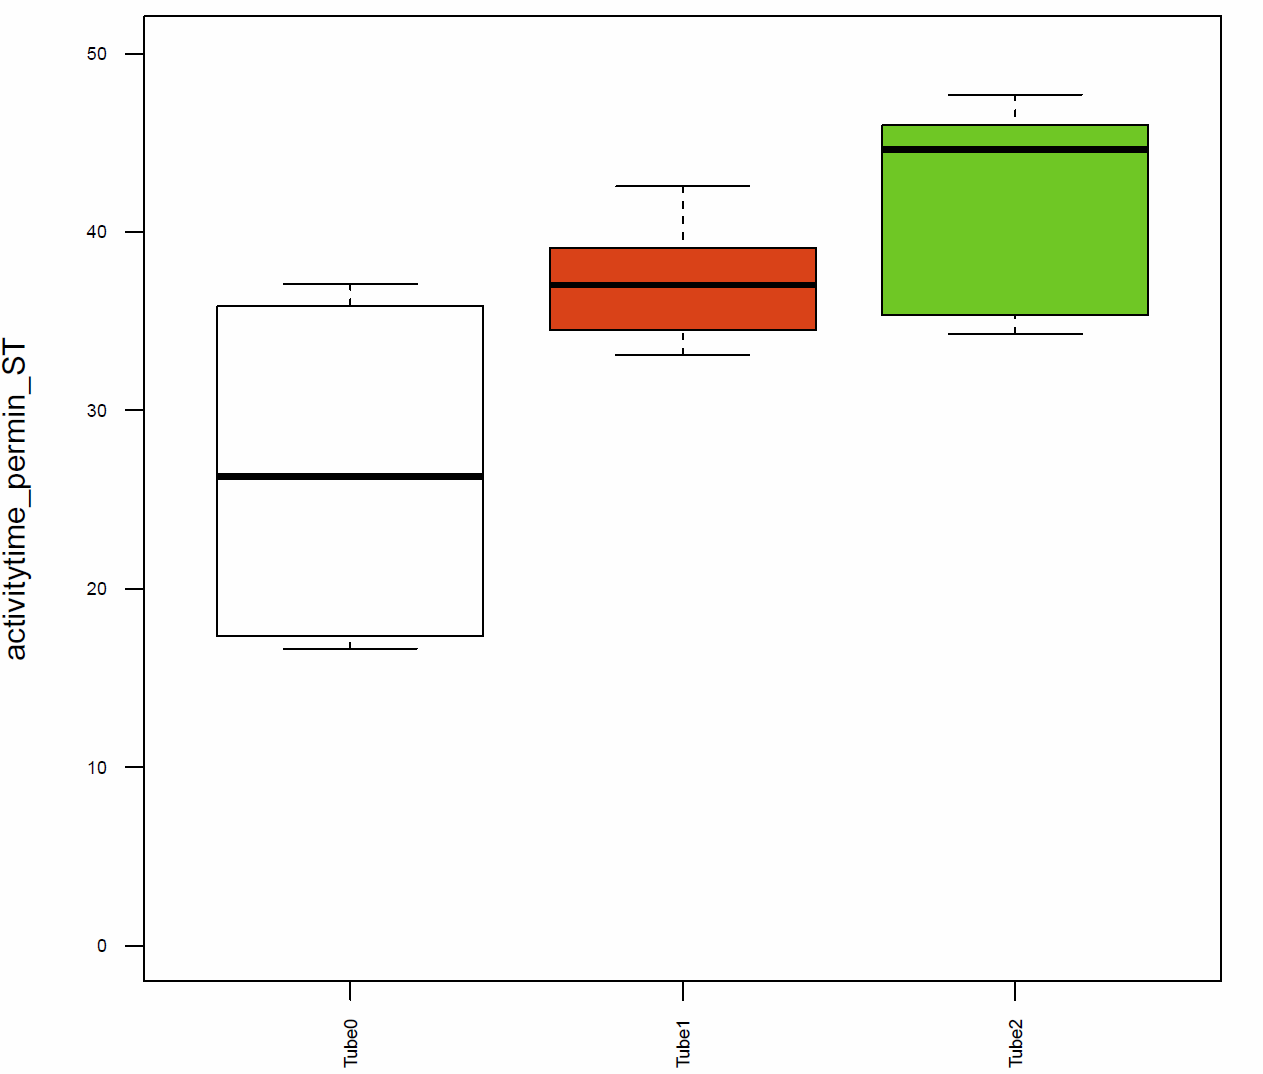
Fig. 4 Activitytime per minute (ST)
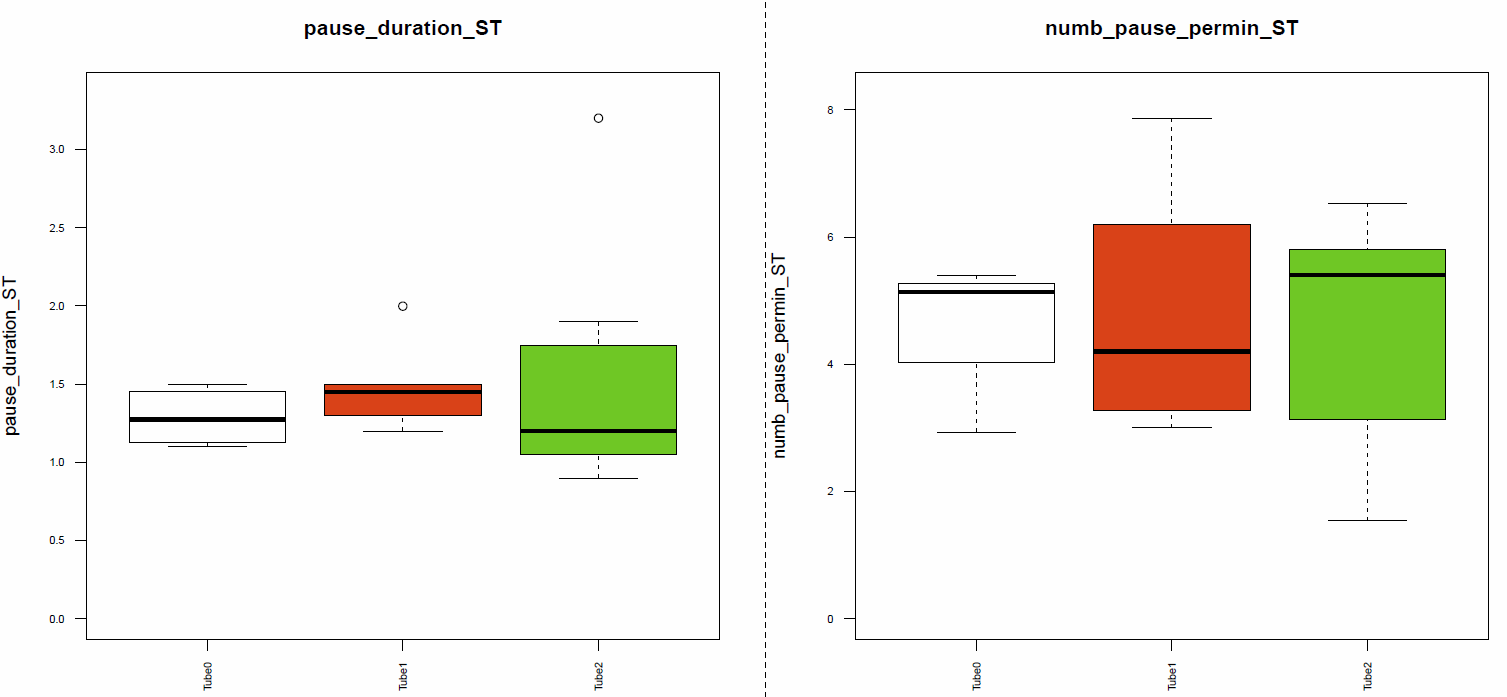
Fig. 5 Pause duration & number of pauses per minute (ST)
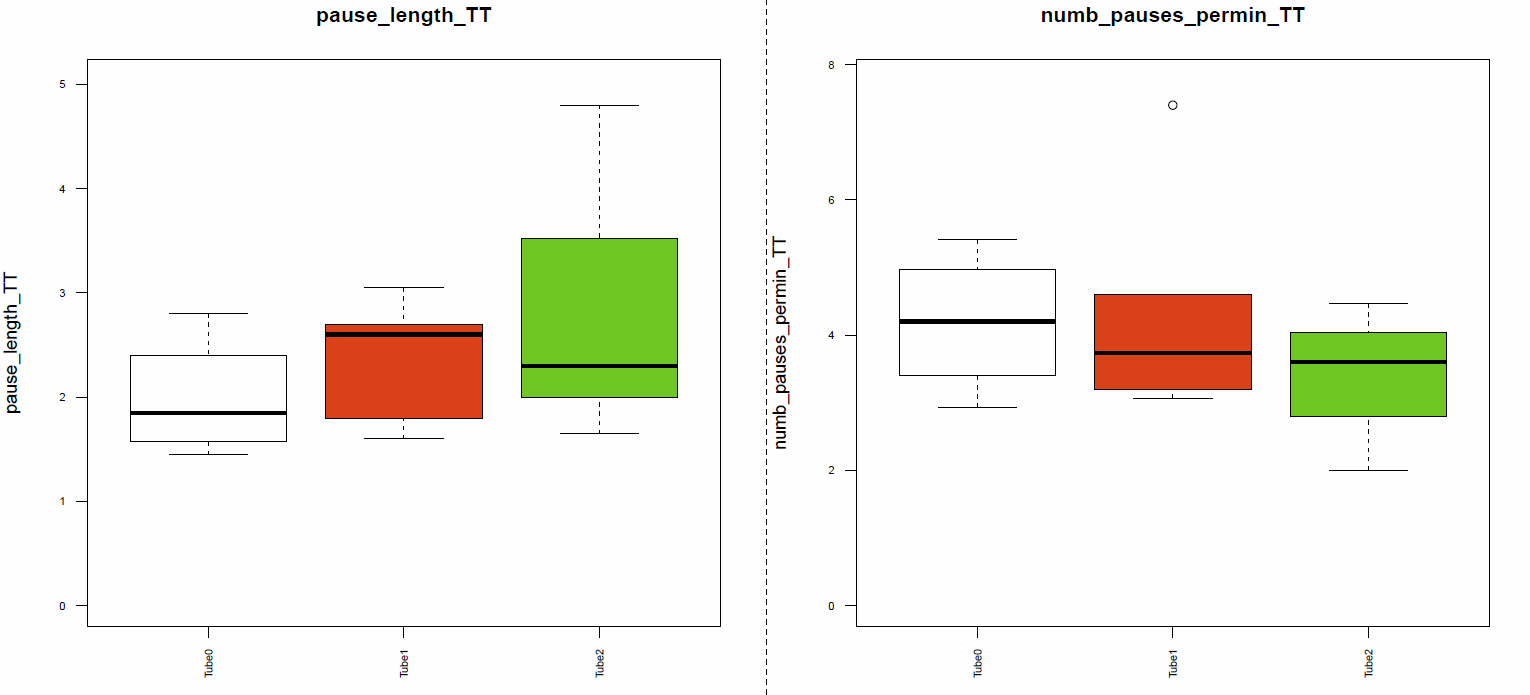
Fig. 6 pause length & number of pauses per minute (TT)

Category: Individual choices in population paradigm, wing clipping
Leave a Reply