Results of T-maze experiments (yellow light)
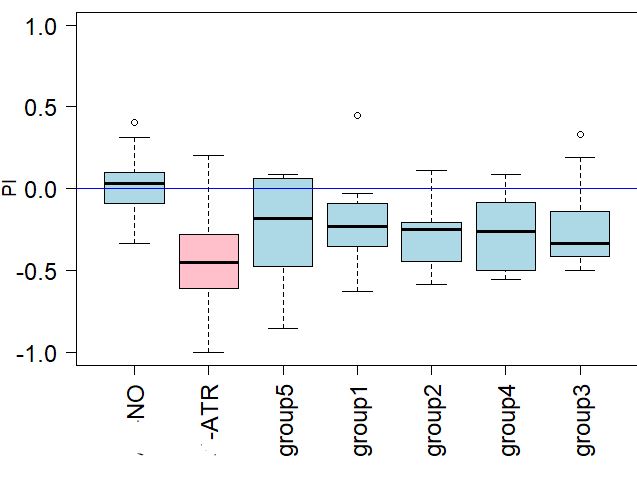
T- maze experiments were done with Norpa/Crimson x Gr28bd/TrpA1 lines without ATR (n=28) and with ATR (n=28). We have done all experiments which belong to Norpa/Crimson x Gr28bd/TrpA1lines. End of all experiments with them; the ATR ones seem like tend to escape from the yellow light as shown at the graph. NO ATR ones seem like moving more randomly.
On the other hand 5 different groups (THD’-GAL4xNorpA/Crimson with and without ATR, THD1-GAL4xNorpA/Crimson with and without ATR and W[1118]x NorpA/Crimson). Group1 (n=10) Group2(n=11) Group3(n=9) Group4 (n=10) Group5(n=9). Still, we don’t know that the which lines belong to which groups. The graph shows the PI numbers according to the T-maze experiments that we have done.
T-Maze
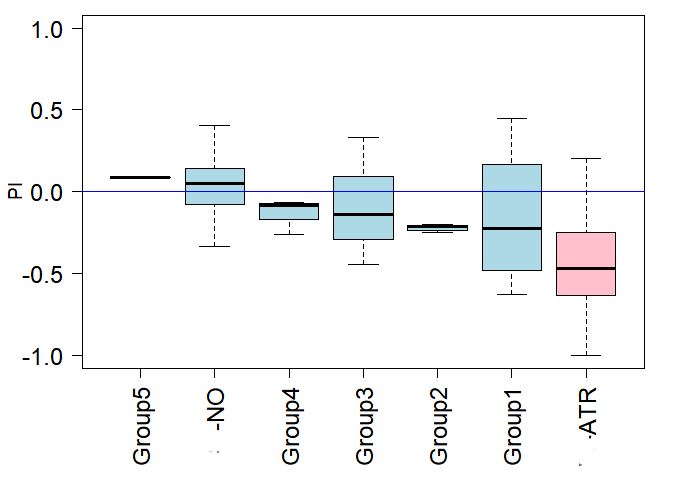
T- maze experiments were done with Norpa/Crimson x Gr28bd/TrpA1 lines without ATR (n=18) and with ATR (n=22) and 5 different groups (THD’-GAL4xNorpA/Crimson with and without ATR, THD1-GAL4xNorpA/Crimson with and without ATR and W[1118]x NorpA/Crimson). Group1 (n=4) Group2(n=4) Group3(n=3) Group4 (n=3) Group5(n=1)We don’t know that the which lines belong to which groups to make the process more reliable. The graph shows the PI numbers according to the T-maze experiments that we have done.
Results of T-maze experiments
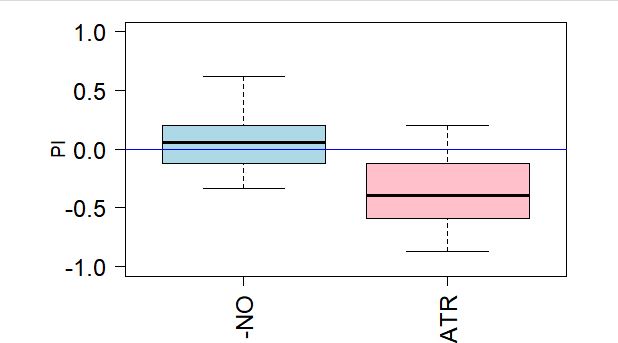
T-maze experiments were done with Norpa/Crimson x Gr28bd/TrpA1 lines without ATR (n=14) and with ATR (n=15) and. The graph shows the PI numbers according to the T-maze experiments that we have done.
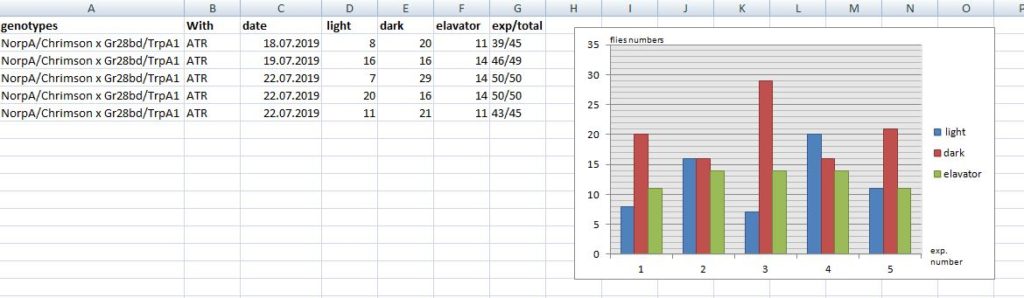
Stripe Deviation of flies
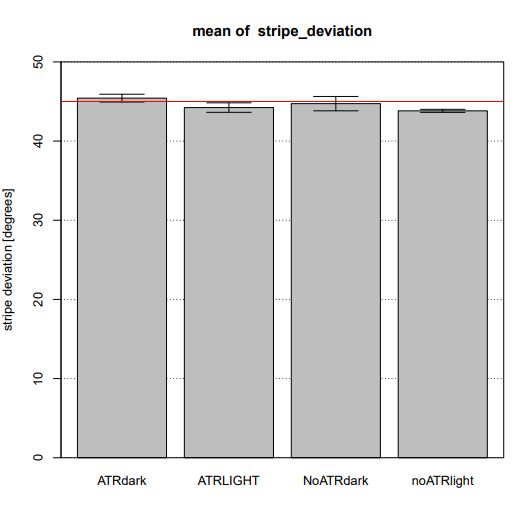
Norpa/Crimson x Gr28bd/TrpA1 lines waited in vials which two of them include ATR and other two not. After doing T- maze experiment (at yellow light) their wings were clipped and next day Buridan test was done with them. This graph shows the stripe deviation of experimented flies. ATR dark(n=3), ATRlight(n=3),NoATRdark(n=4),NoATRlight(n=5). The result shows that experimented flies could not see and their motions were random.