Prediction with binnning
on Monday, March 21st, 2016 1:13 | by Christian Rohrsen
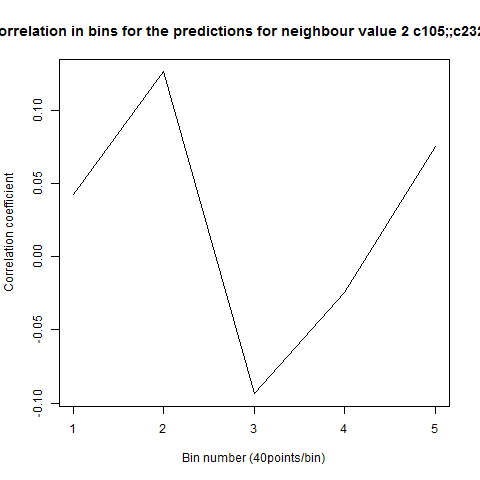
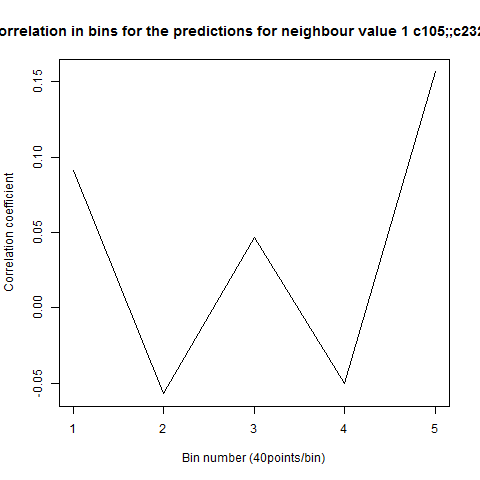
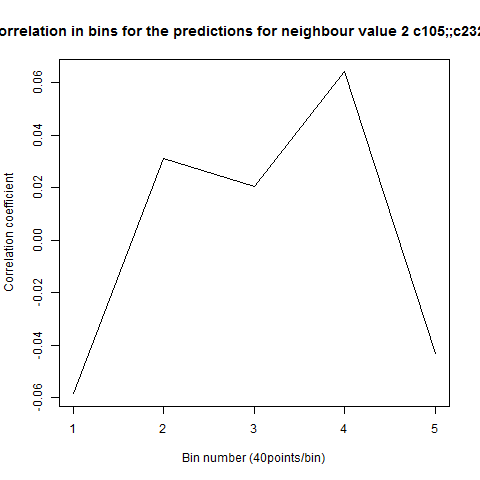
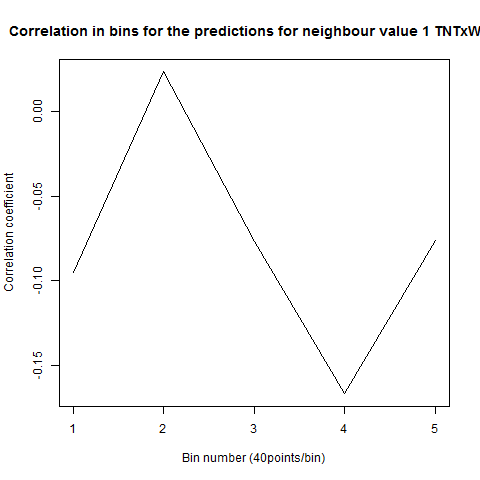
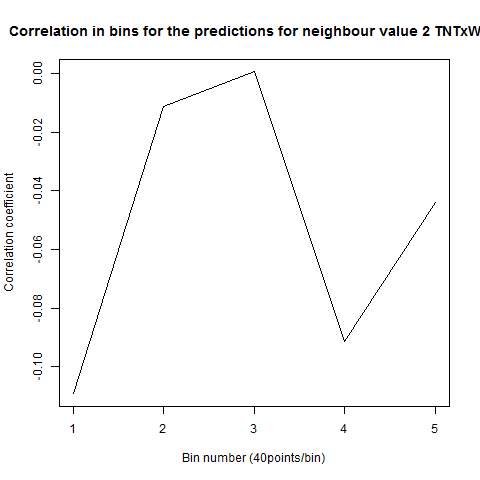
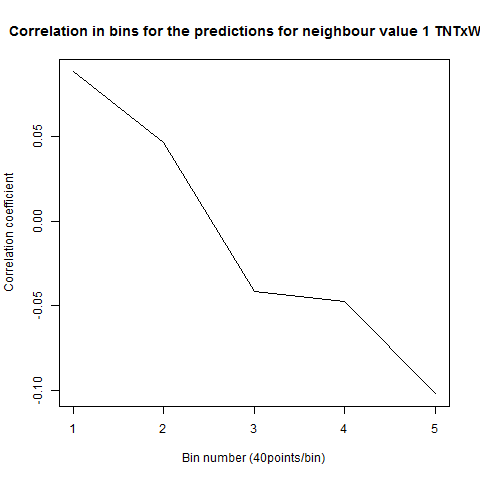
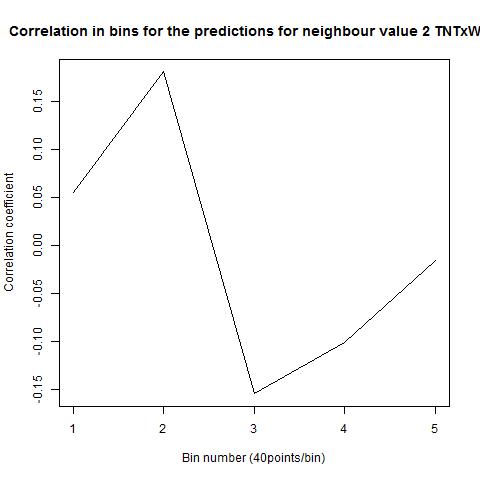
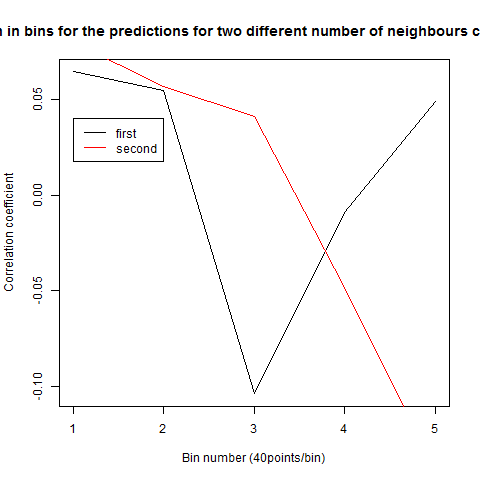
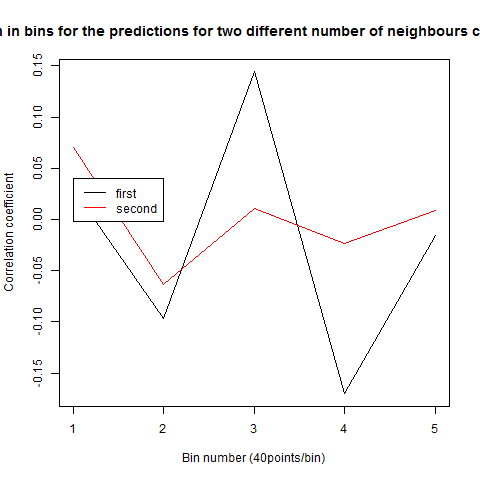
To see if there is an exponential decay in the prediction of the fly traces we did correlations of bins of 40 data points. We have 4 graphs (the last one merged) which consist of predictions at two different points with two different number of neighbours used for the prediction. So we have for each group sucesively: prediction at the first prediction point with the first number of neigbours, then the same with different number of neighbours. The last two are two different numbers of neighbours for the second prediction point. In the order: c105;;c232>TNT, TNTxWTB, c105;;c232xWTB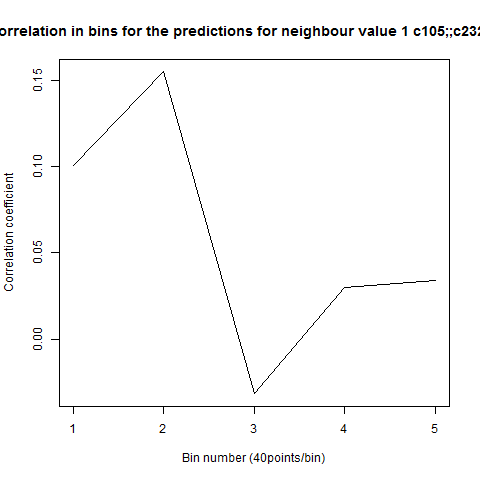

Category: R code, Spontaneous Behavior, strokelitude, WingStroke
Leave a Reply