Current T-Maze results and power analysis
on Friday, December 5th, 2025 2:35 | by Daniel Döringer
I am currently still performing T-Maze experiment with red light, to check for dopamine dependency of the effect I observed in the original 1 vs. 10 minute T-Maze experiments using yellow light and PPM2 flies.
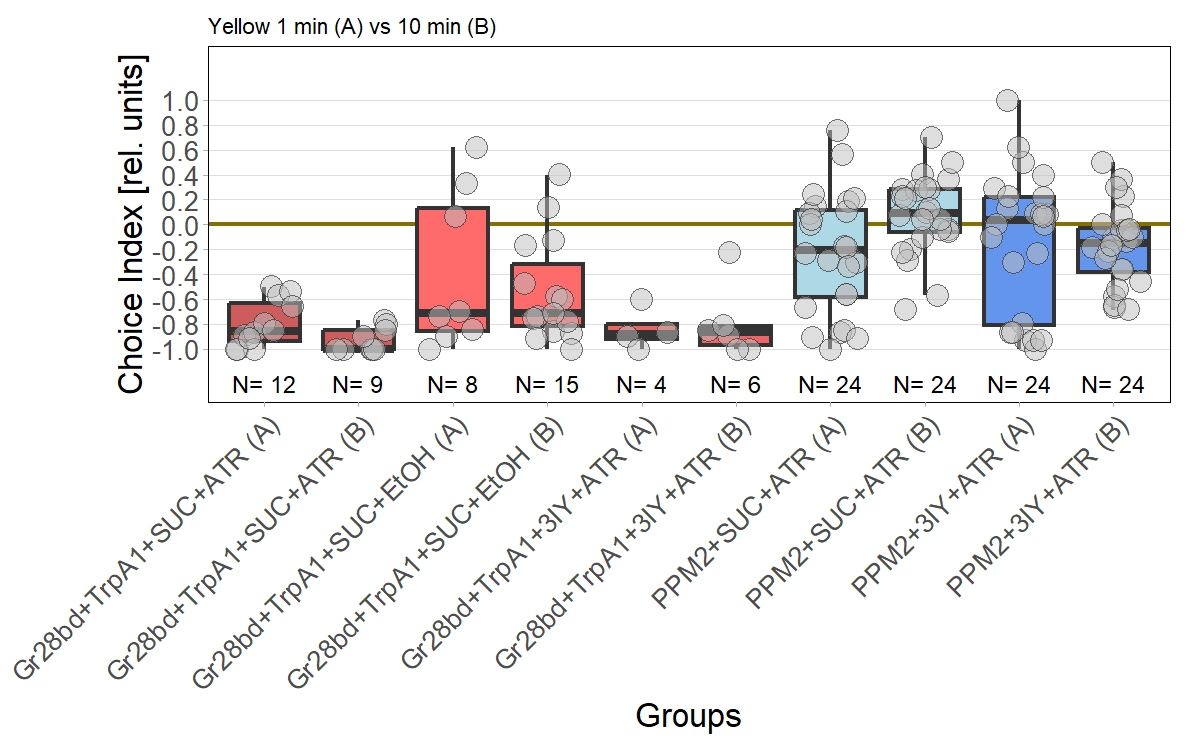
For now I planned to aim for a sample size of 30 experiments per experimental group, with the justification that this was also was I aimed for in the original screen. To see whether this sample size is sufficient to verify the effect (or it’s absence) I performed a power analysis and based it on the previously observed effect size.
Cohen’s d (from original screen) = -1.023 (large effect)
I used the power.np.wilcoxon() function from the pwrss package to calculate the sample size needed to achieve 80% statistical power with an alpha level of 0.005.
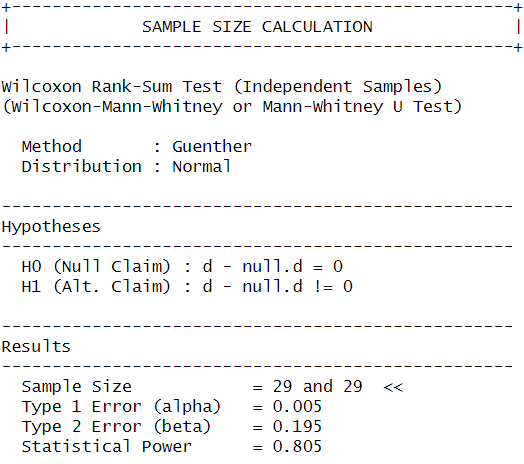
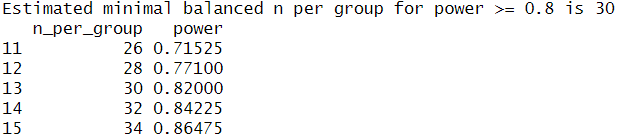
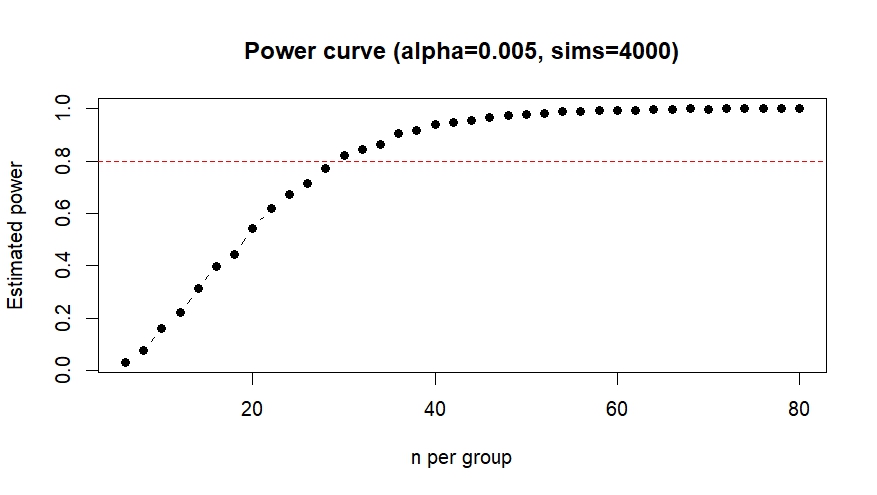
This confirmed that I would need at least 29 observations per group to detect the same effect as observed before, so I will keep aiming for a sample size of 30. Since I was unsure whether my analysis was correct I performed a second power analysis in R with an analysis script provided by ChatGPT, which calculated the sample size using simulated drawings from my original data. This analysis also resulted in a target sample size of 30 so I am fairly confident my calculations were correct.

Category: Optogenetics
Leave a Reply