Beta results from first test drive OptoMoto
on Monday, September 24th, 2018 1:56 | by Max von der Linde
The different stages of data processing:
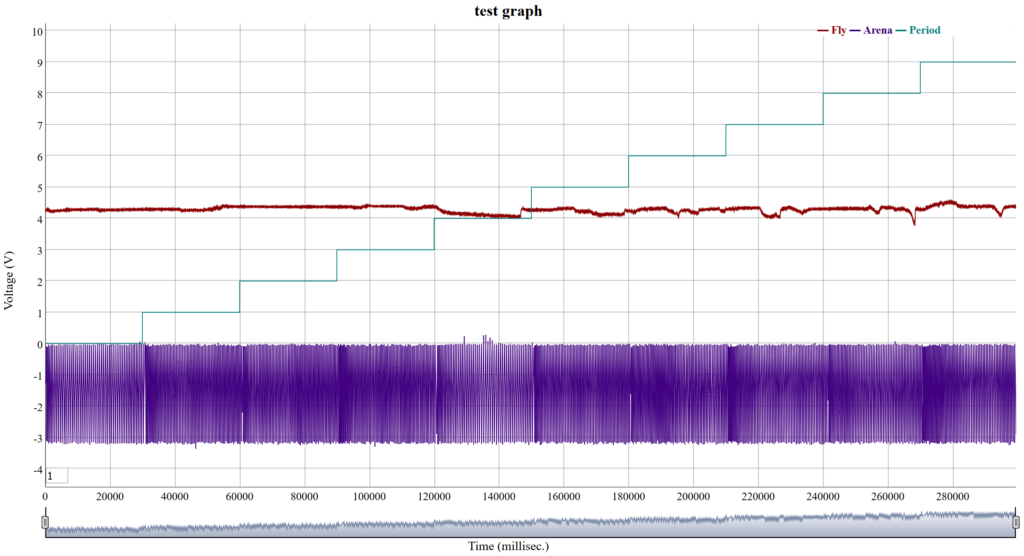
1. single fly dyplot with all data present
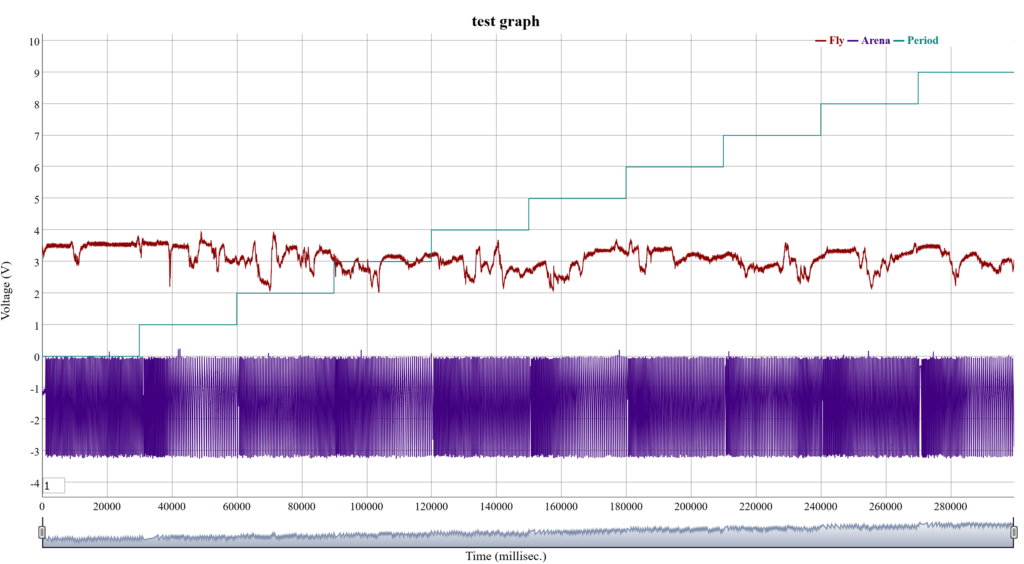
![](https://lab.brembs.net/wp/wp-content/uploads/2018/09/E11normalF-1024x564.png)
E11(normalF)
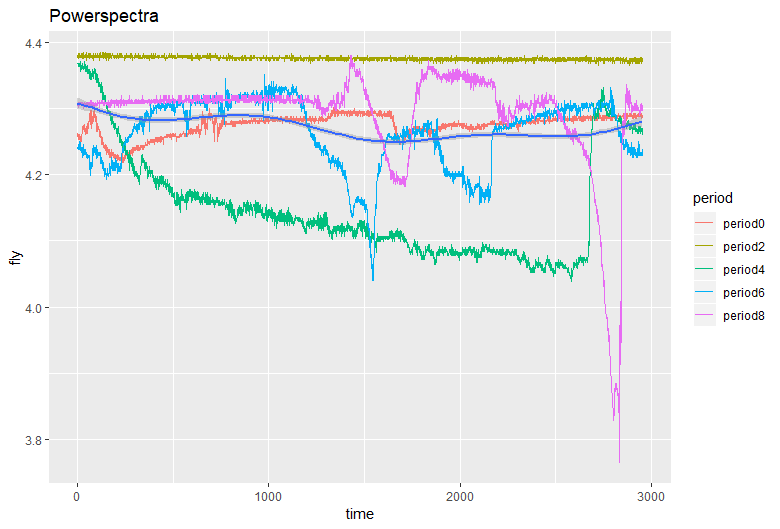
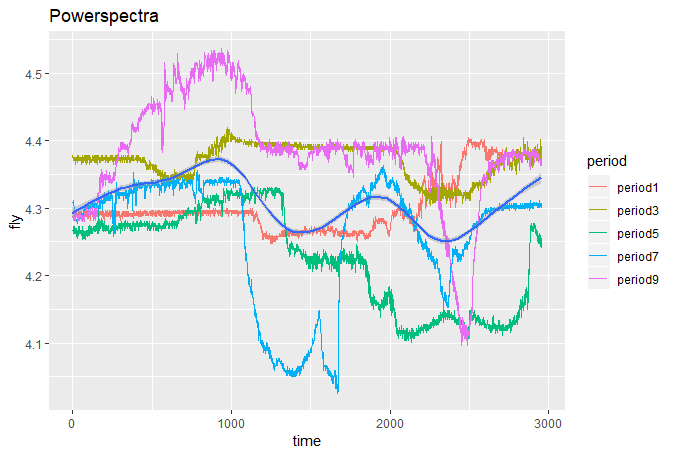
2. Plot of all the even / odd periods of one fly
![](https://lab.brembs.net/wp/wp-content/uploads/2018/09/E11normalFeven_period_plot.png)
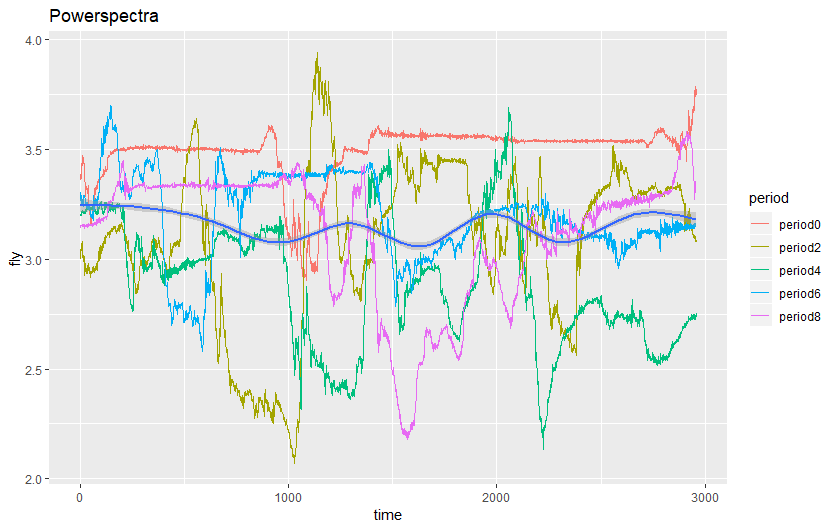
E11(normalF)even_period_plot
![](https://lab.brembs.net/wp/wp-content/uploads/2018/09/E11normalFodd_period_plot.png)
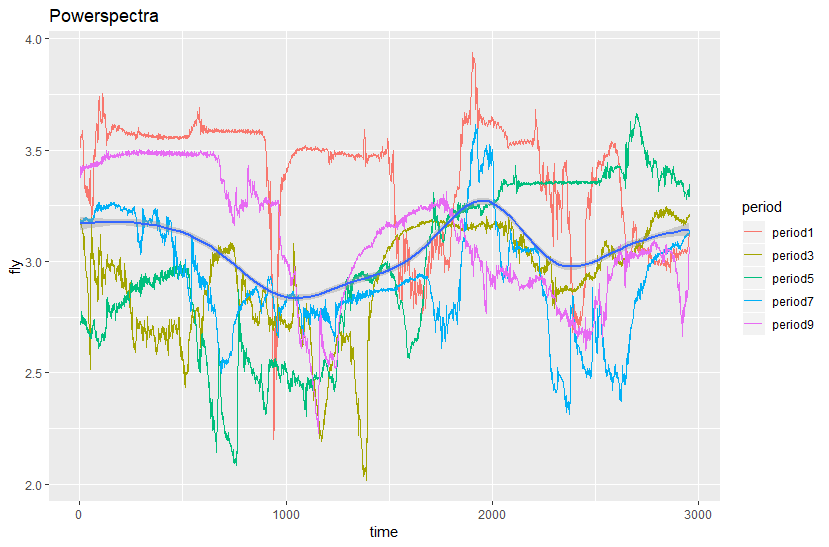
E11(normalF)odd_period_plot
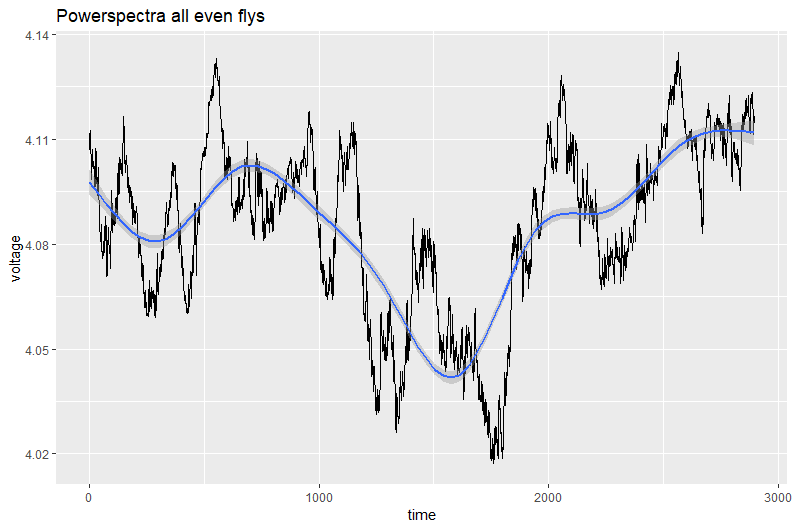
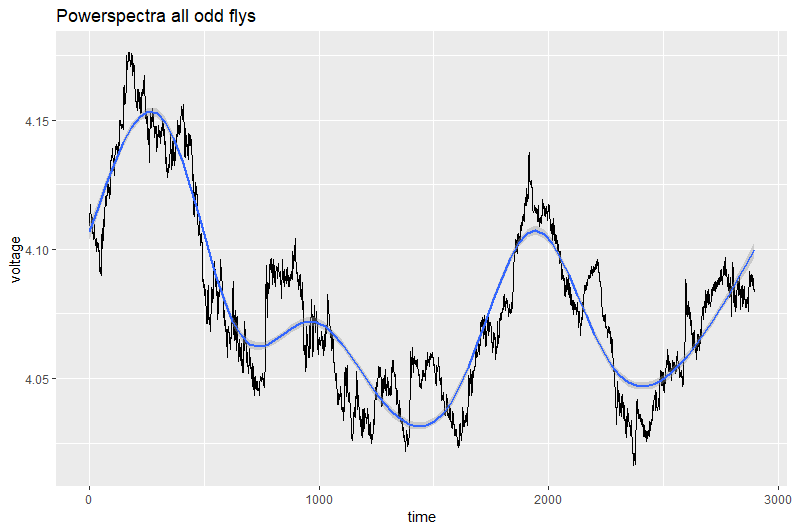
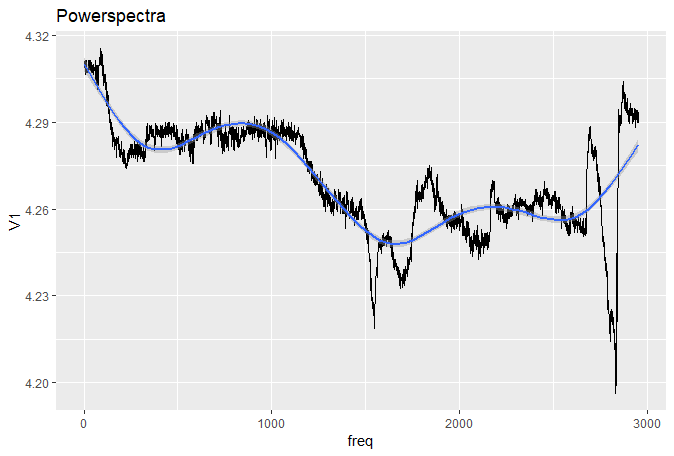
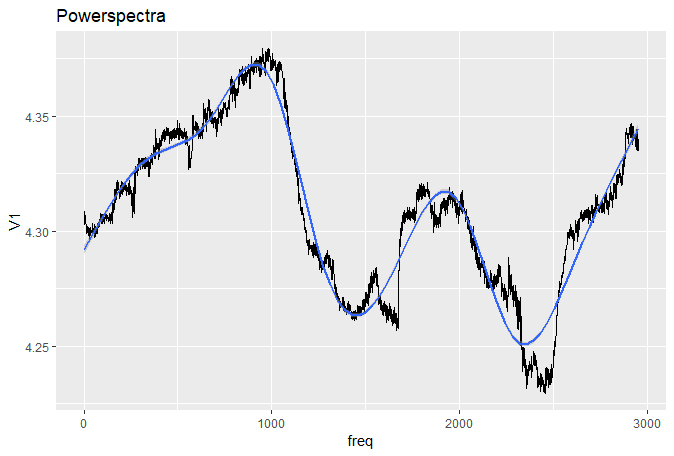
3. Plot of all even / odd Periods of one fly merged
![](https://lab.brembs.net/wp/wp-content/uploads/2018/09/E11normalFeven_merged_plot.png)
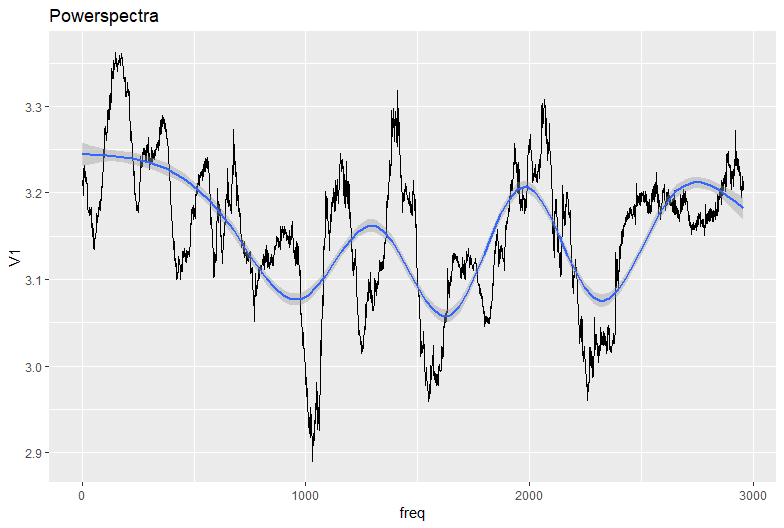
E11(normalF)even_merged_plot
![](https://lab.brembs.net/wp/wp-content/uploads/2018/09/E11normalFodd_merged_plot.png)
E11(normalF)odd_merged_plot
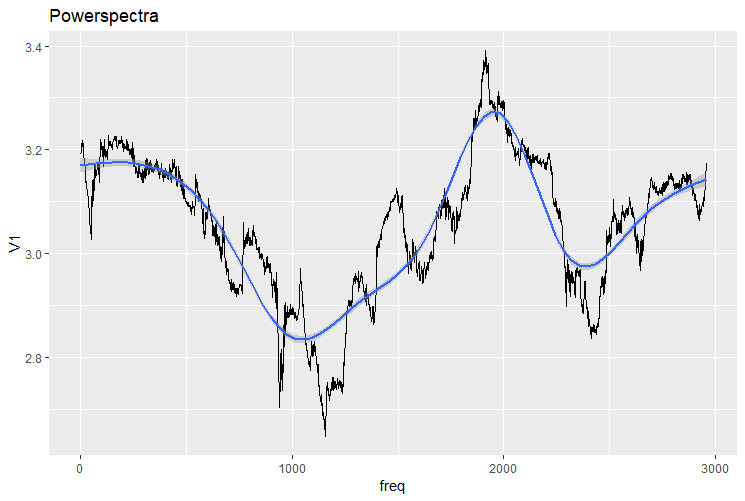
4. Plot of the even/odd periods from all tested flys
Another example (first fly tested):
![](https://lab.brembs.net/wp/wp-content/uploads/2018/09/E1normalFeven_period_plot.png)
E1(normalF)period_plot
![](https://lab.brembs.net/wp/wp-content/uploads/2018/09/E1normalFeven_merged_plot.png)
even_merged
Category: Uncategorized
Leave a Reply