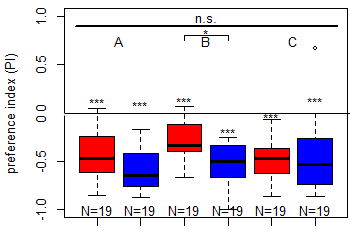
Salt (1.5 M) avoidance test in TH-D1-Gal4 larvae under red and blue light [N = 19]
on Sunday, November 23rd, 2025 2:43 | by Christoph Kumpfmüller
Category: crosses, Larve, Mushroom Body, Optogenetics | No Comments
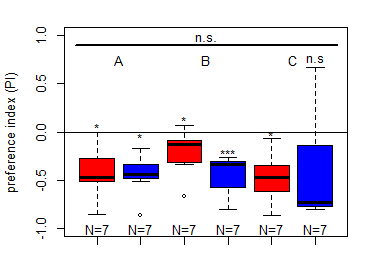
Salt (1.5 M) avoidance test in TH-D1-Gal4 larvae under red and blue light
on Saturday, November 15th, 2025 2:53 | by Christoph Kumpfmüller
Category: DAN, Larve, MBON, Mushroom Body, Optogenetics | No Comments
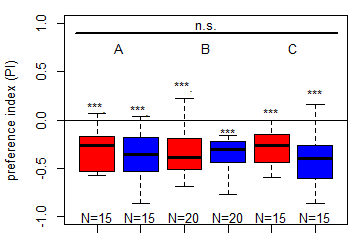
Update to the Salt (1.5 M) avoidance tests for the DANc1 larvae tests under red and blue light
on Sunday, November 9th, 2025 5:25 | by Christoph Kumpfmüller
Category: crosses, DAN, Larve, Mushroom Body, Optogenetics | No Comments
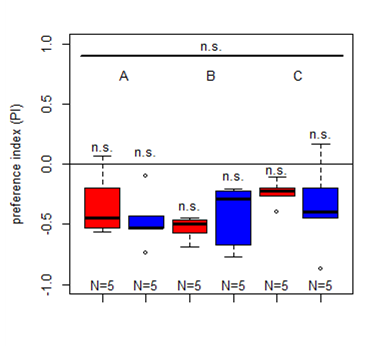
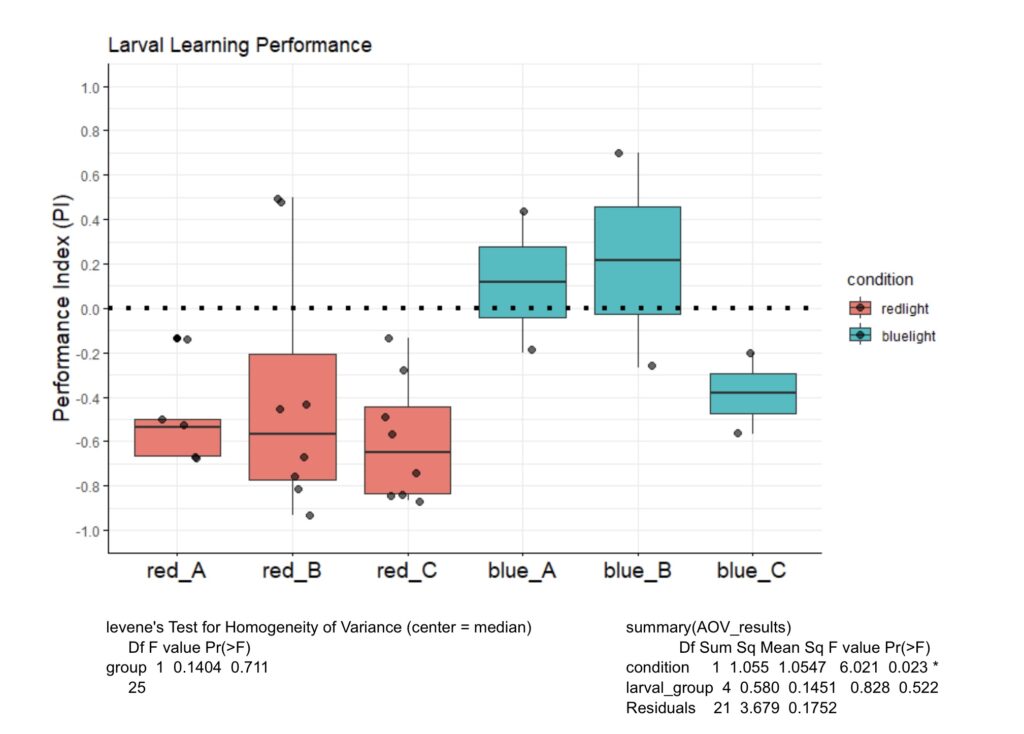
First results for Salt (1.5 M) avoidance tests in group A, B and C under red and blue light
on Sunday, November 2nd, 2025 5:27 | by Christoph Kumpfmüller
Category: crosses, DAN, Larve, Mushroom Body, Optogenetics | No Comments
Salt Avoidance under blue & red light
on Monday, February 17th, 2025 11:25 | by Eva Schächtl
Category: Food preference, Larve, Mushroom Body, Optogenetics | No Comments
Enes and Aslıhan joystick results of ATR and NOATR Control, ATR SifaG4 and ATR 13.0273 for yellow light.
on Wednesday, August 24th, 2022 10:32 | by Enes Seker
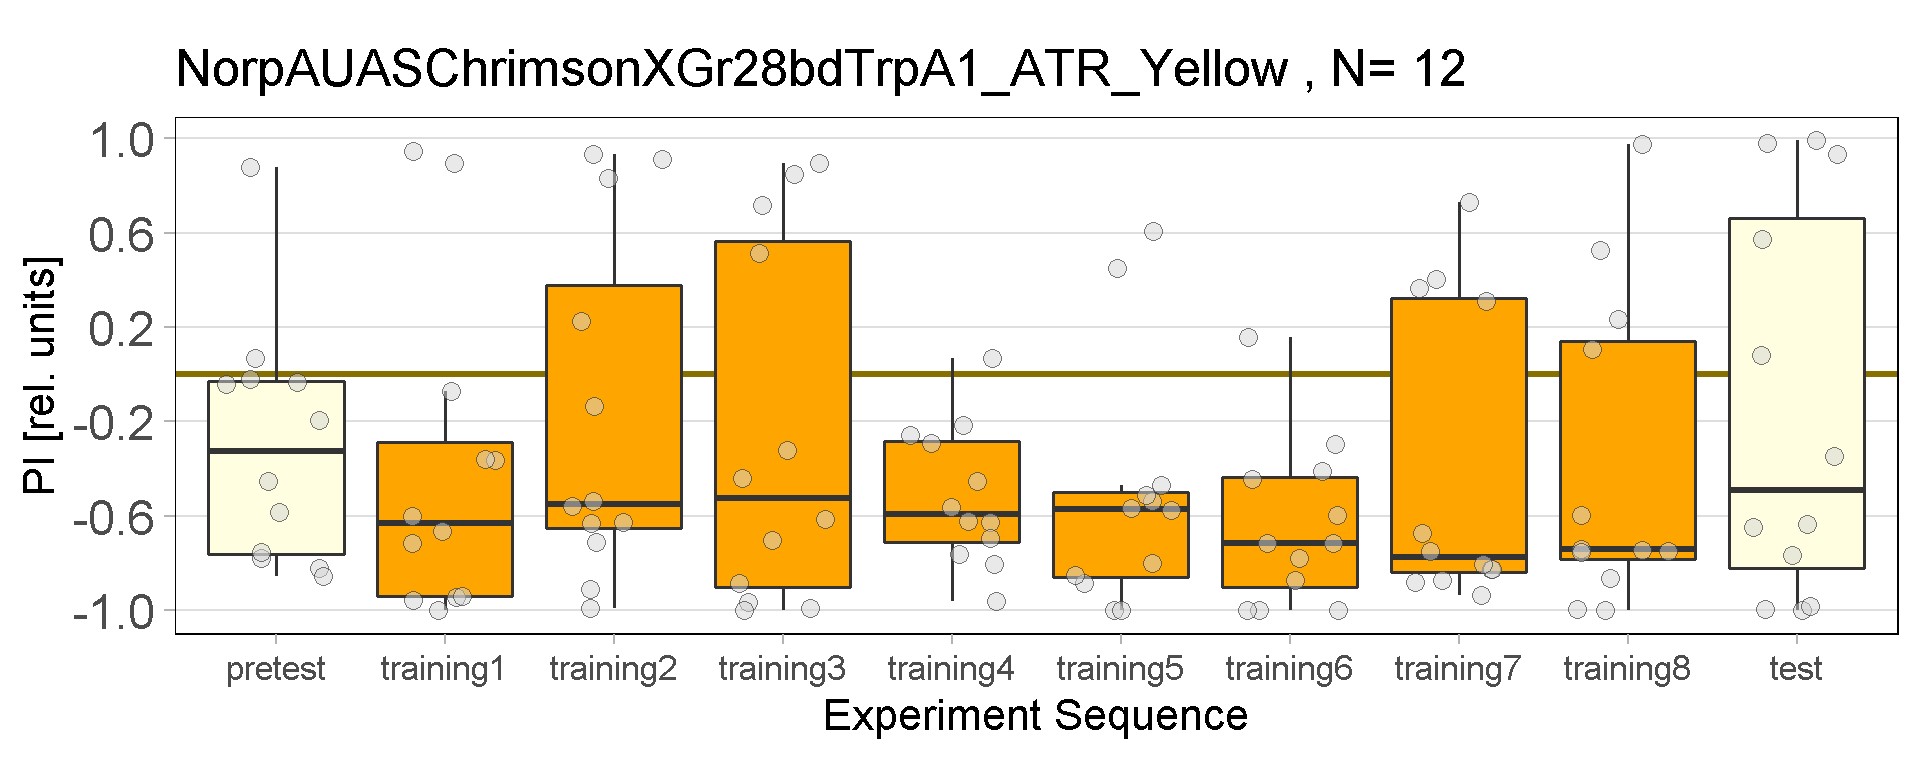
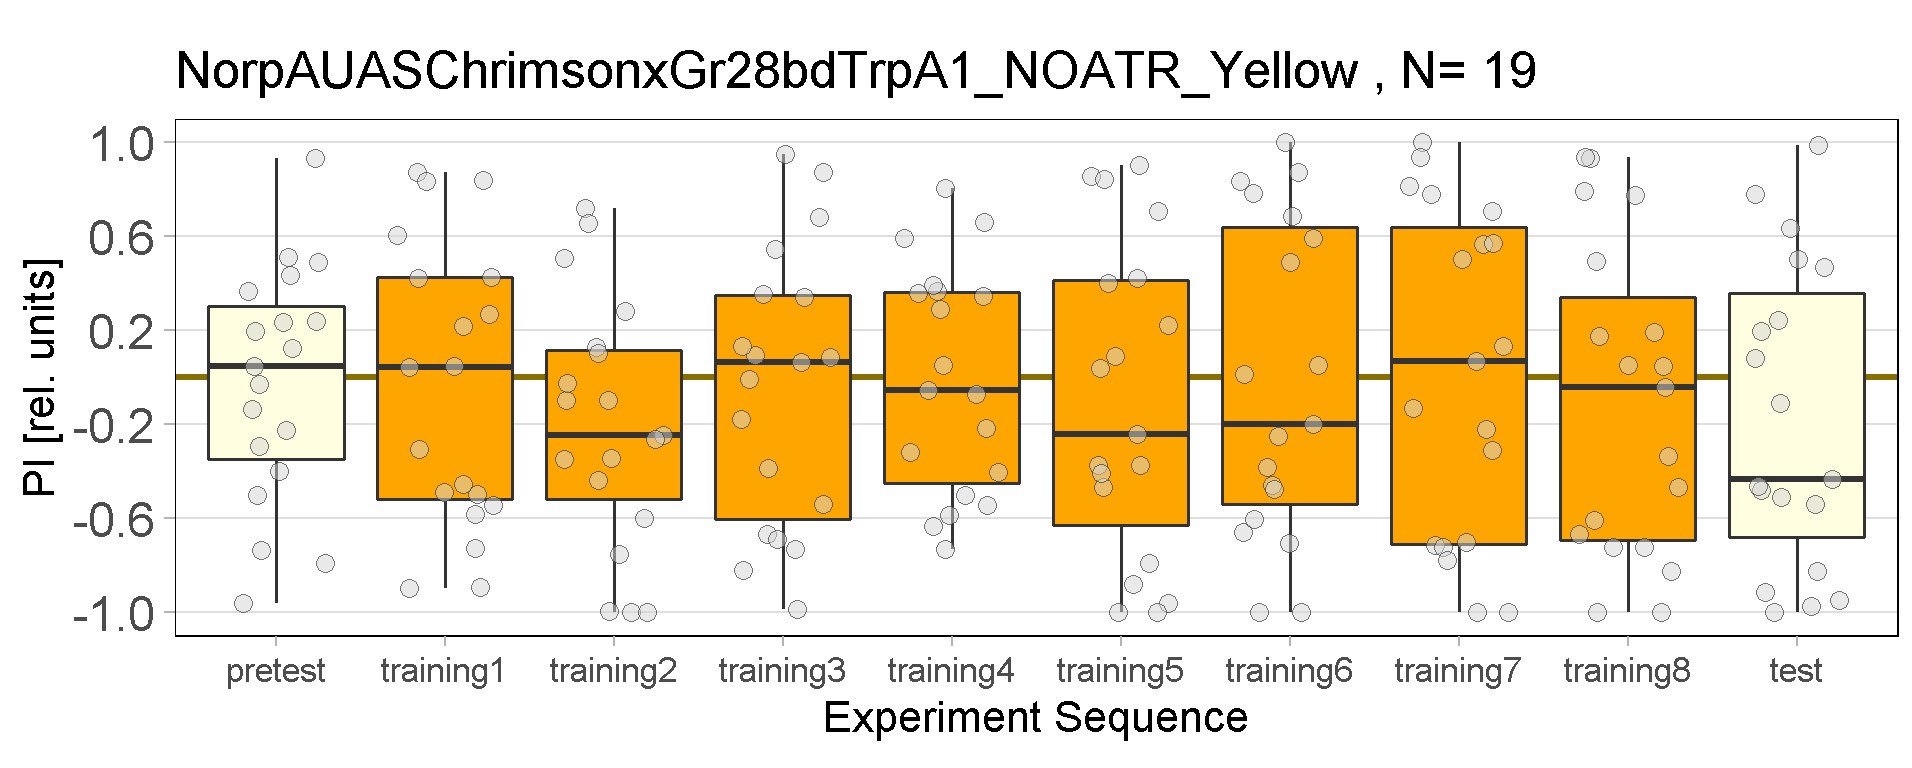
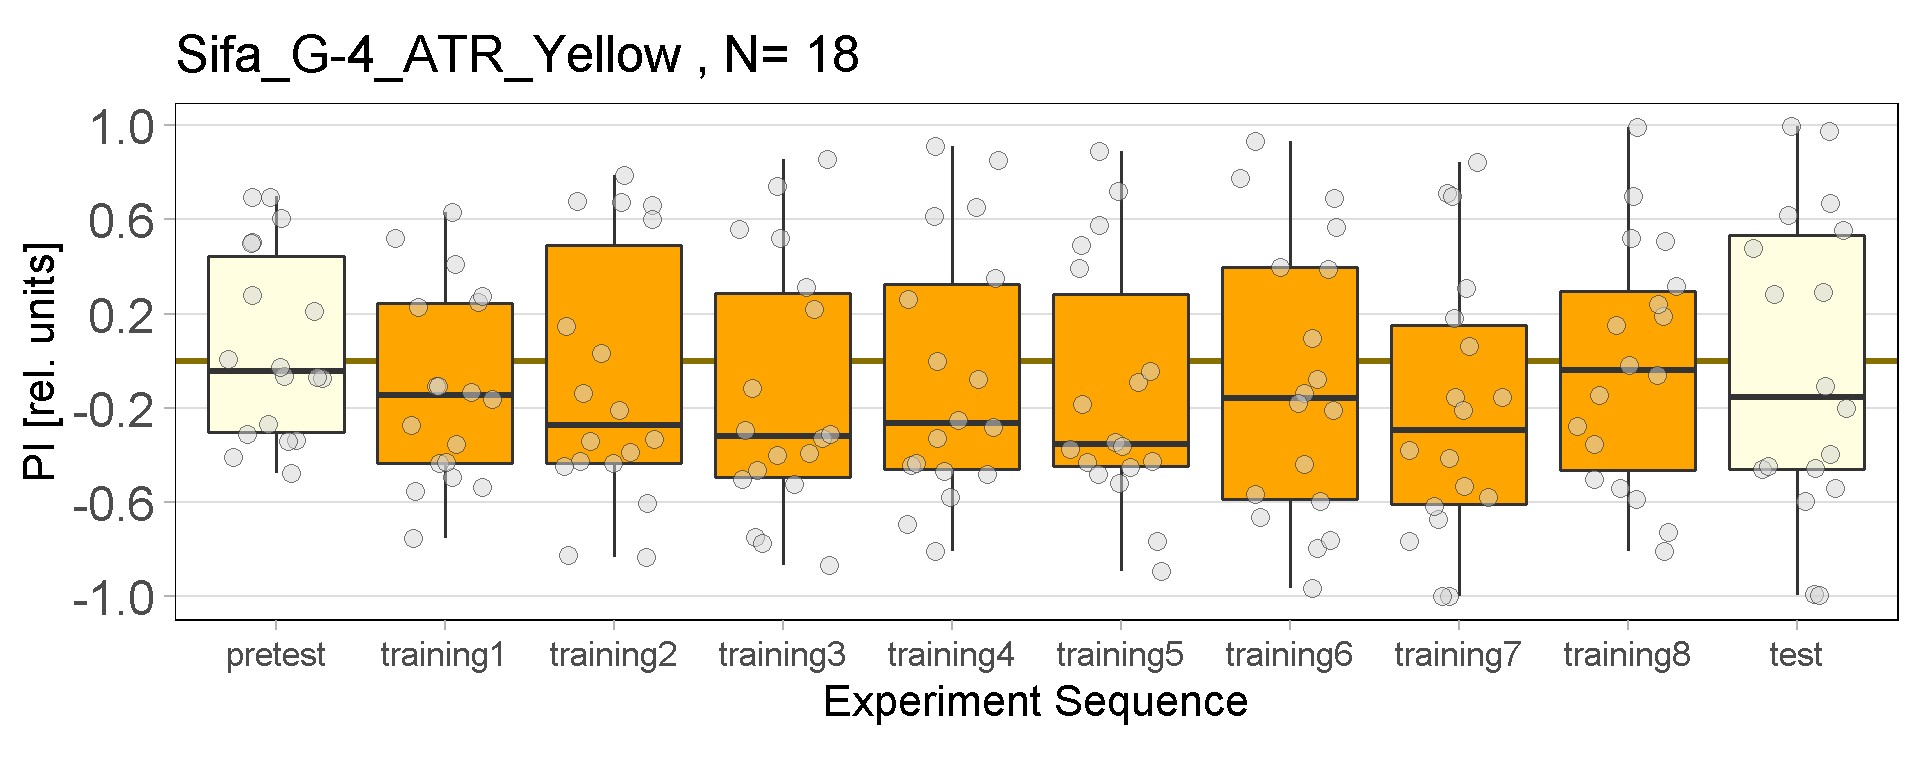
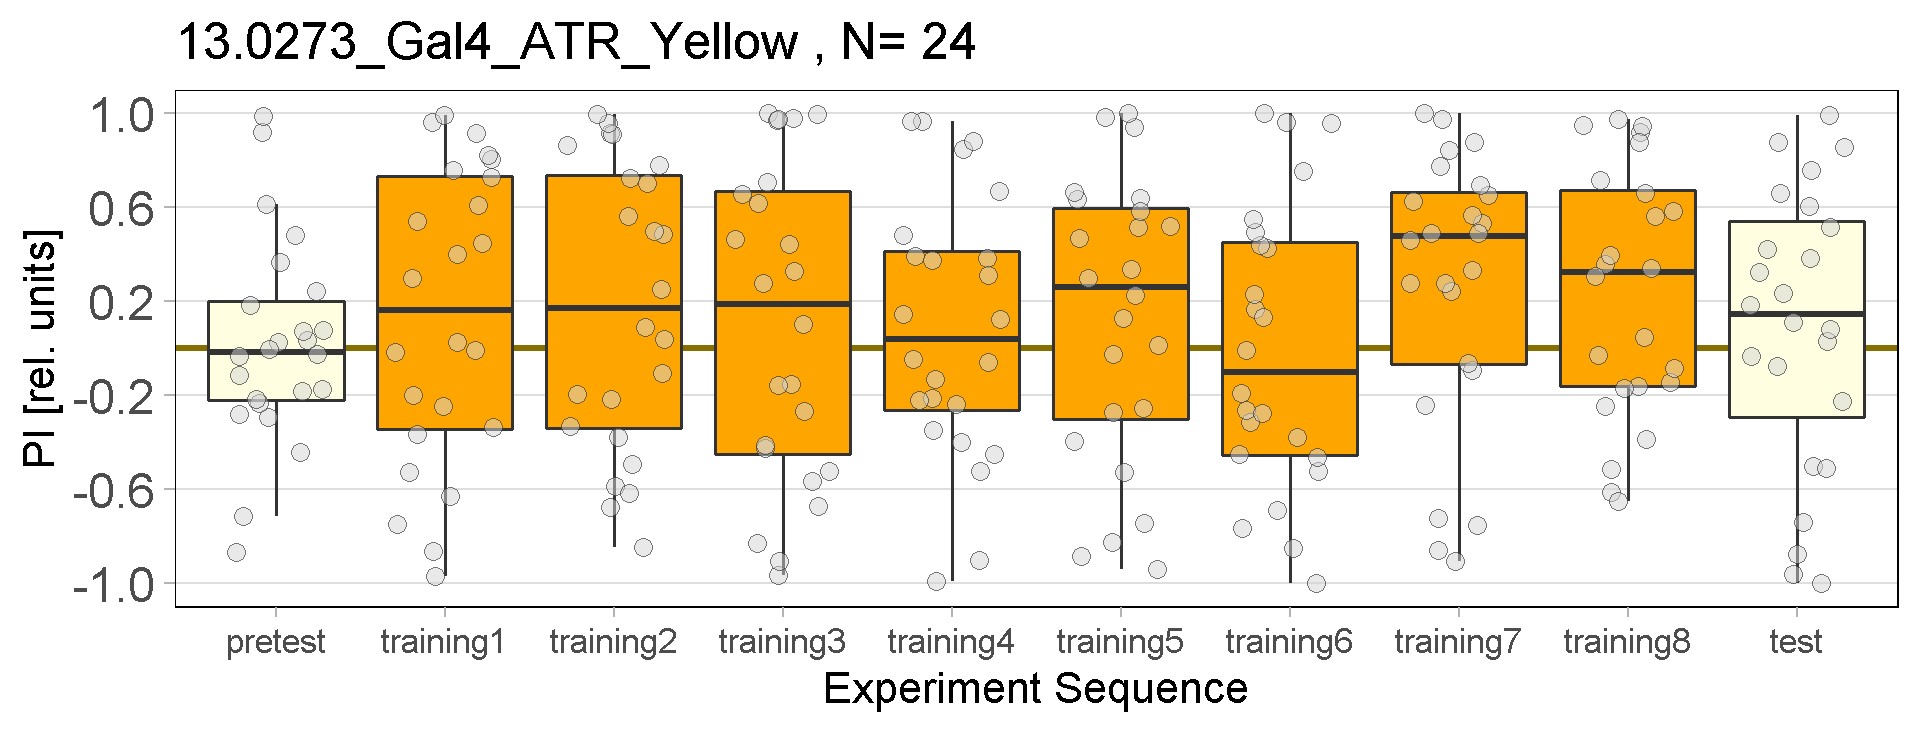
New experiments added for yellow light, ATR and NOATR Control group, ATR Sifa-G4 and ATR 13.0273-Gal4.
Category: Optogenetics, Uncategorized | No Comments
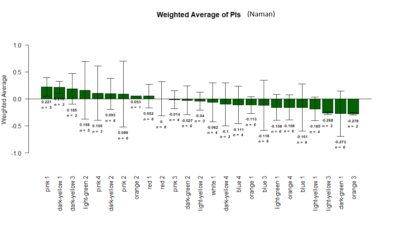
The Tmaze Experiments : Screen results as on 22-7-18
on Sunday, July 22nd, 2018 6:41 | by Naman Agrawal
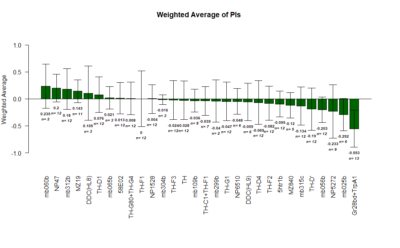
Yellow 1 (Positive Control): Gr28bd-G4, TrpA1-G4
Parameters: Light: intensity (500 Lux side, 1000 Lux bottom); frequency = 20Hz; Delay = 1 ms; Duration = 9.9 ms; volts = 6.4
Category: neuronal activation, open science, Operant learning, Optogenetics | No Comments
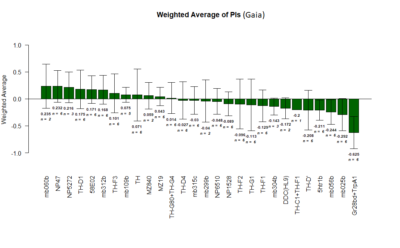
T-Maze experiments : screen results as on 16-07-2018
on Monday, July 16th, 2018 1:32 | by Gaia Bianchini
Results of the T-maze screen analysis, both individual and combined.
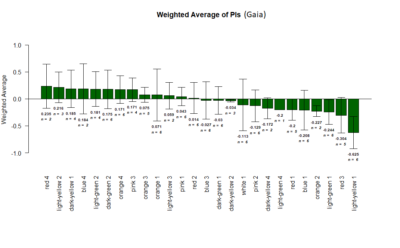
Yellow 1 (Positive Control): Gr28bd-G4, TrpA1-G4
Parameters: Light: intensity (500 Lux side, 1000 Lux bottom); frequency = 20Hz; Delay = 1 ms; Duration = 9.9 ms; volts = 6.4
The T-Maze experiments : Middle analysis and Correlation plot
on Saturday, July 14th, 2018 12:06 | by Naman Agrawal
The mean ratio of the flies that stay in the middle during the experiments.
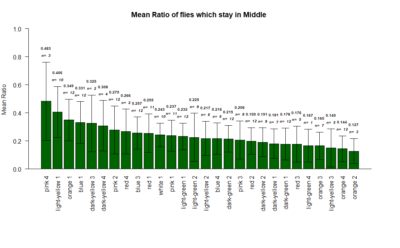
Correlation plot between the mean ratio of the flies that stay in the middle versus the Weighted PIs
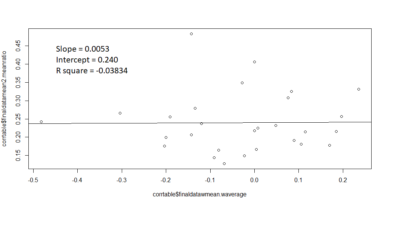
Slope = 0.0053
Intercept = 0.240
R square value = -0.03834
contrary to the expectations, there seems to be no correlation .
Category: lab.brembs.net, neuronal activation, operant self-learning, Optogenetics, R code | No Comments
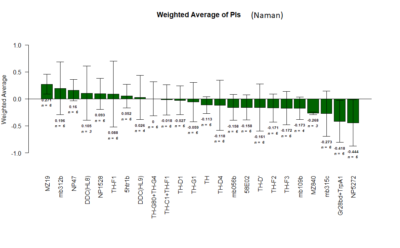
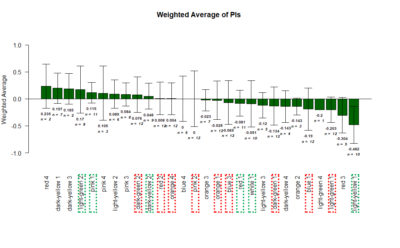
T-Maze experiments : screen results as on 02-07-2018
on Monday, July 2nd, 2018 2:09 | by Gaia Bianchini

Yellow 1 (Positive Control): Gr28bd-G4, TrpA1-G4
Parameters:
Light: intensity (500 Lux side, 1000 Lux bottom)
frequency = 20Hz
Delay = 1 ms
Duration = 9.9 ms
volts = 6.4