Comparison of T-maze and Joystick Results
on Sunday, September 18th, 2022 11:26 | by Vivi Samara
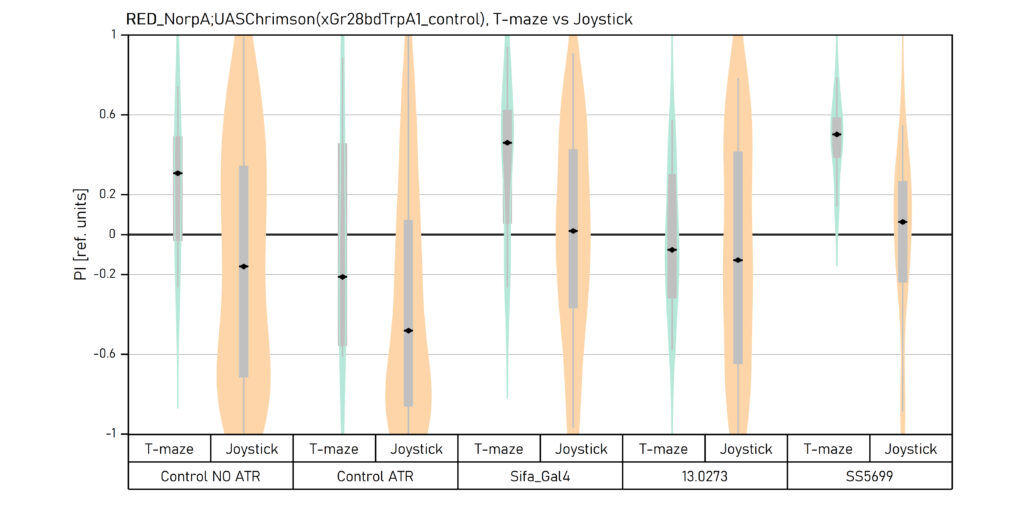
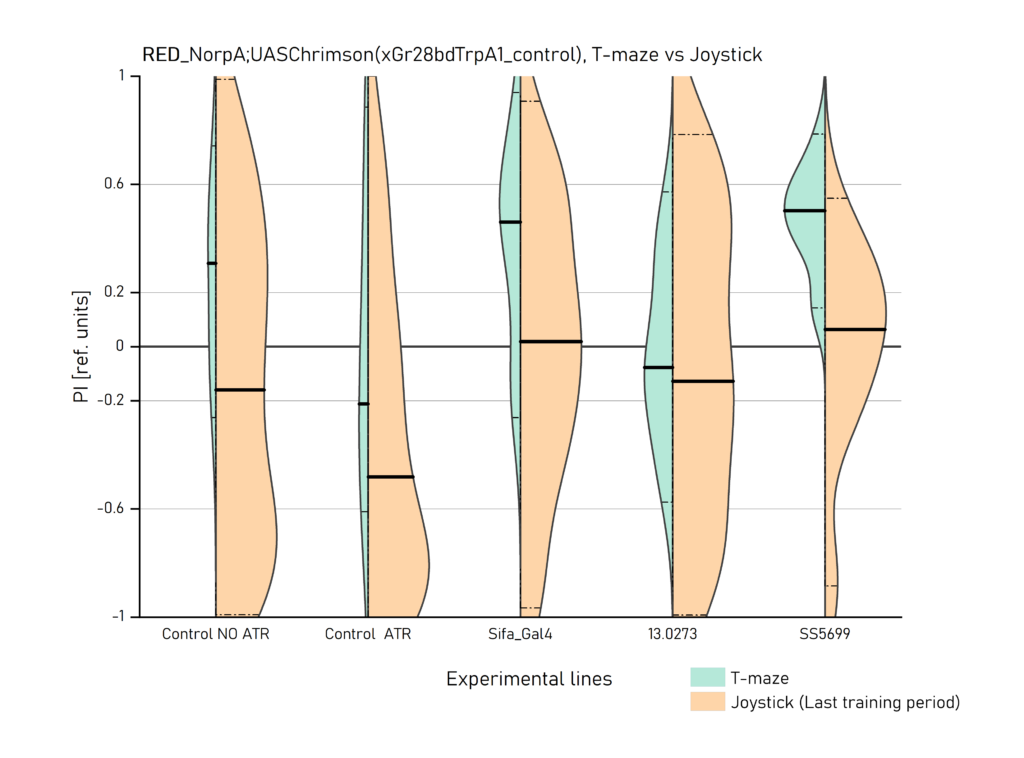
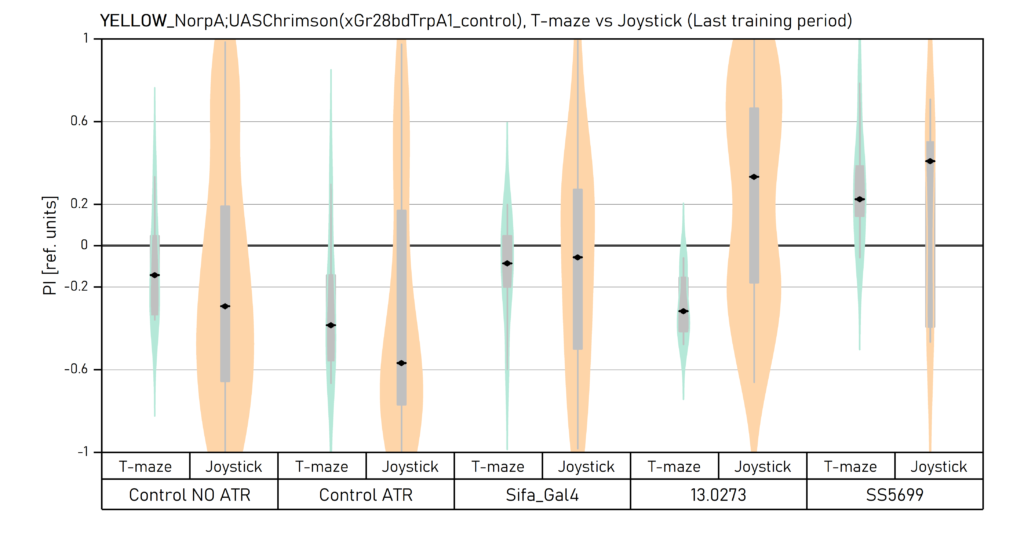
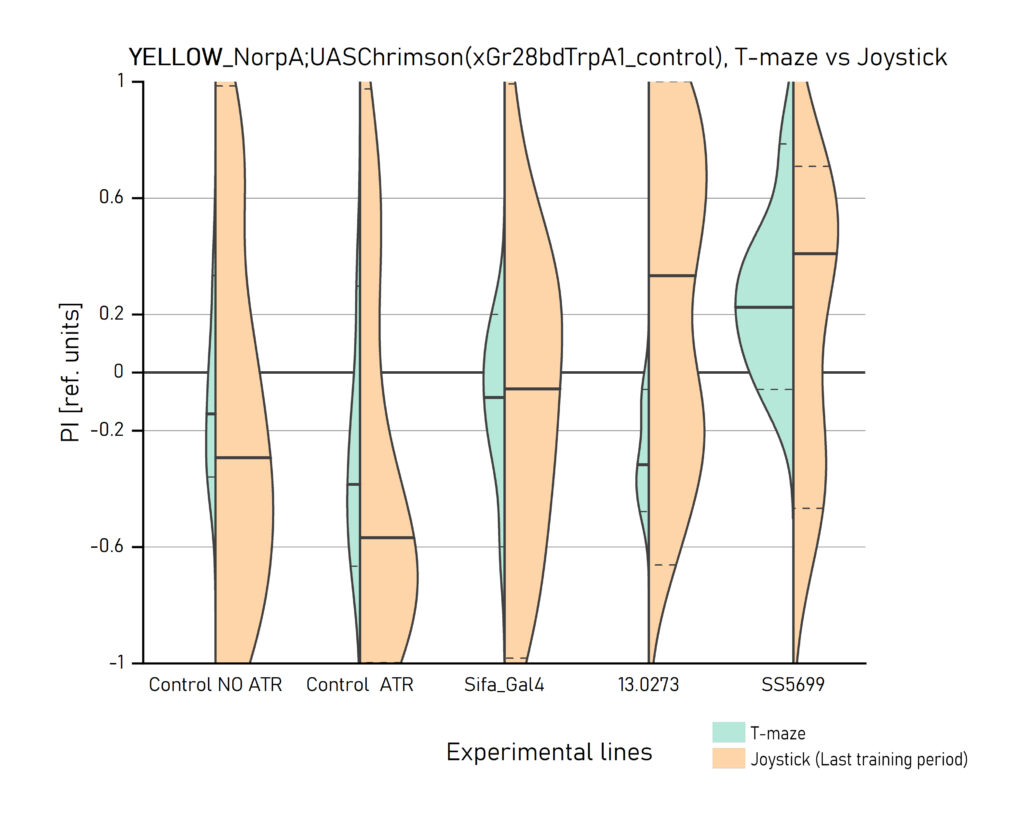
Two different ways of presentation for red and yellow light. With the term Joystick here, the data collected for the last training period of each line are represented. Results obtained from Enes, Aslihan and Vivi.
Category: Optogenetics | No Comments
Red and Yellow light T-maze results
on Saturday, September 10th, 2022 12:13 | by Vivi Samara
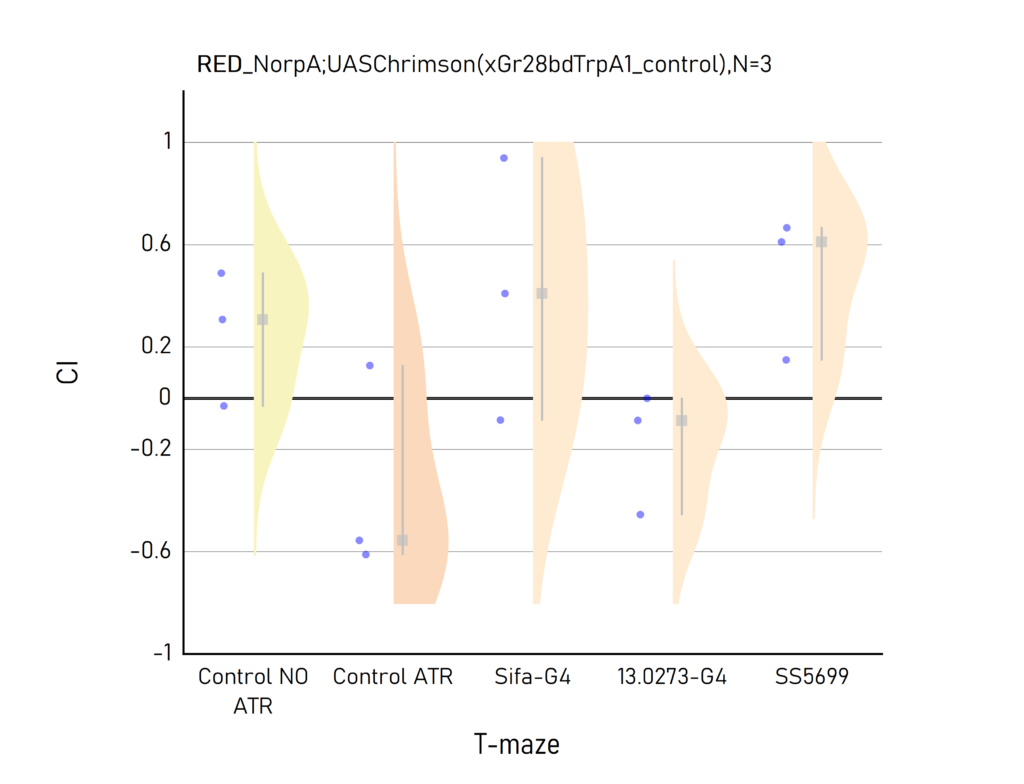

Plots created from the results of Aslıhan. CI: Choice index of preference towards the lit (1) or dark (-1) arm. Population of approximately 50 flies per dot.
Category: Optogenetics | No Comments
Aslıhan Enes Red Light T-Maze Results
on Monday, September 5th, 2022 10:15 | by Aslihan Dilara Gülay
Results for Red Light T-Maze experiments.
Category: Optogenetics | 1 Comment
T-Maze experiments : screen results as on 16-07-2018
on Monday, July 16th, 2018 1:32 | by Gaia Bianchini
Results of the T-maze screen analysis, both individual and combined.
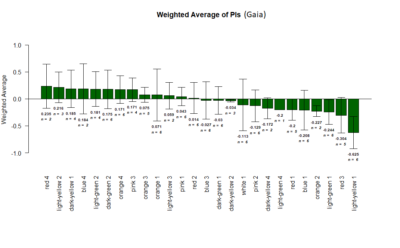
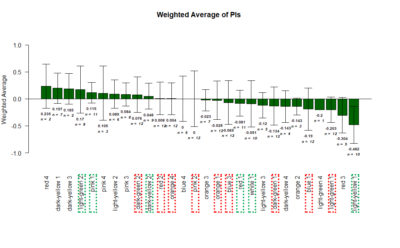
Yellow 1 (Positive Control): Gr28bd-G4, TrpA1-G4
Parameters: Light: intensity (500 Lux side, 1000 Lux bottom); frequency = 20Hz; Delay = 1 ms; Duration = 9.9 ms; volts = 6.4
Tmaze experiments : Test for Blindness and Comparison with positive control
on Monday, June 11th, 2018 12:45 | by Naman Agrawal
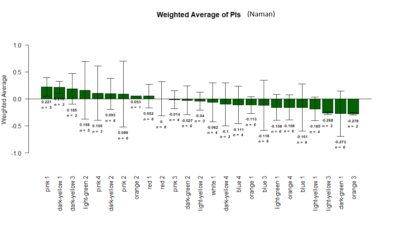
Comparison between White 1 ( Control (NorpA- UAS Chrimson)) and Yellow 1 (Positive Control ( Gr28bd-G4, TrpA1-G4).
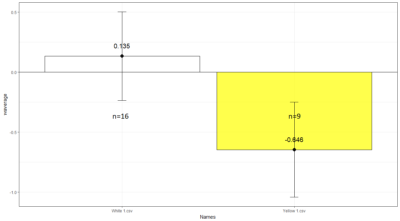
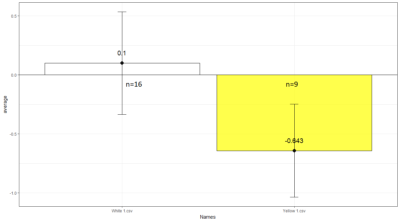
To test whether the flies are really blind, and there is no problem with the NorpA part of the construct, we compare with NorpA,UAS GTACR1 ; NorpA,UAS GTACR2 ; and another stock of NorpA-UAS-Chrimson.
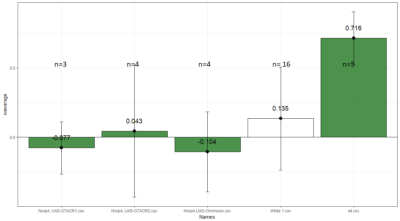
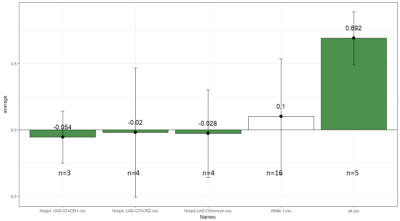
Weighted mean is calculated by multiplying the weights (total number of flies in that experiment/total number of flies in all the experiments) with the PI for that experiment, and taking the sum thereafter for all the experiments.
Category: genetics, neuronal activation, Optogenetics, TrpA | No Comments
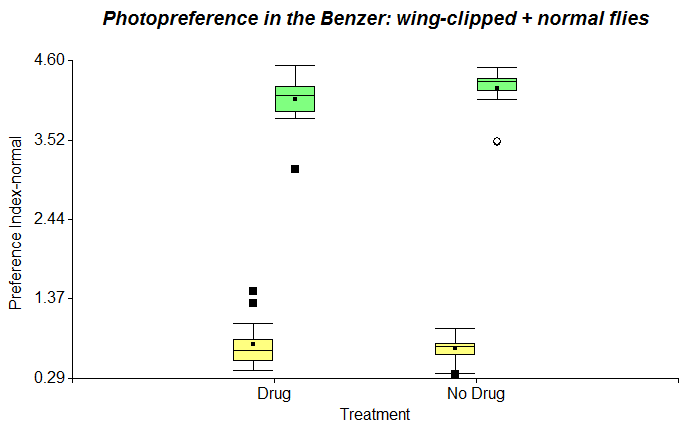
Update: Altering Photopreference of Drosophila with Diazepam
on Monday, August 8th, 2016 1:53 | by Lena Matzeder
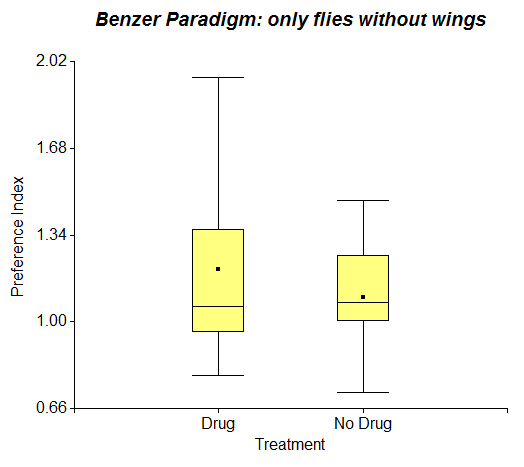
In my last post I presented results of testing wing-clipped flies in the Benzer Paradigm, where half of them were fed with Diazepam. I repeated this experiment, but added 40 normal flies to 40 wing-clipped flies. However the following figure doesn’t show any increase of photopreference in Diazepam treated flies.
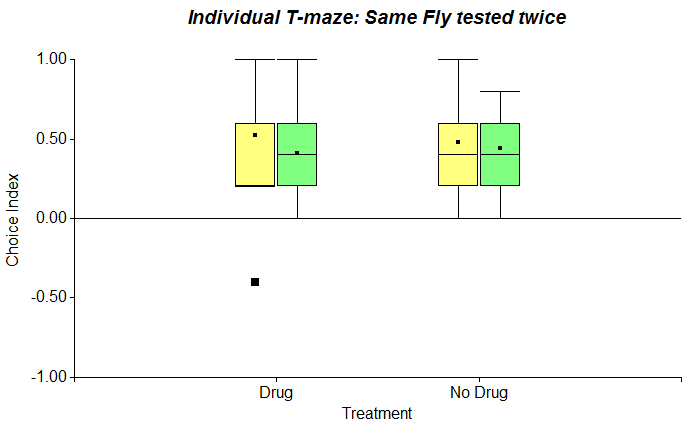
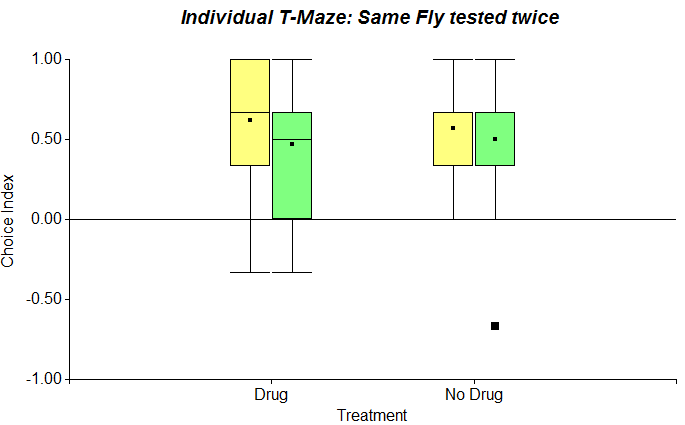
To complement the individual T-Maze experiment, that I started recently with wing-clipped flies, I performed it with normal flies as well (n=20). The procedure was repeated 10 times. While the first figure in the following shows all 10 choices, the second one only refers to the first 6 choices.
Category: wing clipping | No Comments
Update: Altering Photopreference of Drosophila with Diazepam
on Monday, August 1st, 2016 10:45 | by Lena Matzeder
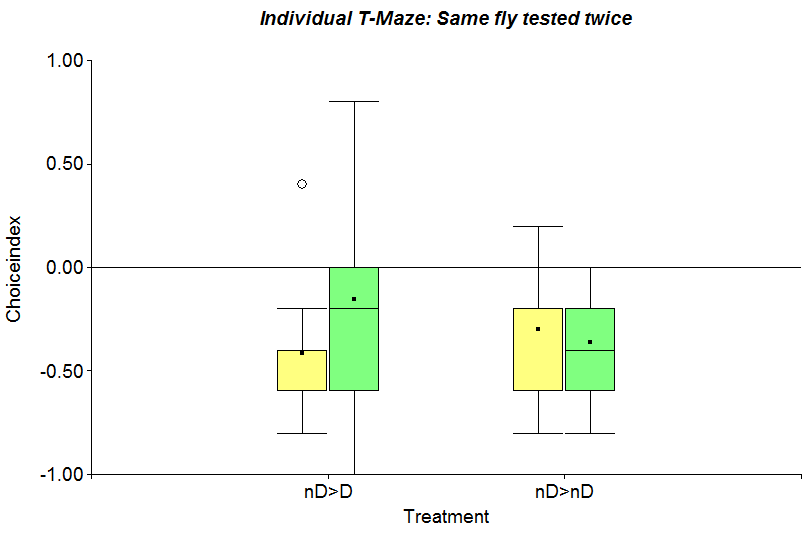
After testing wing-clipped individual flies in the Single Fly T-Maze, that is described in my last post, I reran the experiment changing two things in the setup: Firstly the procedure on each fly was repeated 10 times instead of only 6 and secondly each fly was tested twice, which results in a direct comparison of the same organism with and without the drug. On the first day of the experiment (yellow bar) all of them were fed with the yeast-solution containing 10% ethanol and on the second day (green bar) the same flies were tested again, but half of them got the 5 mM Diazepam treatment. Looking at the following figure (n=23) the control group (nD>nD) shows a similar behavior in both days, but compared to the Diazepam treated flies (nD>D) there is a perceivable increase in photopreference.
Besides the T-maze I started testing flies using the Benzer Paradigm. In this experiment they don’t have the options of light and darkness, but they can choose between light and less light. They can either go towards the light and transfer to another vial or just stay where they are. I started testing only wing-clipped flies (n = 10) with a groupsize of about 50 flies, but I will test groups of wing-clipped and normal flies taken together in the same vial as well.
The Preference Index is calculated by
PI = ((#F5×5)+(#F4×4)+(#F3×3)+(#F2×2)+(#F1×1)+(#F0×0)) / (#FT )
Category: wing clipping | No Comments
Lab report: Optogenetics – A screening with the channelrhodopsin Chrimson
on Tuesday, November 24th, 2015 7:17 | by Lena Danyeli
Optogenetics is a technique in which light is used to control cells in living tissue, typically neurons that have been genetically modified to express light-sensitive ion channels. The technique is used to modify the activity of a given set of neurons, even within freely-moving animals.
In the course of Christian Rohrsen’s project “Dopamine neuronal populations involved in reward and punishment” we performed a screening to assess avoidance and appetitive behaviour of flies by monitoring the escape or approach from or towards the illuminated arm. We assessed distinct types of neurons by means of two different optogenetic setups– the T-maze and a custom-built platform, which are presented in the following:
Experiment 1: T-maze
First part of the internship was to further optimize parameters in the already established method T-maze (as introduced by Christian Rohrsen: see scheme below) for an efficient use in optogenetic experiments with the channelrhodopsin “chrimson” (spectral peak at 590 nm).

The general setup consisted of one illuminated arm and one non-illuminated dark arm. Following parameters were monitored to select the most convenient conditions for the screening:
- Light source:
→ pulsed vs. constant light, light intensity and positioning of the light source
- Time parameters:
→ duration of trials and time between repetitions
- Food supplement:
→ ATR vs. no ATR
- Genetic drift:
→ separate breeding of flies with different genetic background
The screening was performed with following fly lines (all crossed with NorpA and therefore blind):
NorpA;Or42a>Chrimson
NorpA;58E02>Chrimson
NorpA;TrpA1>Chrimson
NorpA;Gr66a>Chrimson
NorpA;UAS-Chrimson and wtb; UAS-Chrimson (control for leaky expression) as genetic controls
To control for the genetic drift, we used two groups of flies of the same line but reared separately for several generations (group “yellow” and group “white”, referring to the color used for labeling).
Results:
The most suitable light condition for the screening was pulsed light (20 Hz, 10 ms pulse width, 1500-2000 lx), which was favored since neurons seem to be activated more efficiently in a phasic than in a tonic way (Inagaki et al., 2013). Furthermore we assumed that constant light could induce abnormal levels of neuronal activity, which could lead to excitotoxicity. The best position of the light source was at the outside of a short transparent tube, one on top and one above, which guaranteed homogeneous illumination. 1 min trials with repetition and 1 day between repetitions worked best to rule out possible effects of the CO2 anesthesia on the experimental outcome. The genetic background did not seem to play a big role in the results of this setup, which is shown in the graph below (yellow vs. white group; screening performed before optimal parameters were found).
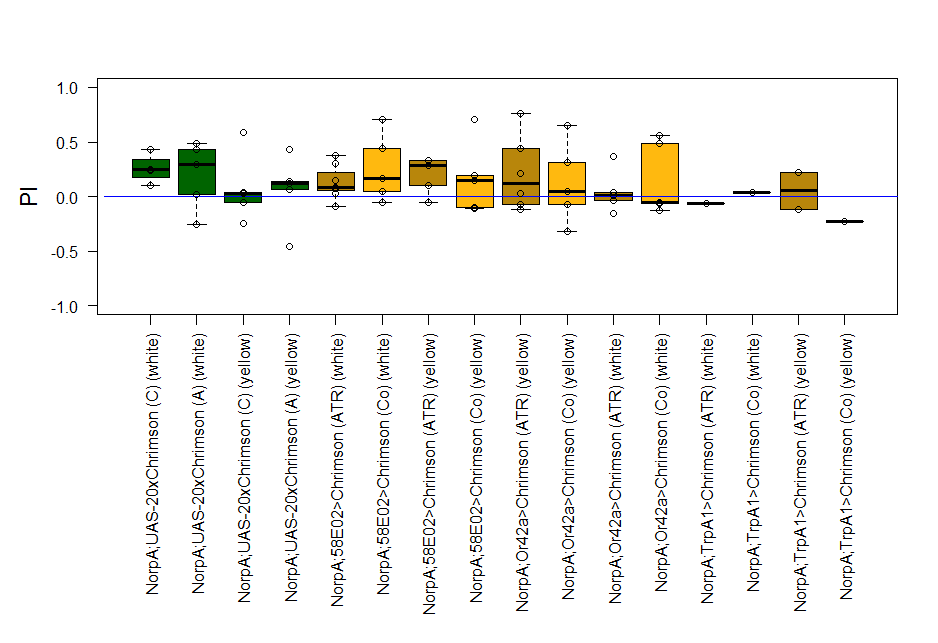
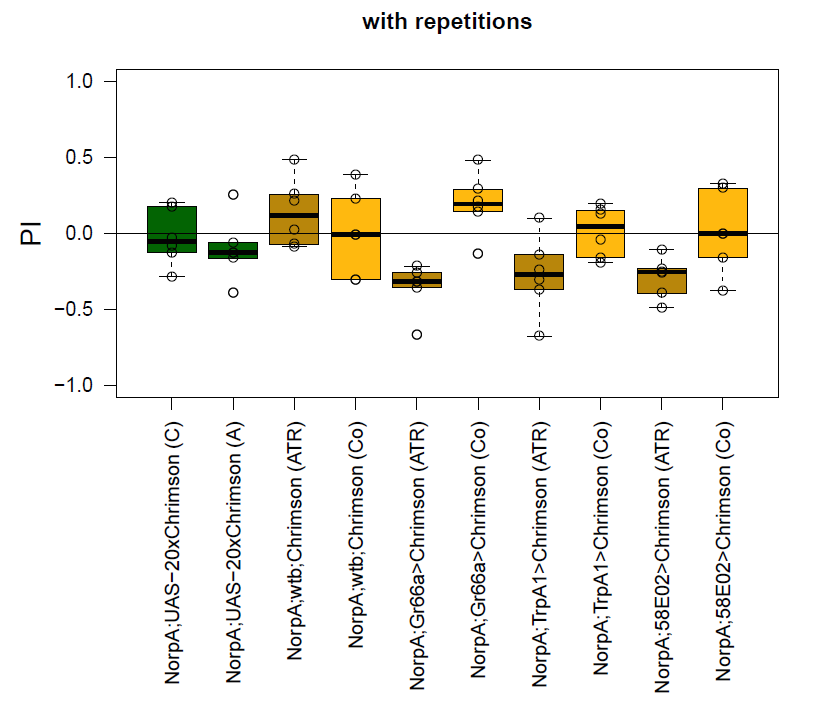
With described parameters we observed an escape behaviour towards the illuminated arm, indicating Gr66a, TrpA1 and 58E02 being neurons eliciting the avoidance behaviour when activated (we did not observe any effect for Or42a; data not shown). We furthermore found a strong enhancing effect of this behaviour due to the administration of ATR. The graph shows the mean PI of the two repetitions for each fly line with (ATR) or without (Co) ATR as food supplement (n = 6).
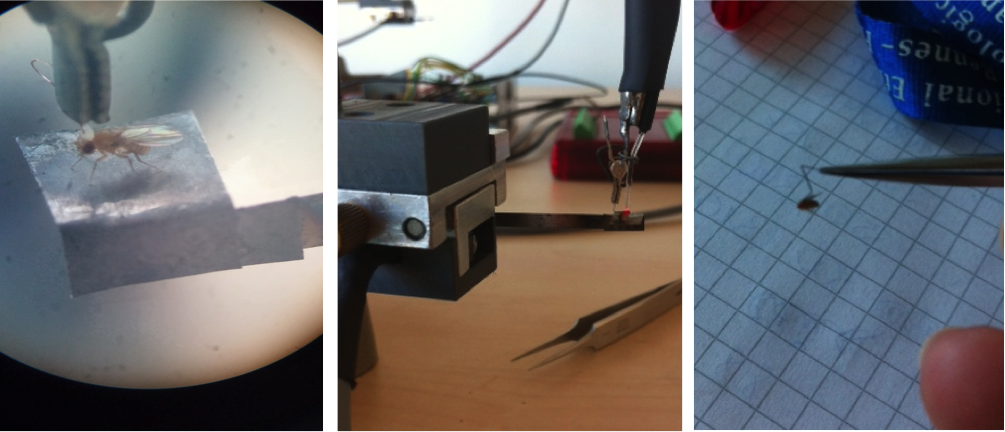
Experiment 2: Platform
The second part of the internship aimed to optimize the experimental parameters of a custom-built platform, which represents a second method to assess preference/ avoidance behaviour, tested in an operant behaviour experiment by means of optogenetics. The platform is connected to a fiberglass, which allows light to be directly placed on top of a fly’s head to excite the assessed neurons. By walking to one or the other side, the flies can move the platform and thereby switch the light on and off. The pictures below show the platform holding a fly hooked with a copper hook on the neck (left) and a fly hooked on the thorax with a “double-L”-shaped wolfram hook (middle and right).
The experiment was performed with variation in following parameters:
- Light intensity:
→ 15 lx – 100 lx
- Fixation of the flies:
→ hooks glued on the thorax or the neck, facing either to the back or the front of the fly
→ different material used for the hooks: copper vs. wolfram
→ different shapes of hooks: triangle vs. “double-L”-shape
Since Gr66a showed promising results in the T-maze, this fly line was used to further optimize experimental parameters with the aim of confirming the observed avoidance effect.
Results:
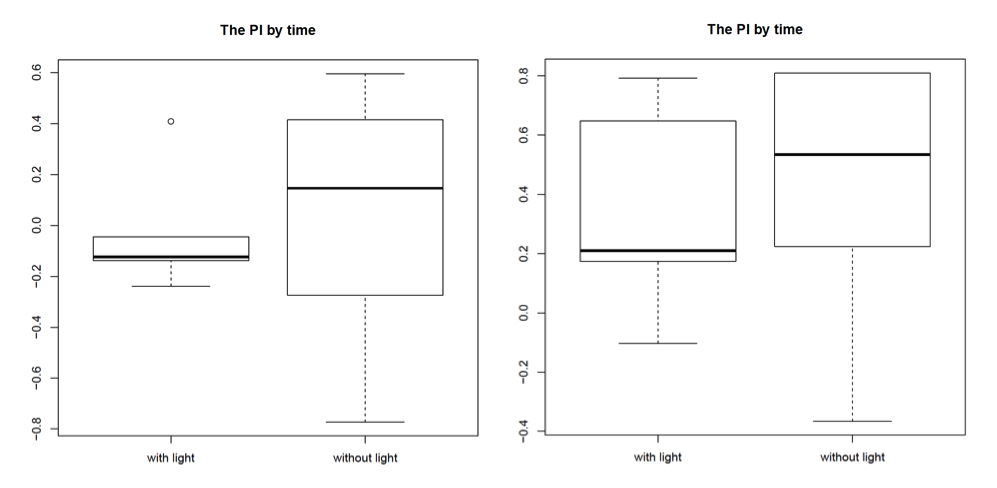
Most promising outcome was observed at 80 lx – 100 lx with “double-L”-shaped wolfram hooks facing to the back of the fly, as can be seen in the graphs for the PI by time (left side: 80 lx, right side: 100 lx; n = 3). In this combination the light reached the fly’s head and therefore the assessed neurons in the most efficient way. We found the thicker wolfram hooks to be more useful than the copper hooks since they were more tightly attached to the body and allowed us to position the flies very accurately under the light. Furthermore, we found a change in walking behaviour due to the positioning of the hooks on the flies. Hooks facing to the back of the flies, and therefore covering the wings, unfortunately seemed to make the flies more immobile. Also the bodypart on which the hooks were glued seemed to play a role, with hooks glued on the thorax being the most stable condition, since it allowed us to use more glue, which was needed due to the increased weight of the wolfram hooks.
Category: Optogenetics | No Comments
New experiments
on Monday, December 10th, 2012 3:01 | by Lidia Castro
I was trying to increase the differences between flies with clipped and intact wings, putting a paper covering the LEDs.
Results are not as good as I expected. The differences are lower than experiments done without this paper between LEDs and flies. I did experiments only with the big white LEDs (the ones which showed better results).
Category: wing clipping | 8 Comments
Comparison between voltages and size of white LEDs
on Wednesday, December 5th, 2012 1:33 | by Lidia Castro
I continued doing experiments with big and small white LEDs, and now I think I have done enough experiments to compare them.
These are the final results, which seem to indicate that big white LEDs using 2,6V are the best ones to continue with the experiments.
Category: wing clipping | No Comments