T-maze (dark-light condition) test results
on Monday, December 11th, 2023 2:40 | by Devashree Joglekar
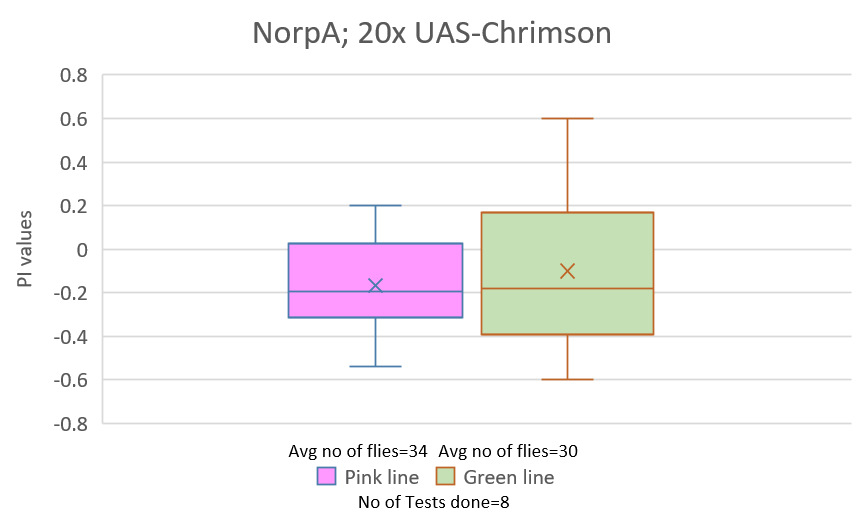
The flies without curly (straight wings) for the line NorpA;20xUAS-Chrimson were tested in T-maze in dark-light conditions. The tests were conducted on 23 November, 27th November, and 29th November 2023. 8 tests were done for each pink and green line; hence a total of 16 tests were conducted. A total of 273 flies and 233 flies were tested for pink line and green line respectively.

Category: temperature_phototaxis | No Comments
Genetic Background of Wildtype Flies
on Monday, December 21st, 2015 9:15 | by Amelie Roedel
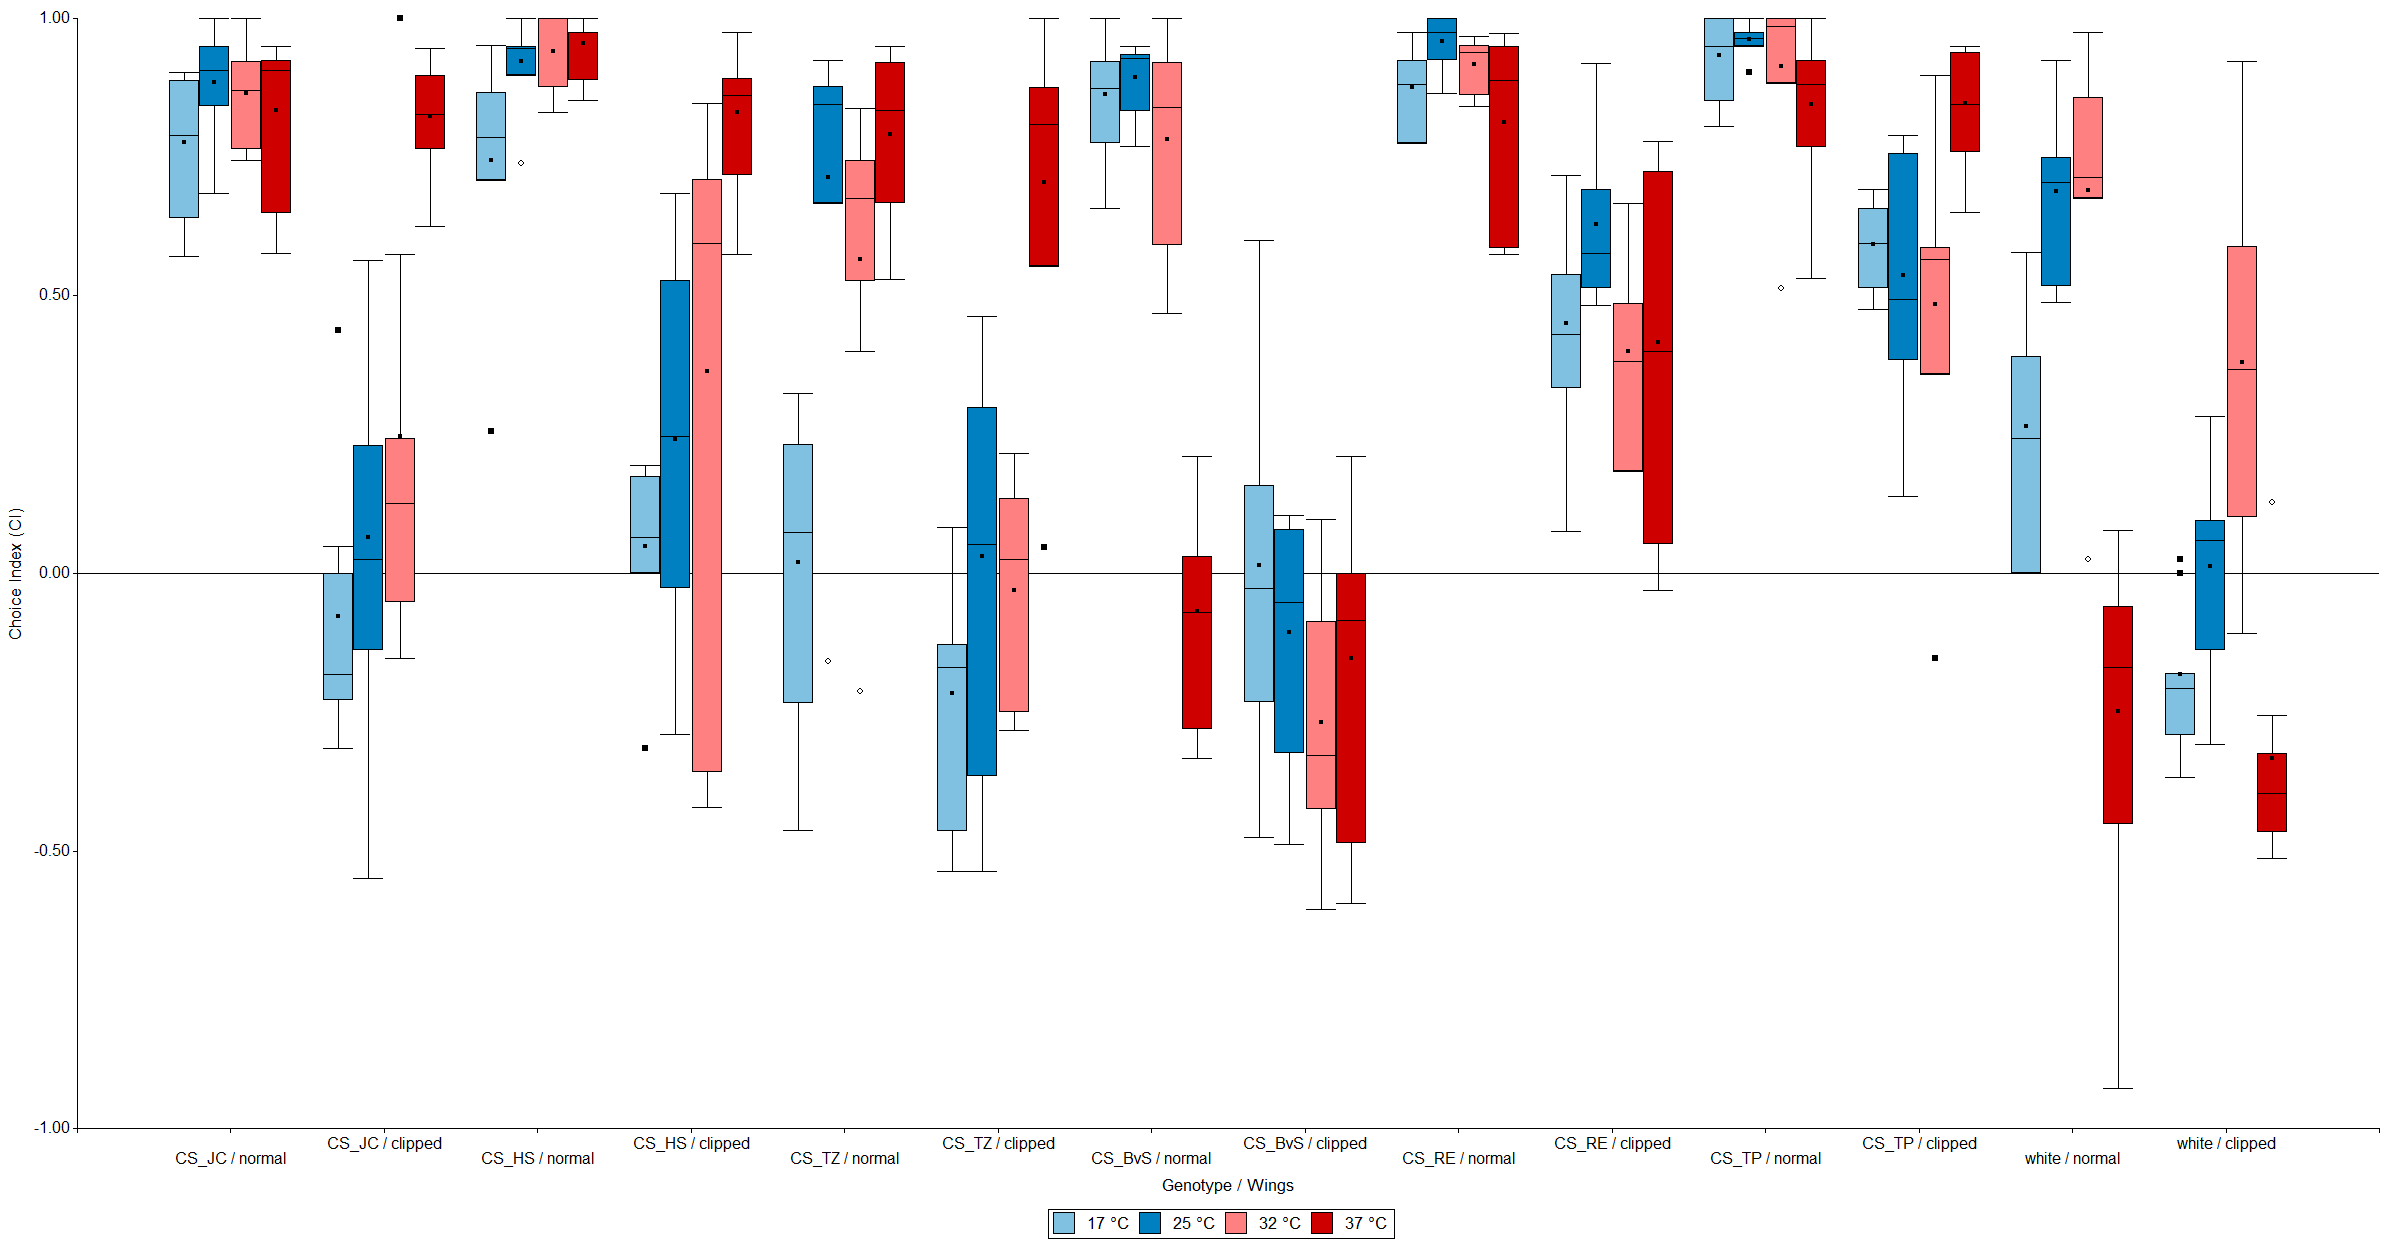
Figure 1: different genotypes tested at different temperatures. (n = 8)
Category: temperature_phototaxis, wing clipping | No Comments
Update: Genetic Background
on Monday, December 14th, 2015 12:05 | by Amelie Roedel
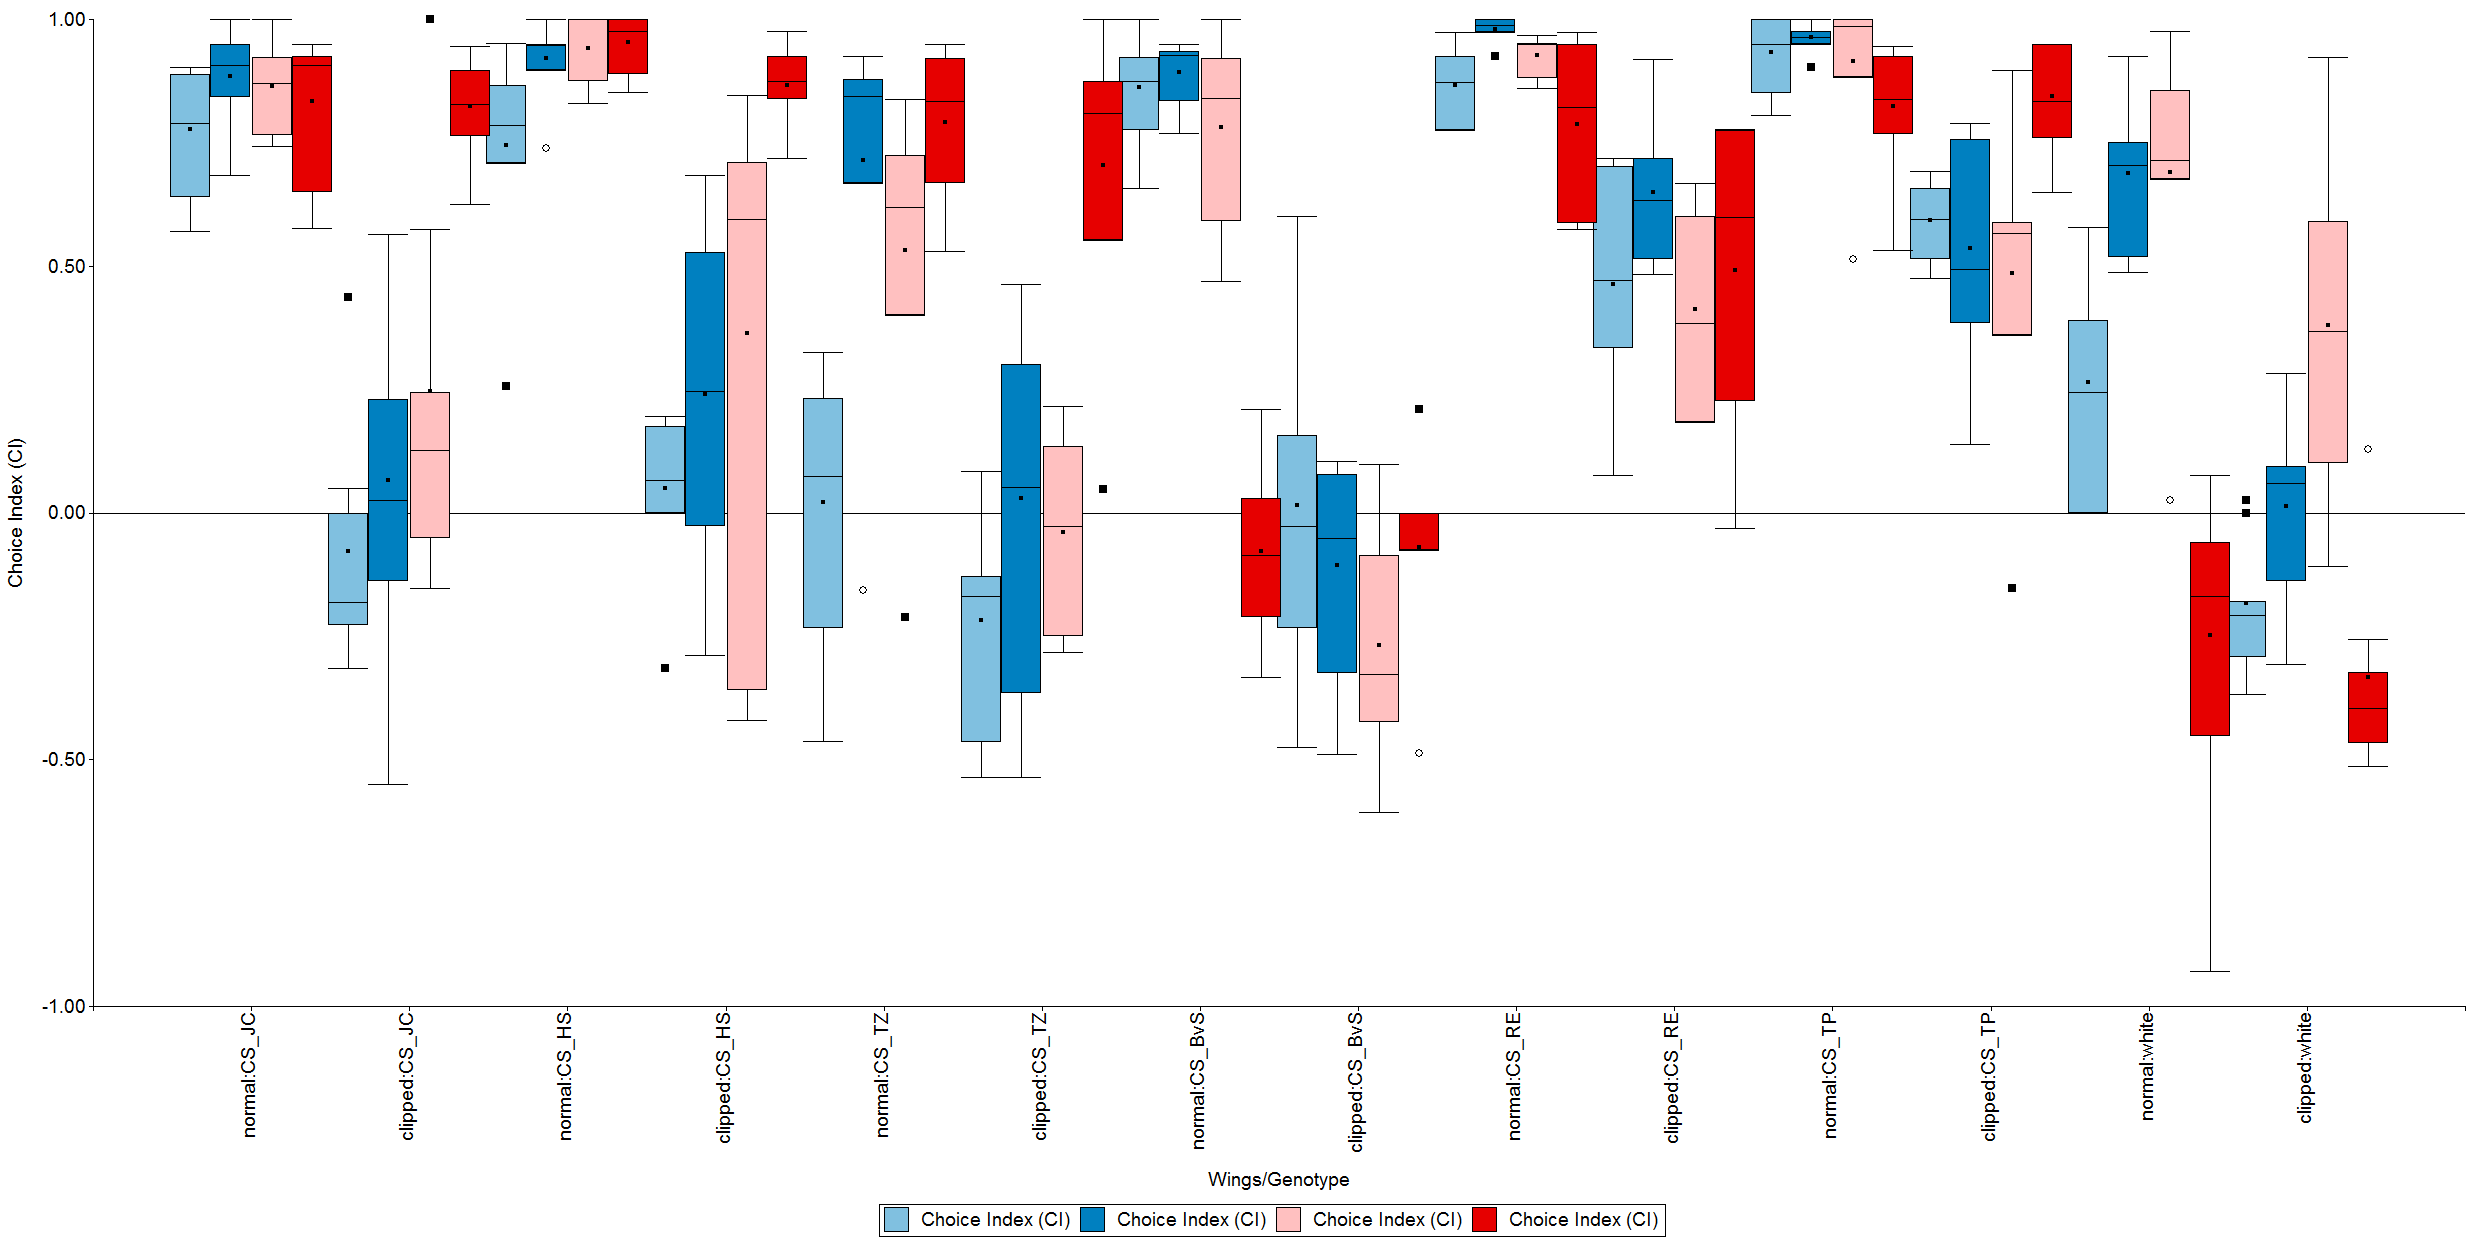
Figure 1: the different wildtypes tested on different temperatures (17°C, 25°C, 32°C, 37°C)
Category: temperature_phototaxis, wing clipping | No Comments
Update: Temperature Impact on Phototactic Behavior
on Thursday, December 3rd, 2015 11:01 | by Amelie Roedel
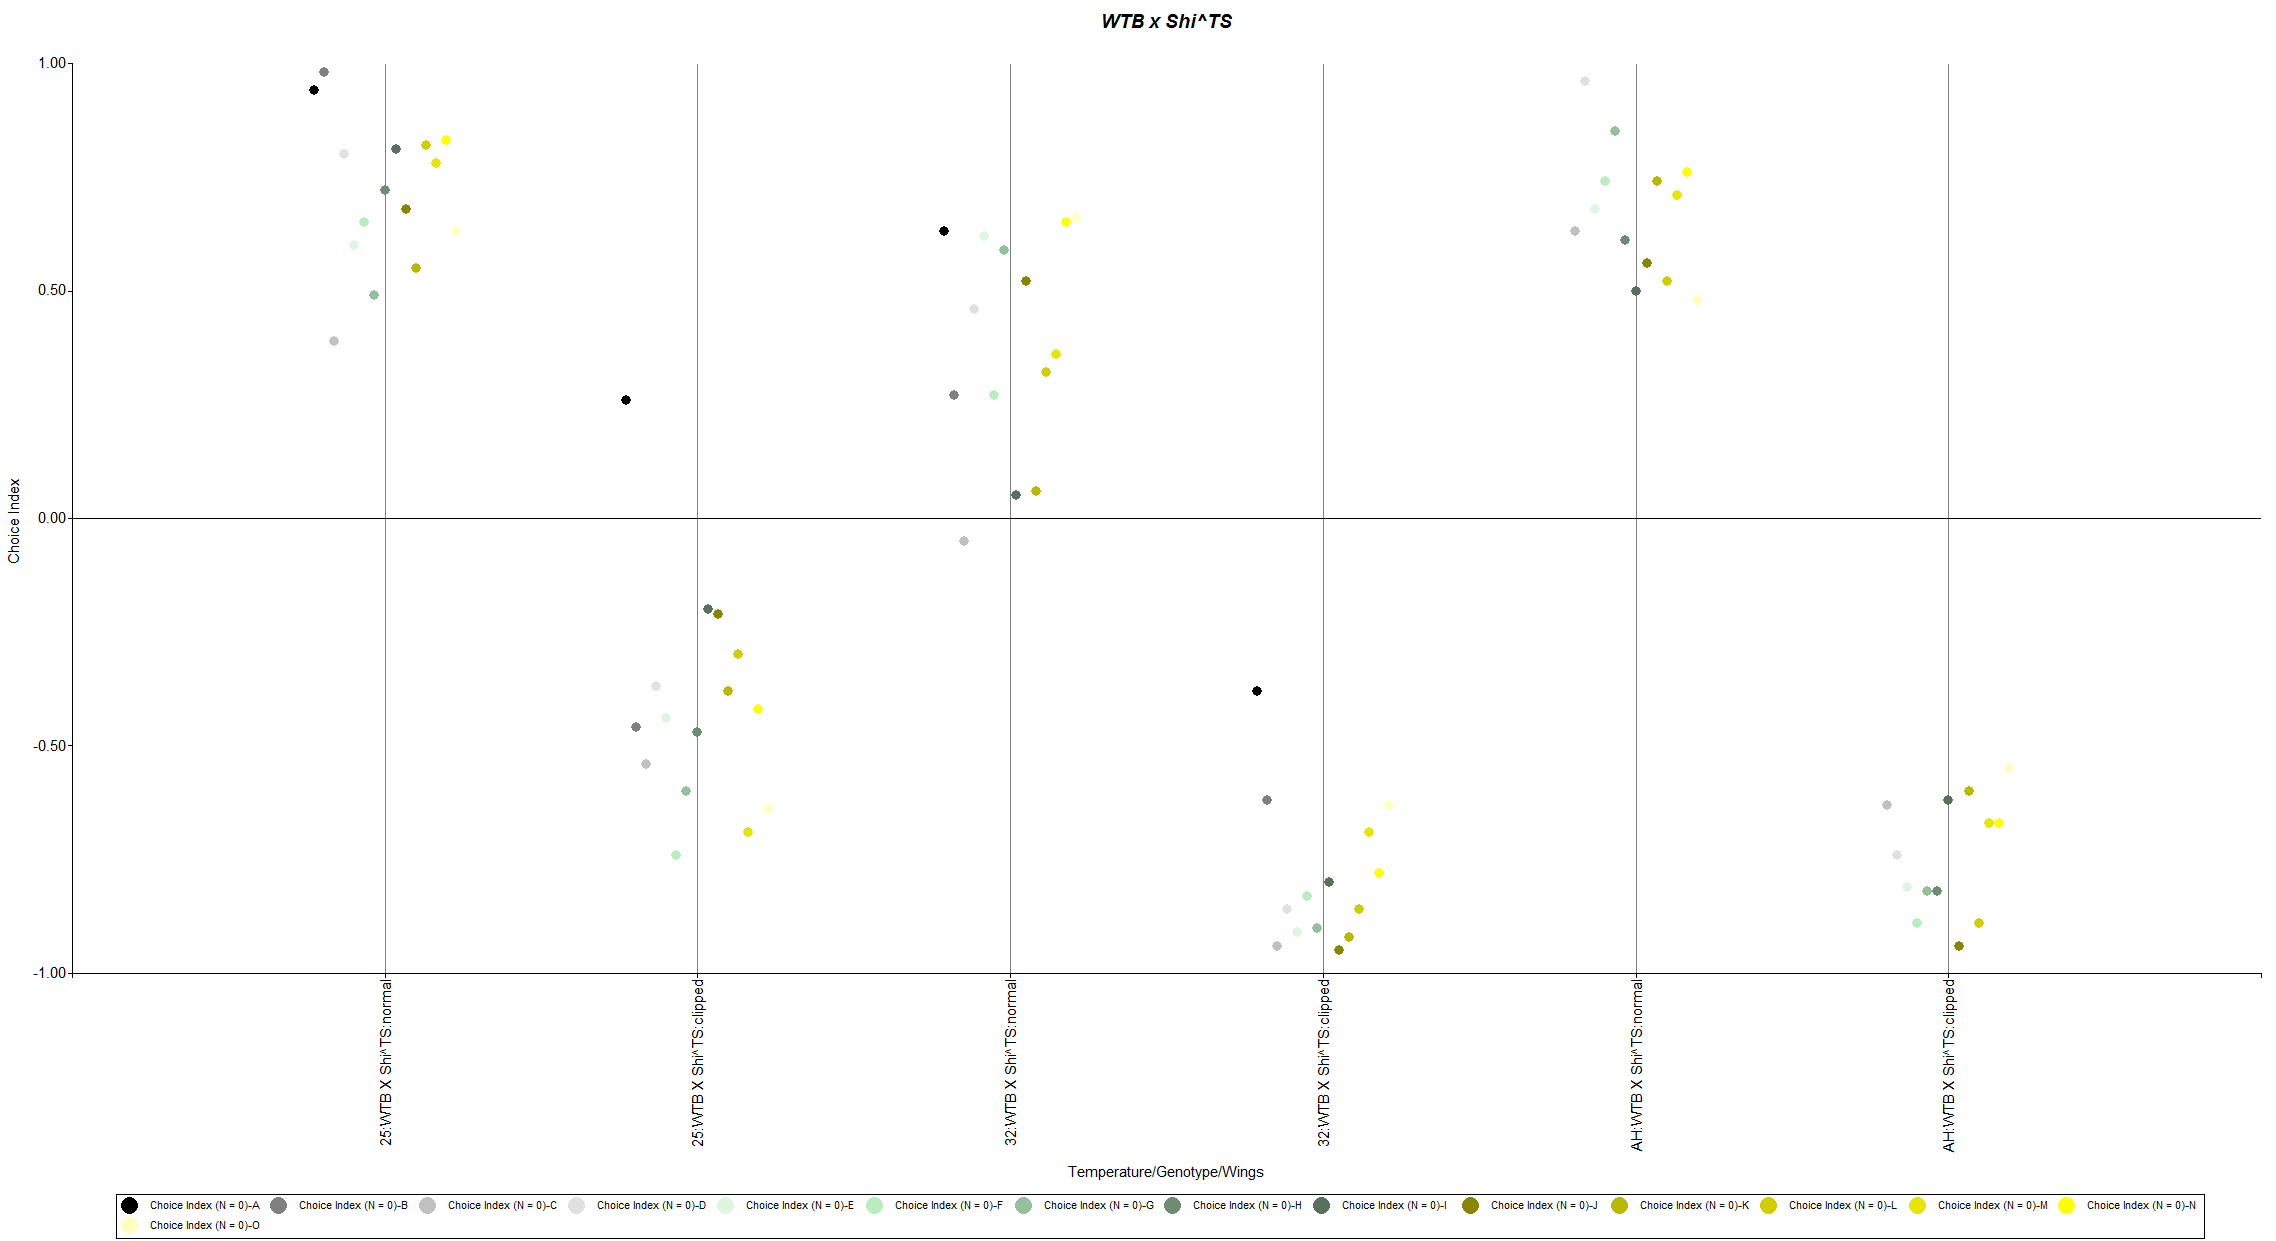
Figure 1: WTB x ShiTS
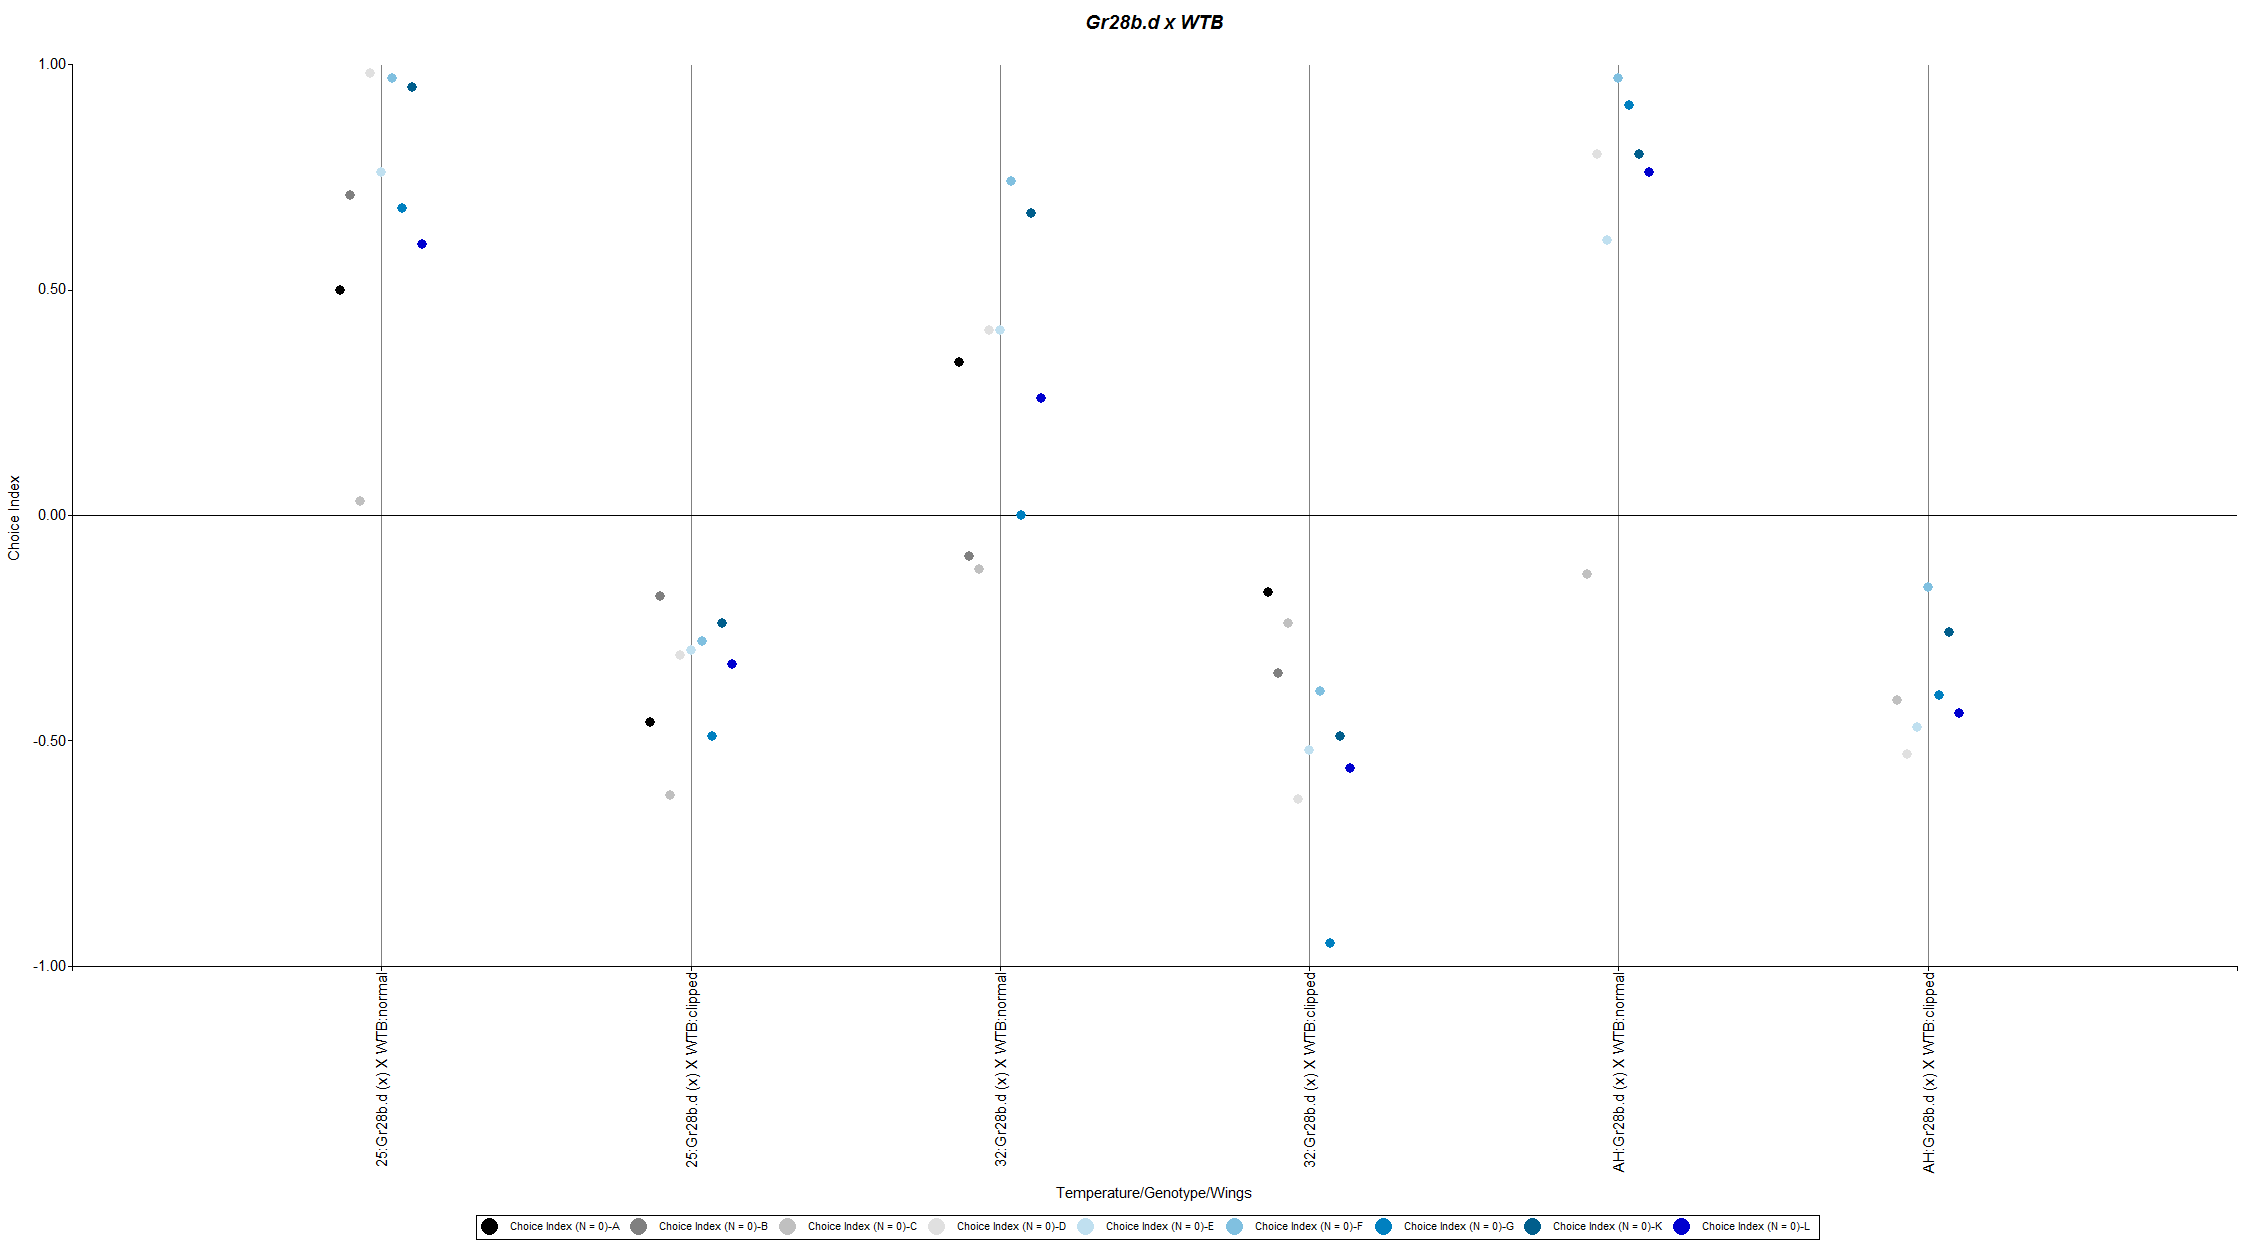
Figure 2: Gr28b.d(X) x WTB
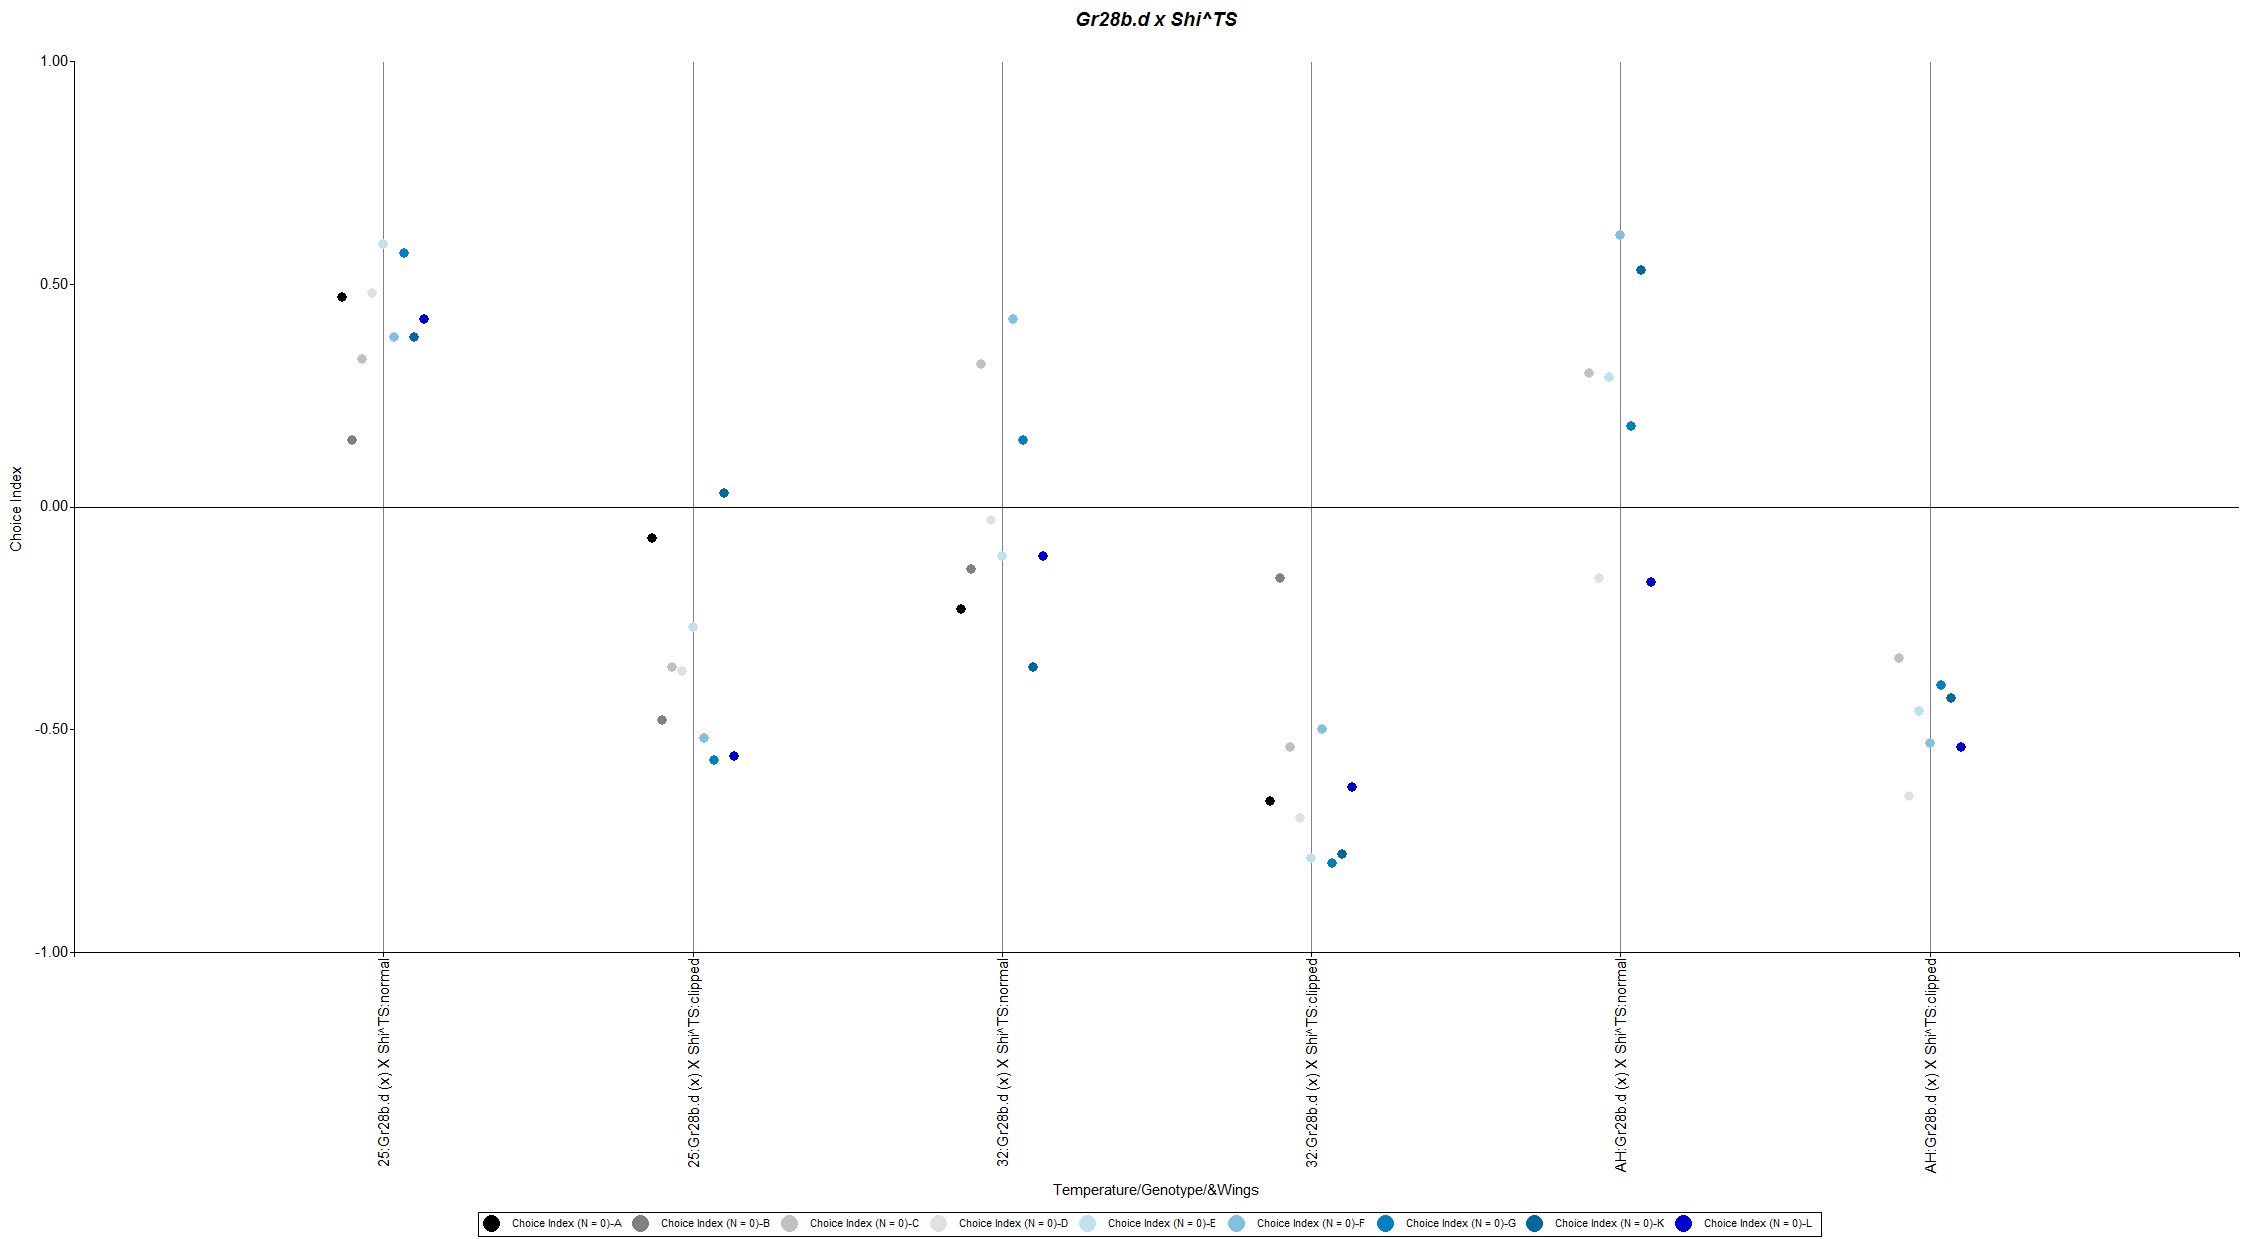
Figure 3: Gr28b.d(X) x ShiTS
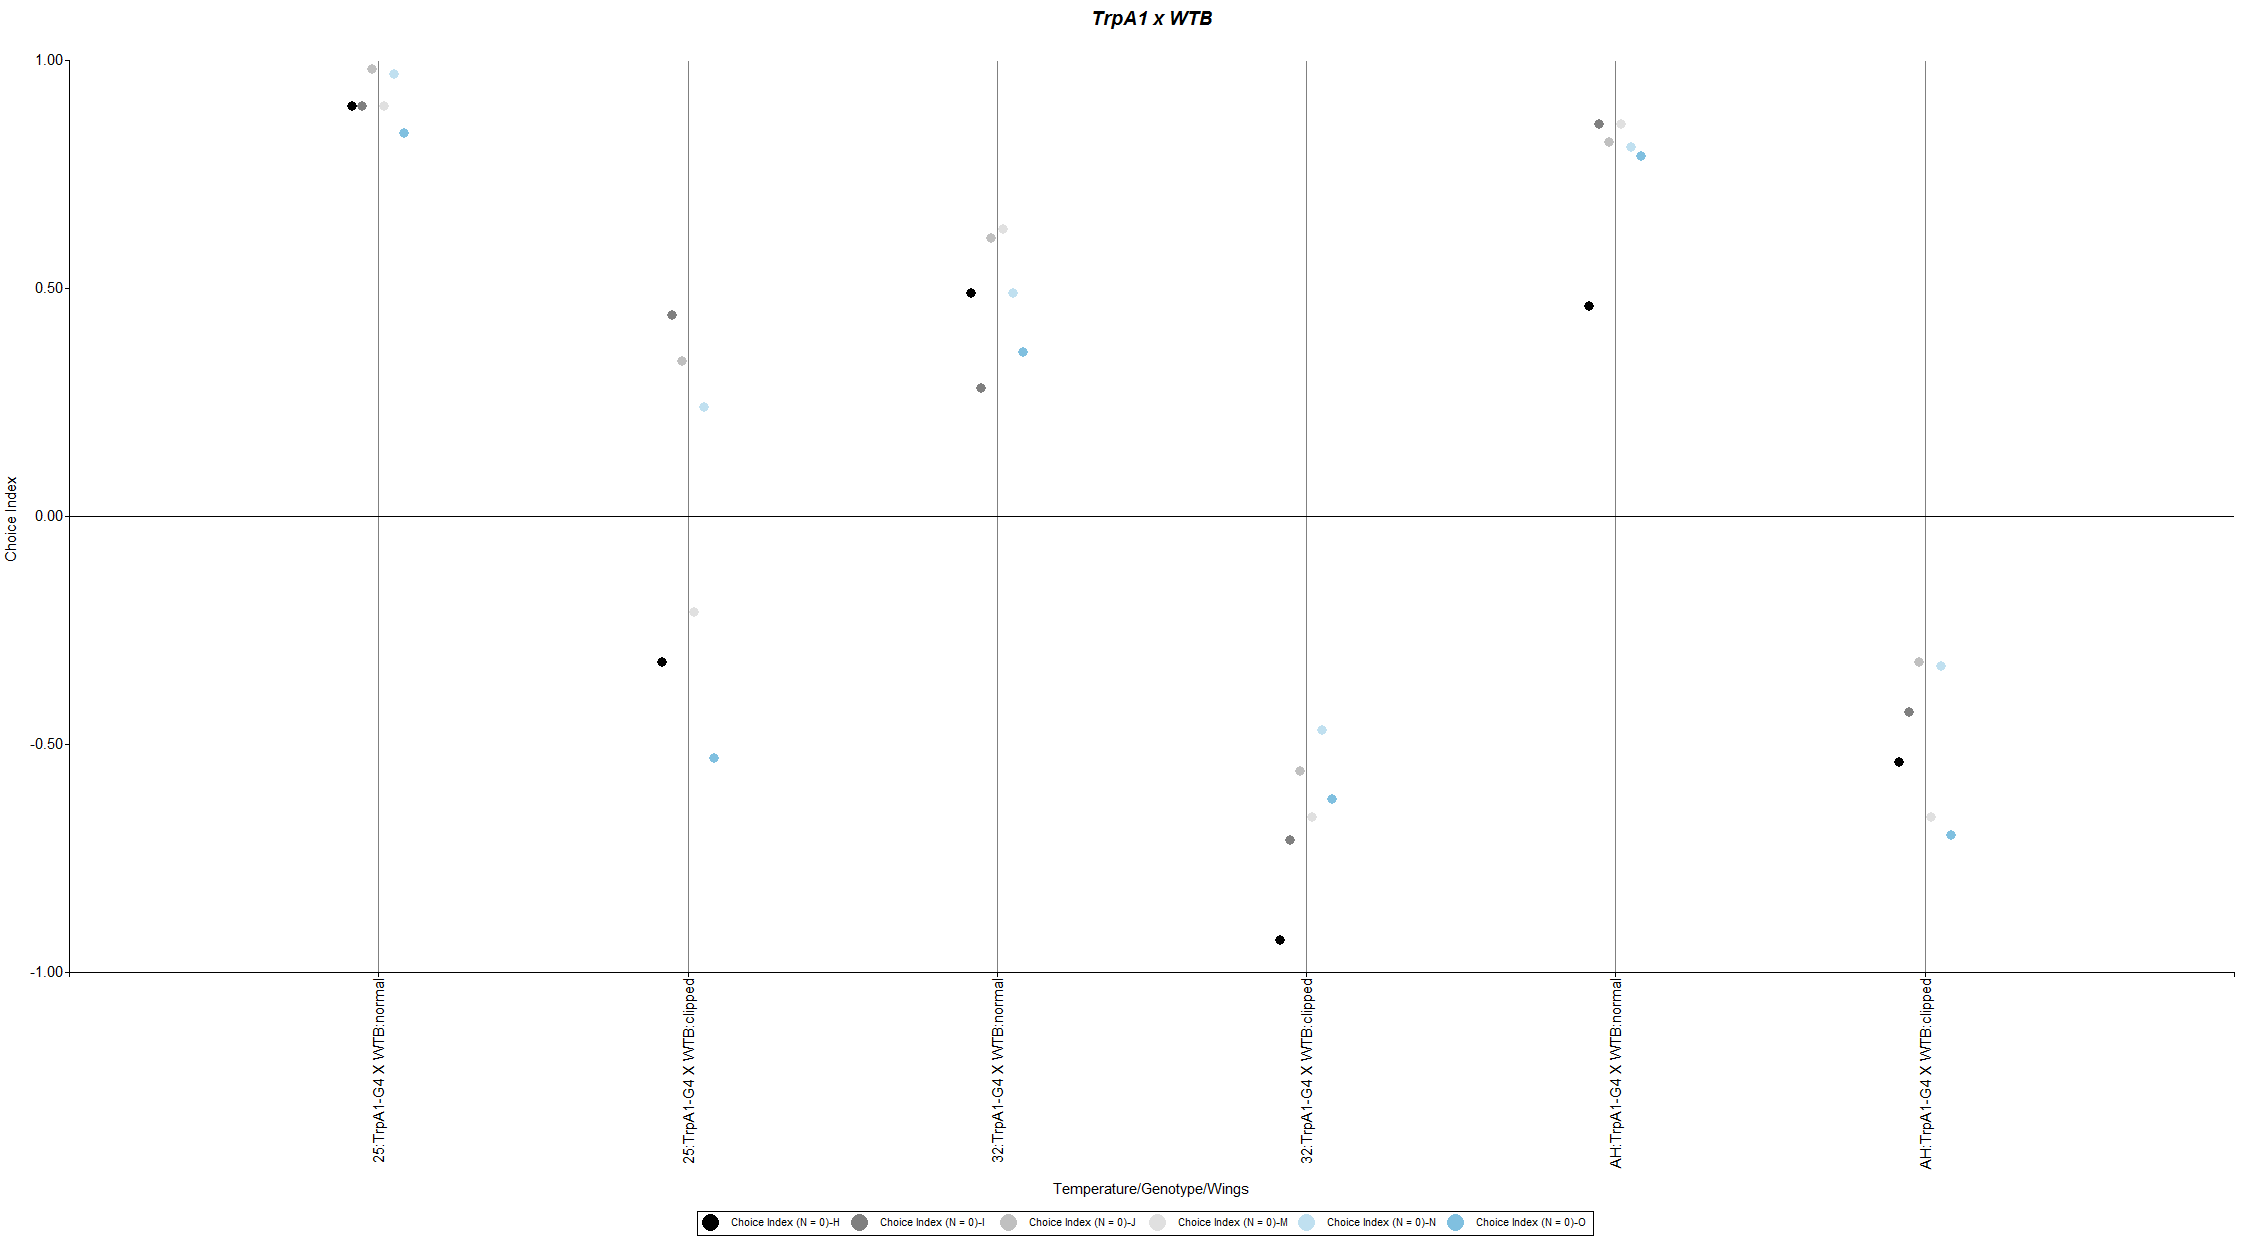
Figure 4: TrpA1 x WTB
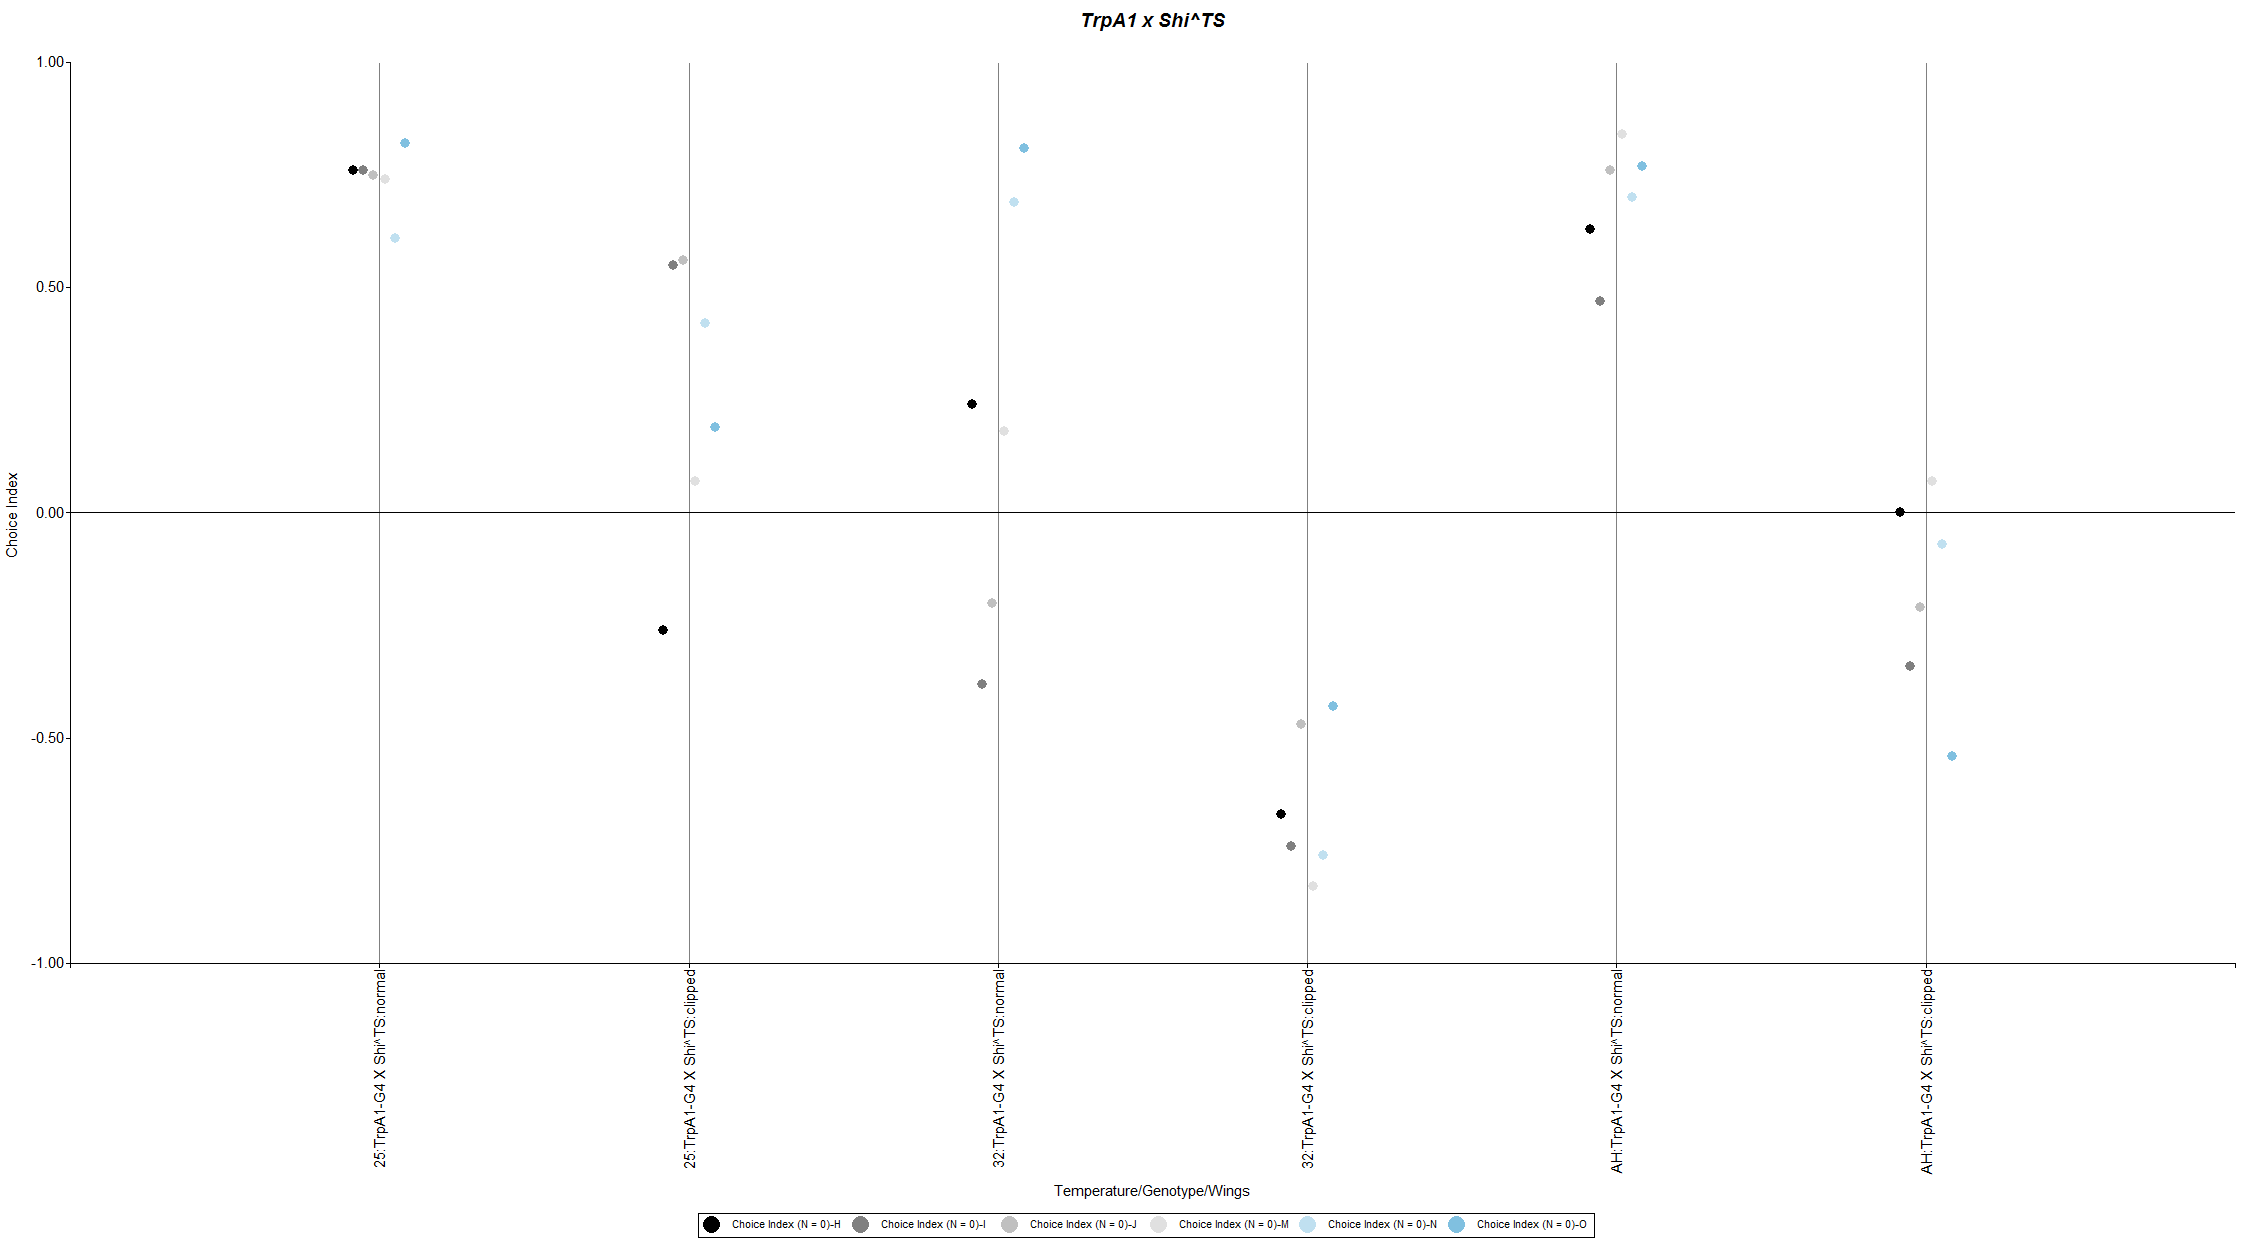
Figure 5: TrpA1 xShiTS
Figure 6 shows the results of the trials for the different WT lines.
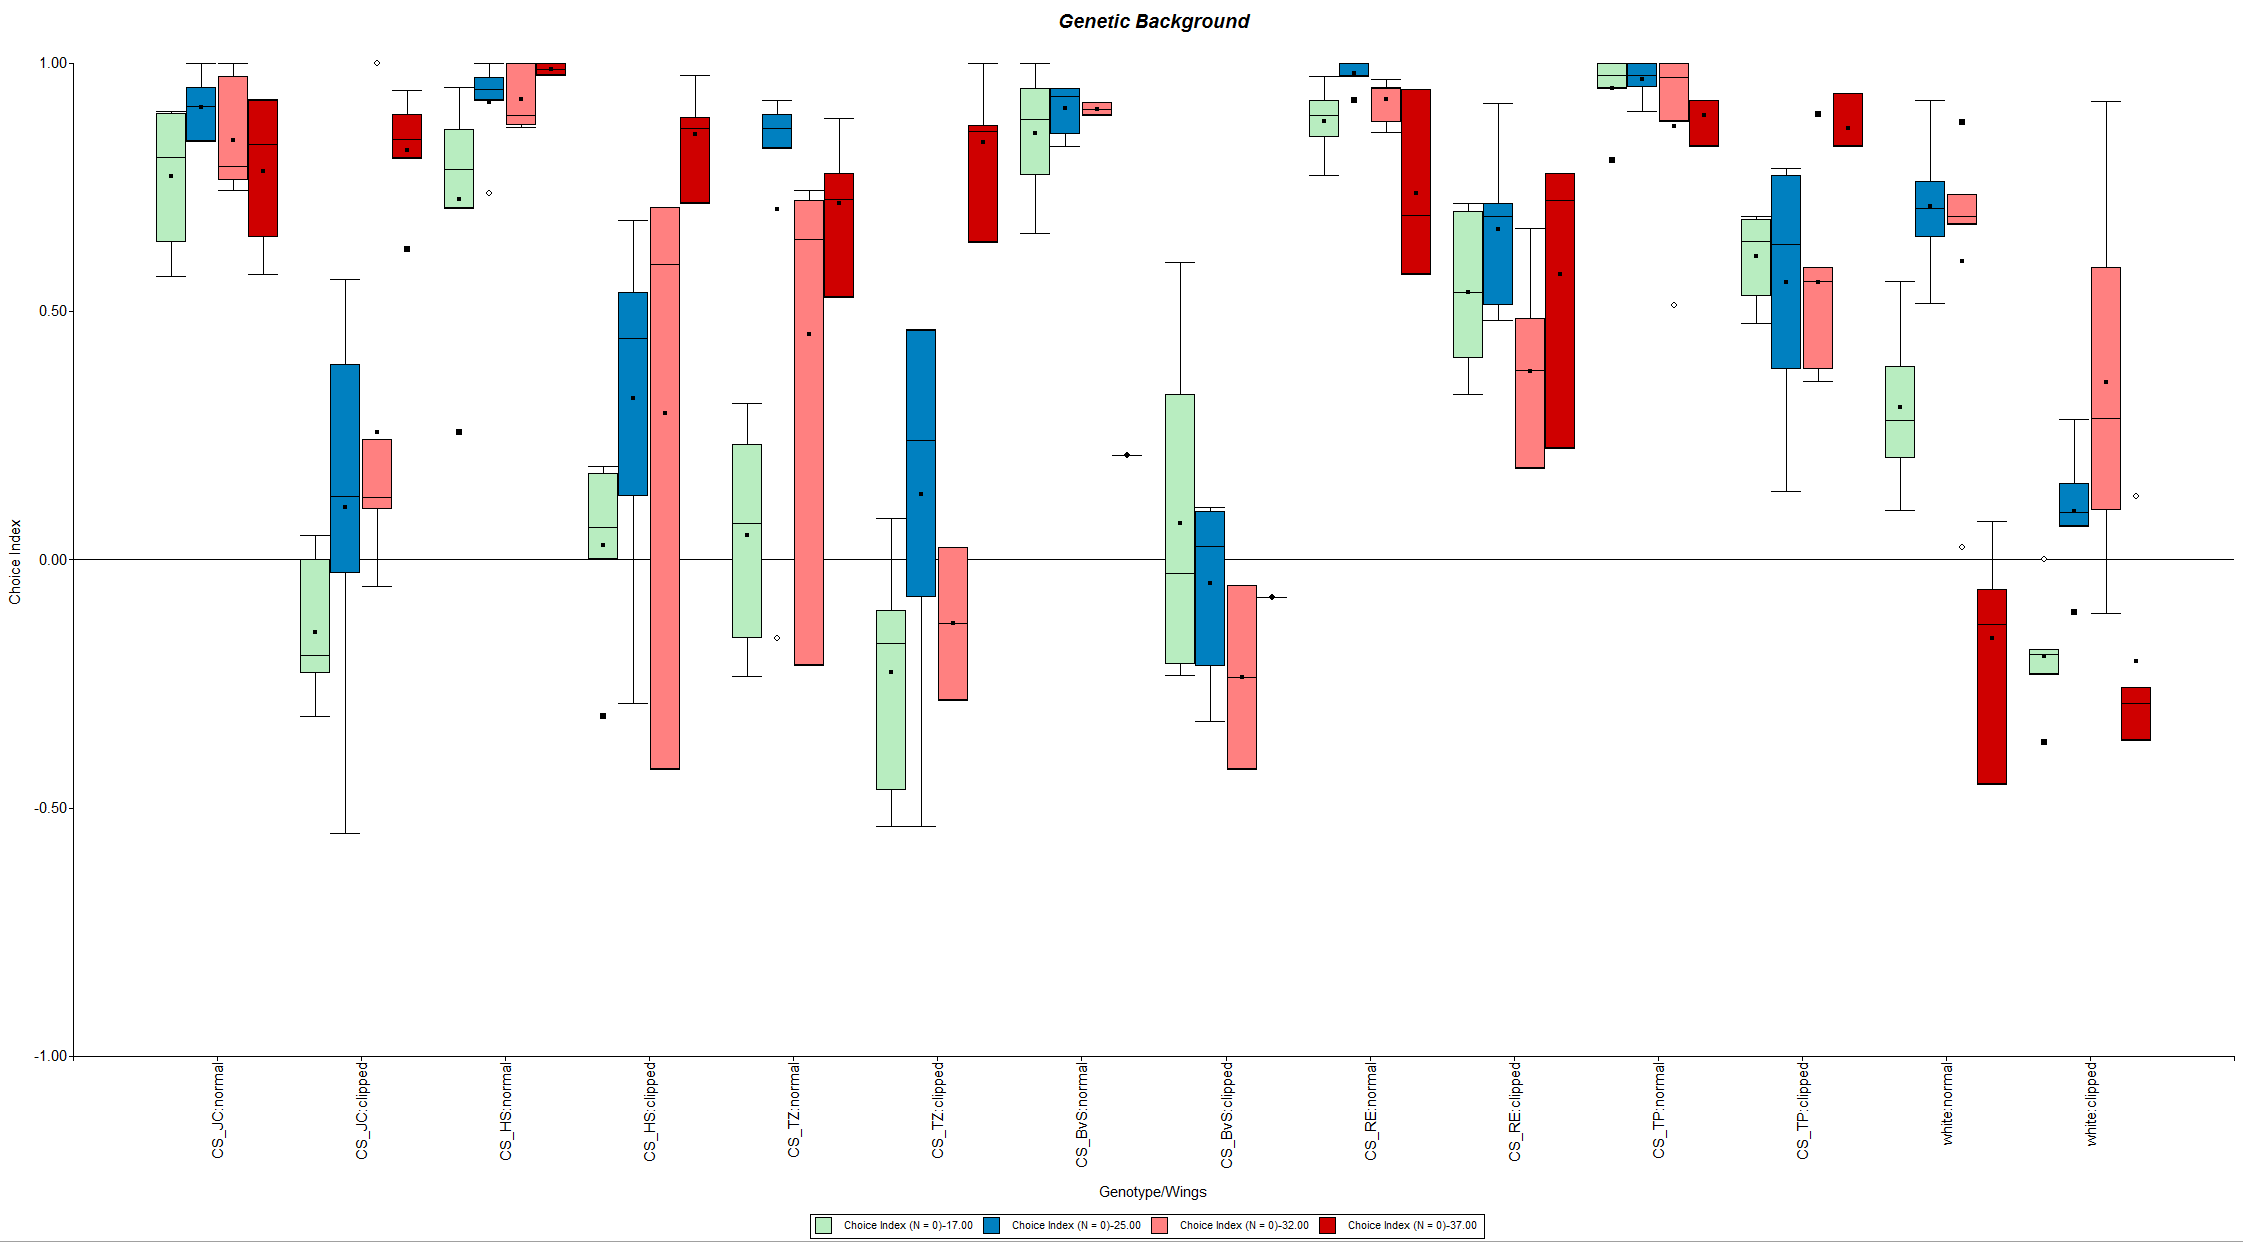
Figure 6: genetic background at four different temperatures (17°C, 25°C, 32°C, 37°C)
Category: temperature_phototaxis, wing clipping | No Comments
Temperature Impact on Phototactic Behavior – Different Dates and the Genetic Background
on Monday, November 23rd, 2015 2:43 | by Amelie Roedel
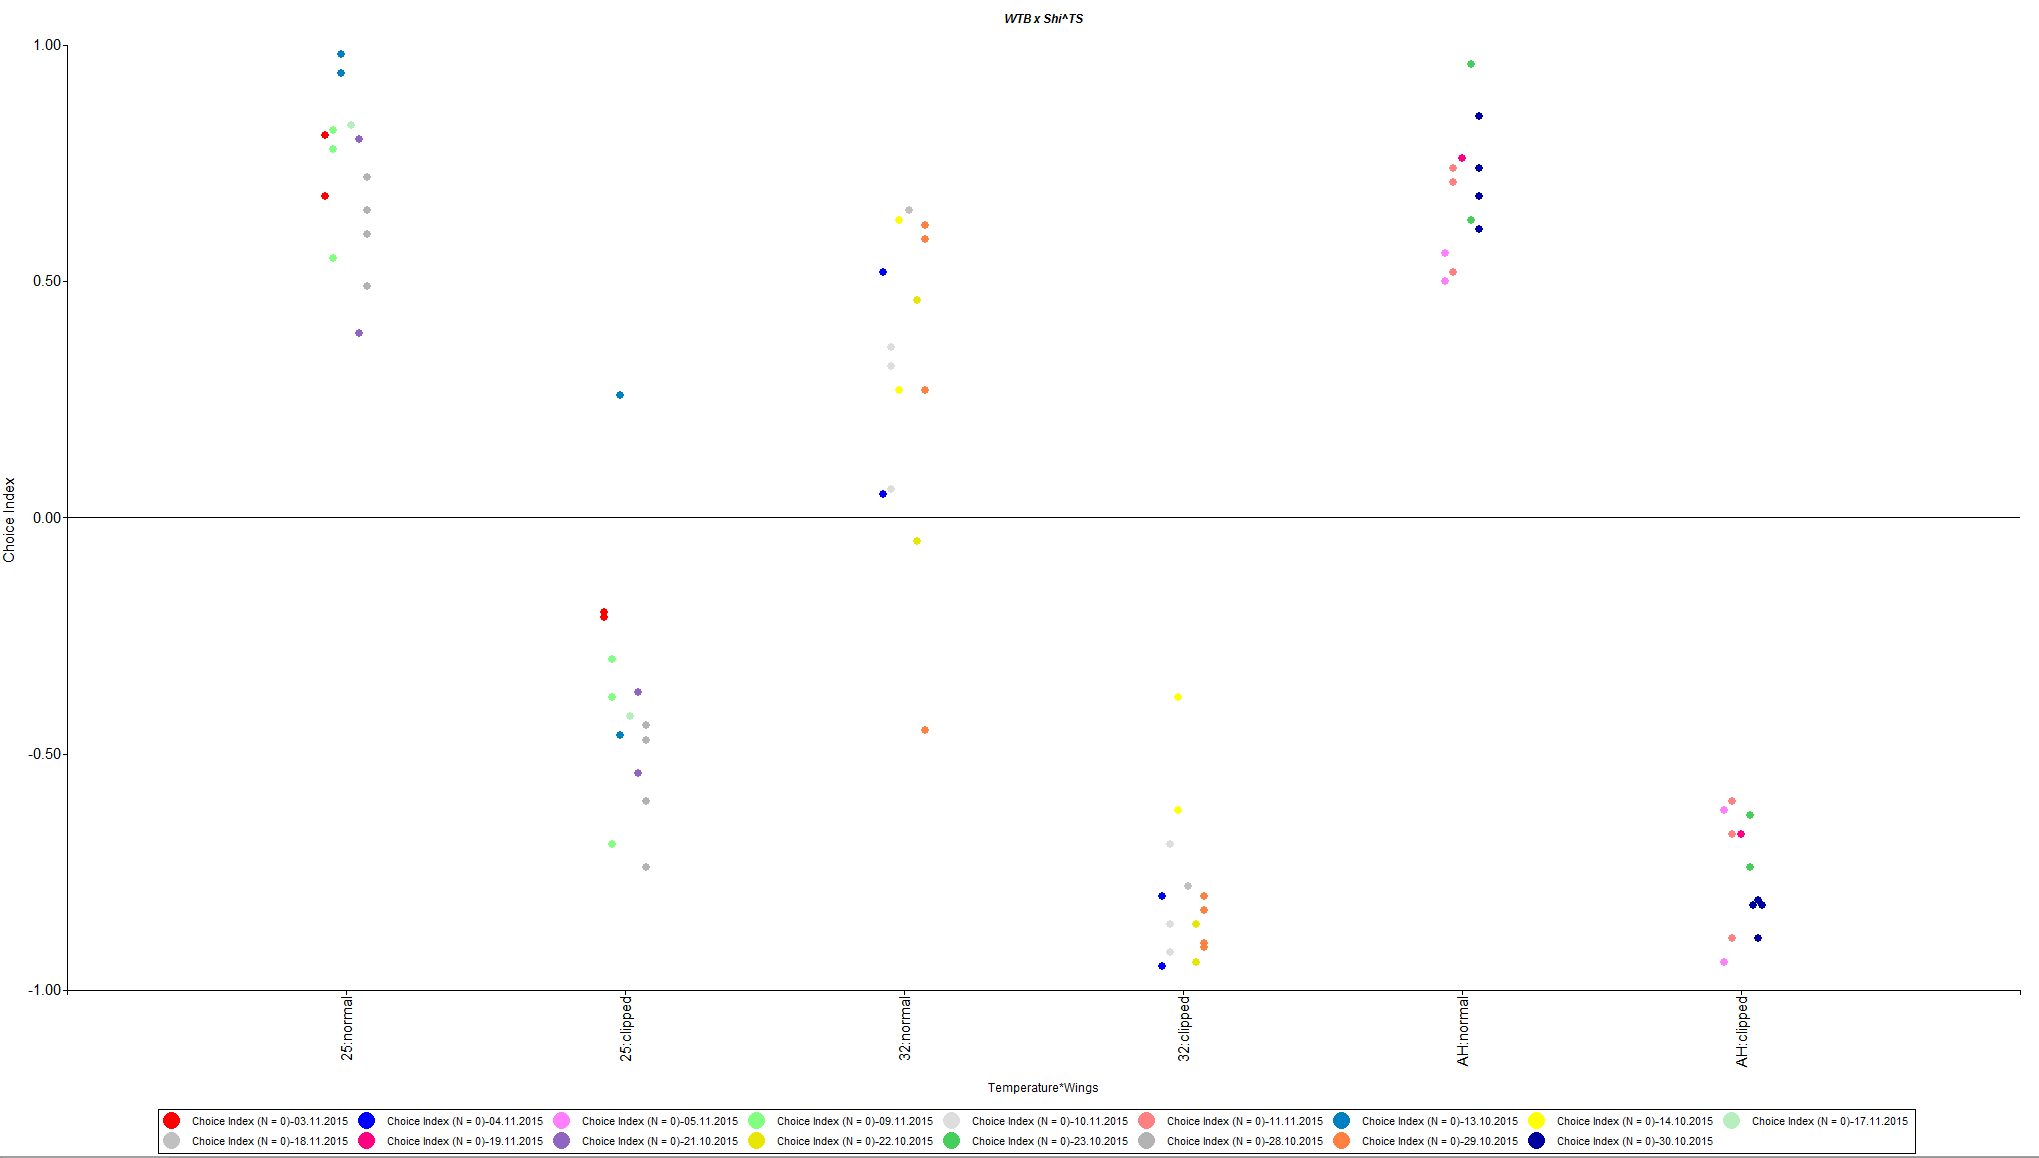
Figure 1: Shi x WTB sorted by date
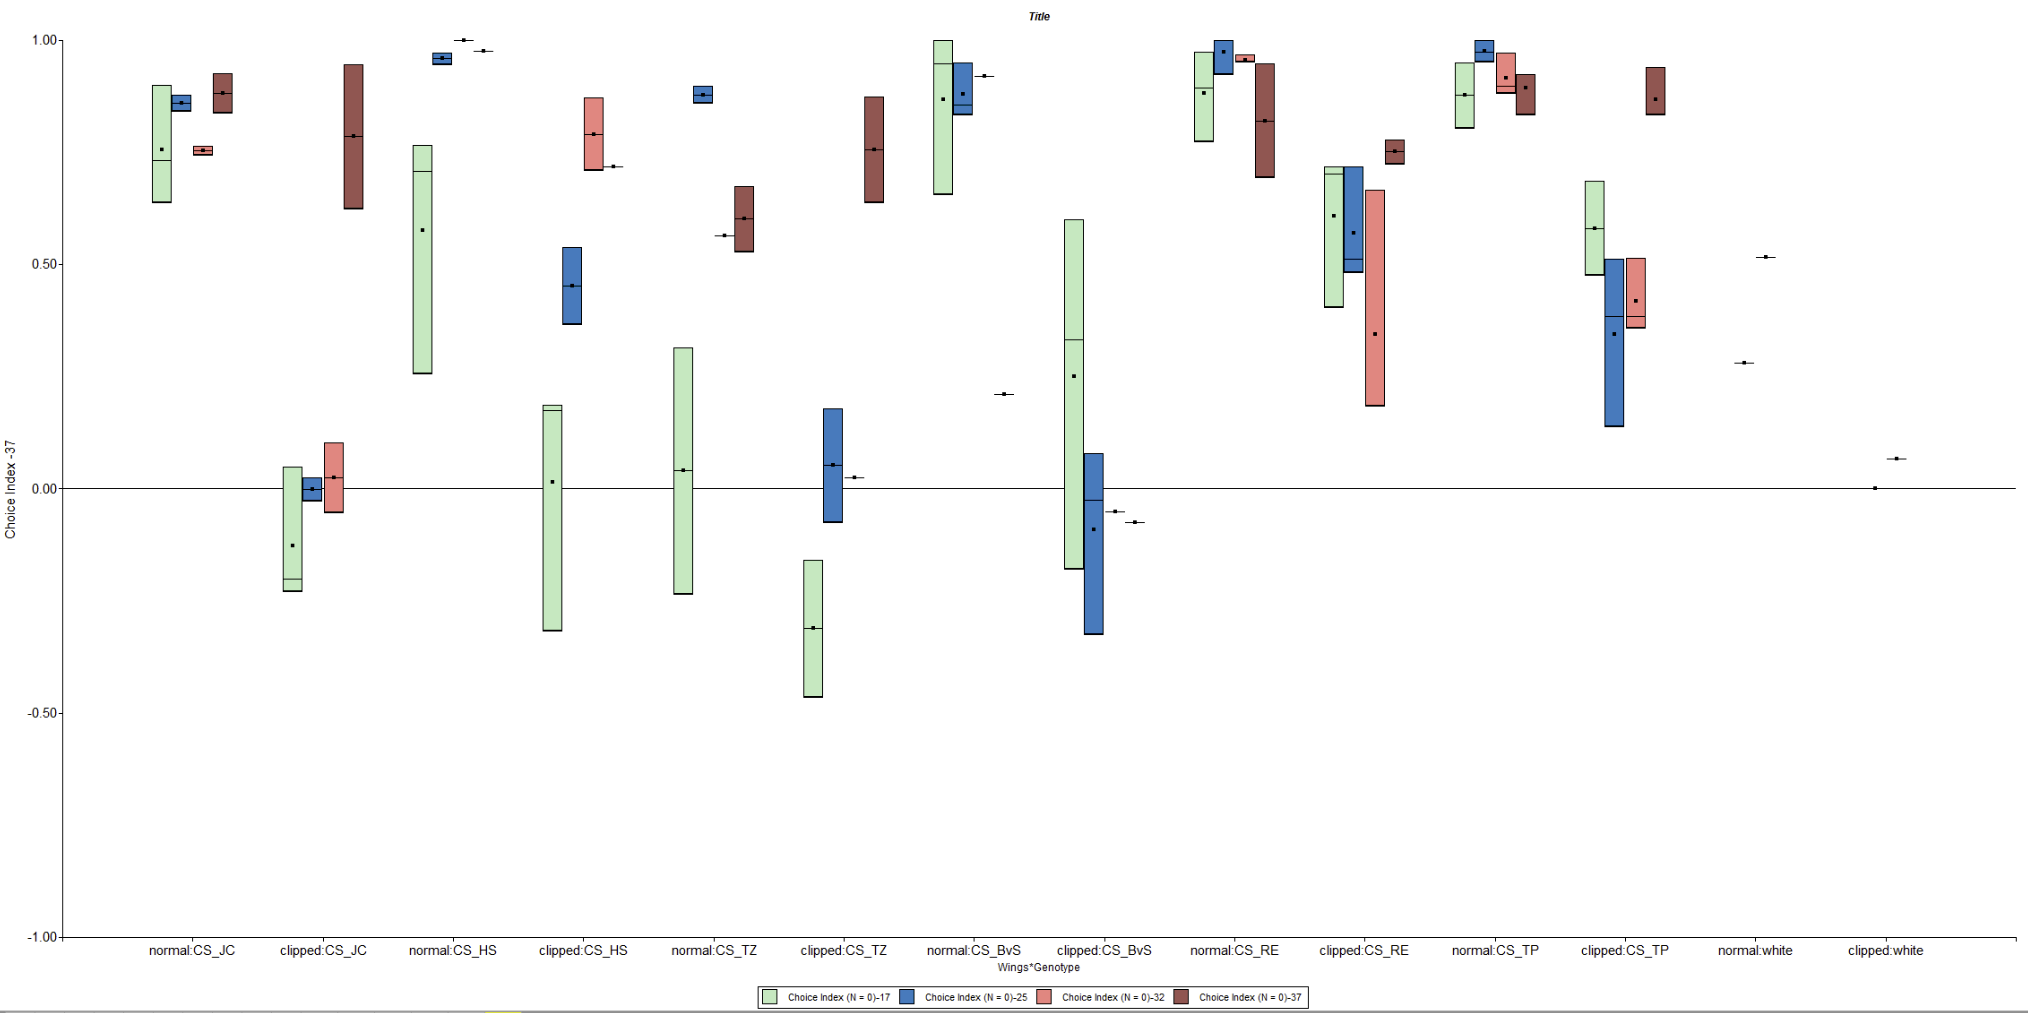
Figure 2: genetic background
Category: temperature_phototaxis, wing clipping | No Comments
Temperature Impact on Phototacitc Behavior – Update
on Thursday, November 12th, 2015 9:31 | by Amelie Roedel
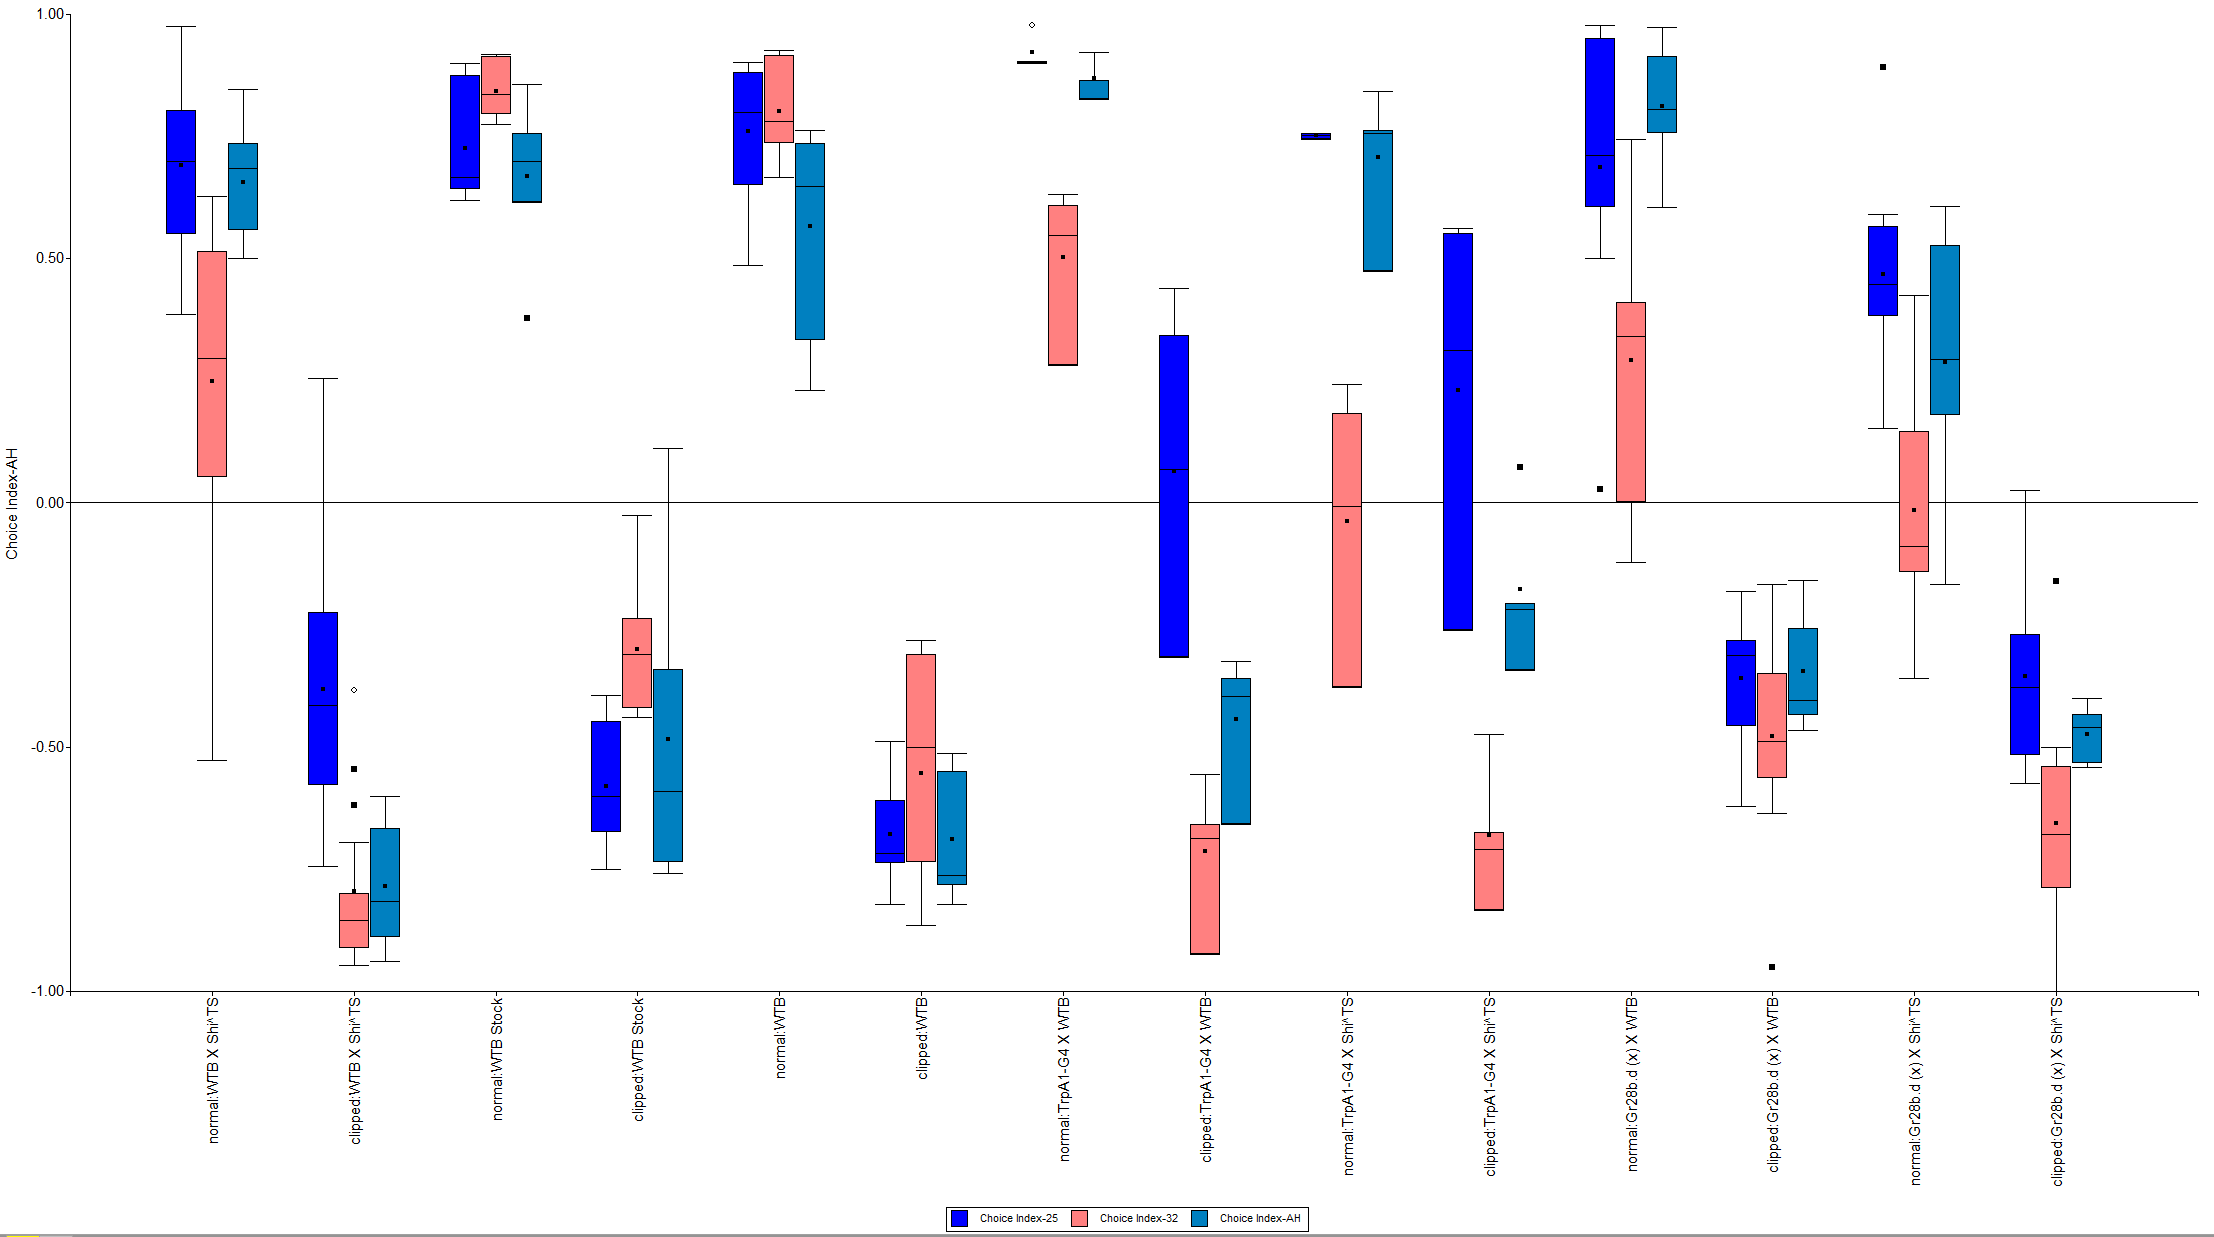
Figure 1: The different genotypes at 25°C, 32°C and back at 25°C
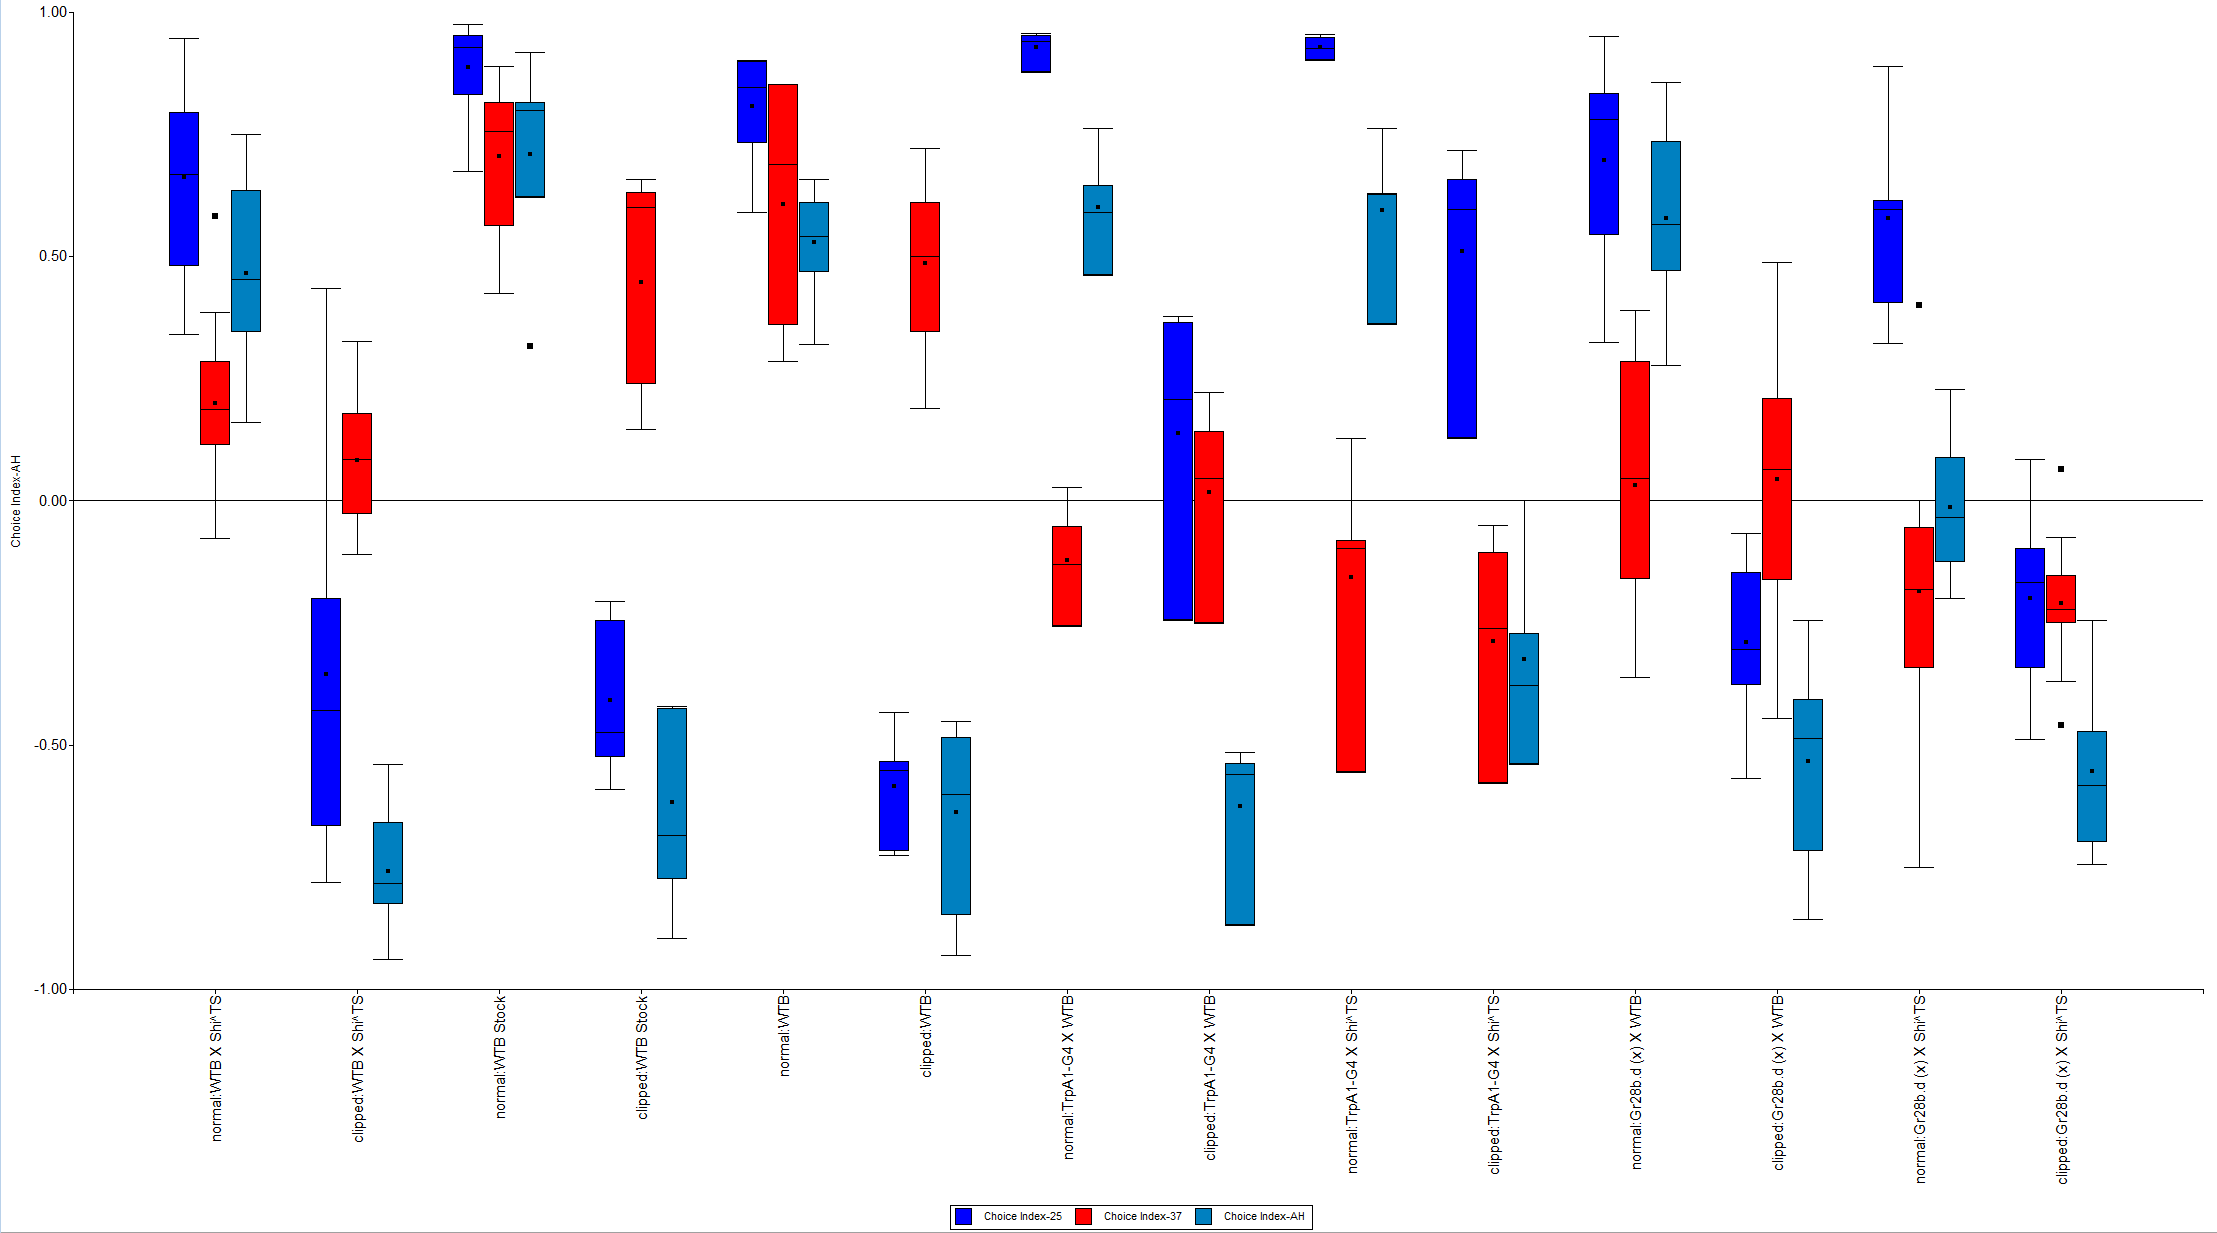
Figure 2: The different genotypes at 25°C, 37°C and back at 25°C
Category: temperature_phototaxis, wing clipping | No Comments
Temperature Impact on Phototactic Behavior – Gr28b.d(X) and TrpA1
on Friday, November 6th, 2015 11:33 | by Amelie Roedel
As the flies do not behave as they are supposed to (see figure 1 & 2), I’ll start testing the genetic background of different wildtypes to see if that has something to do with the wrong change in the behavior.
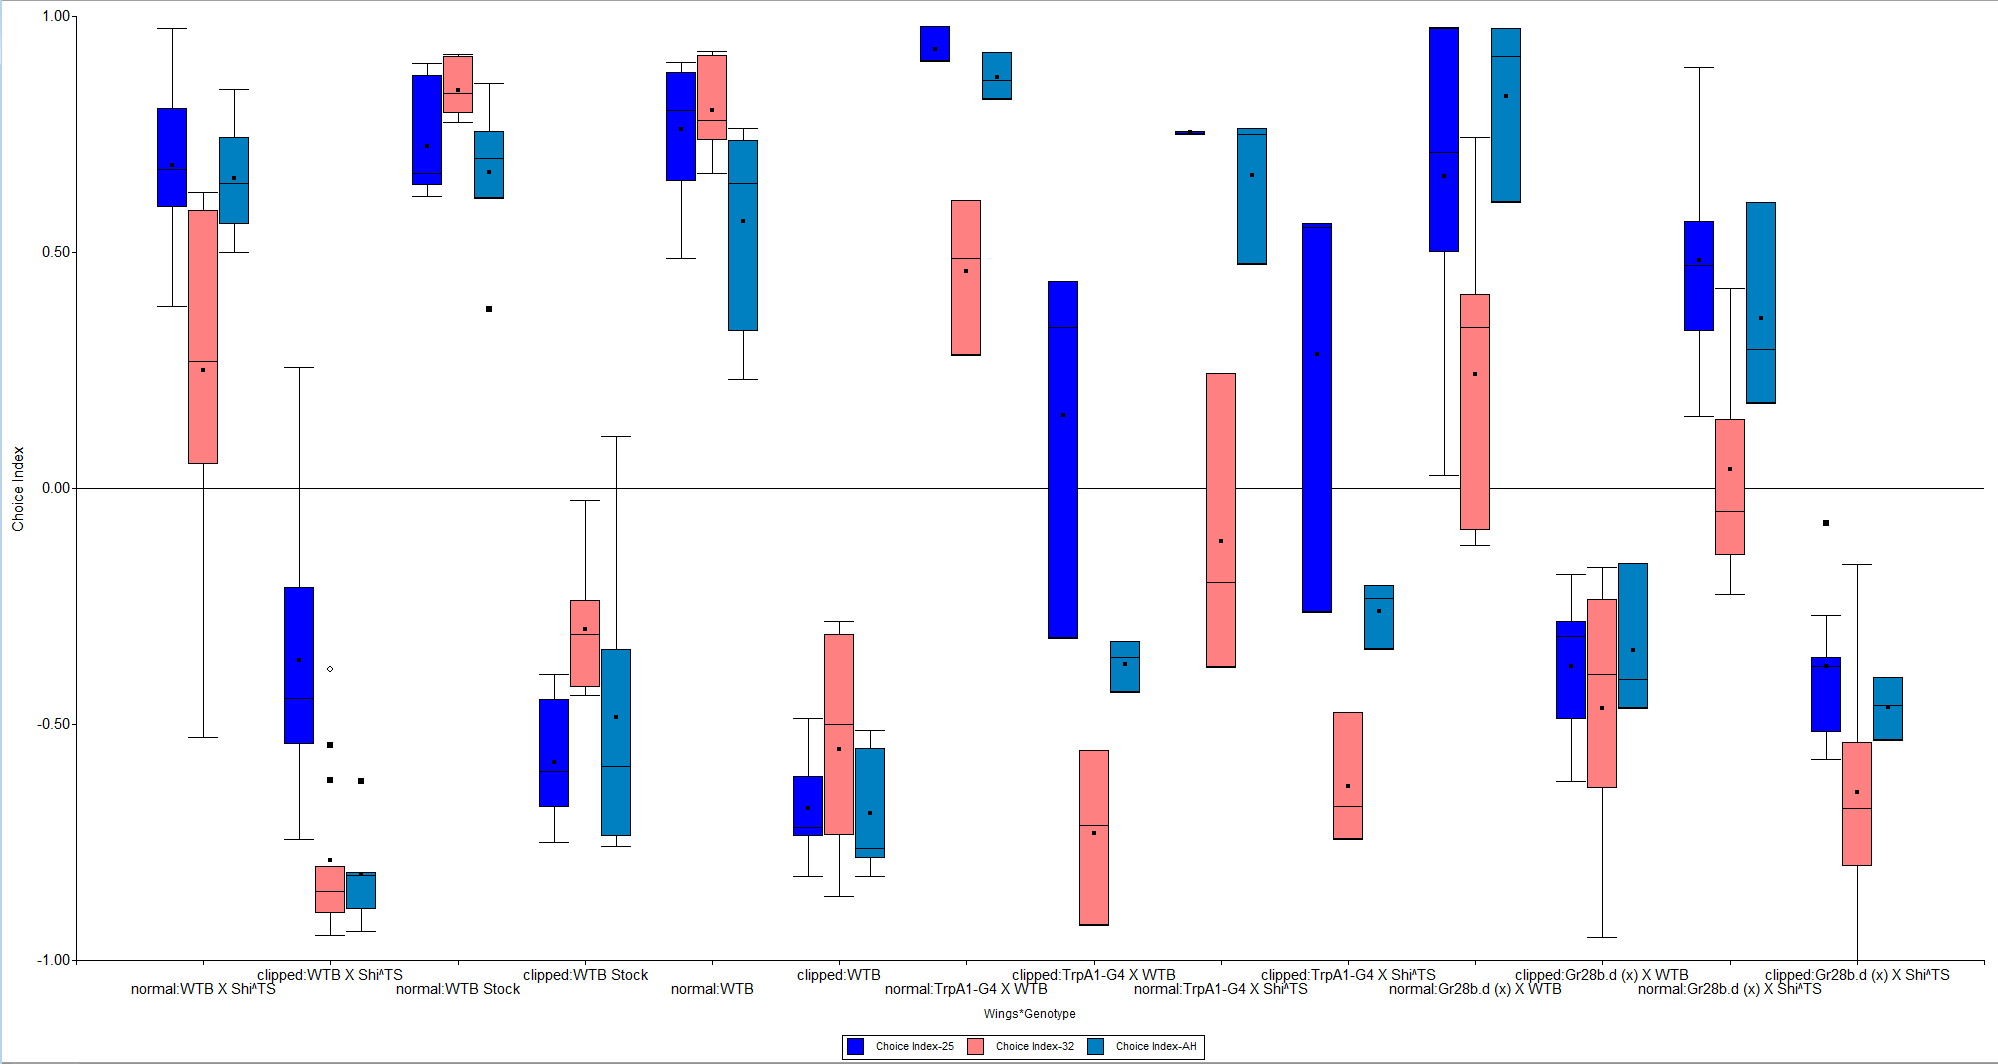
Figure 1: different genotypes testet at 25°C, 32°C and back at 25°C
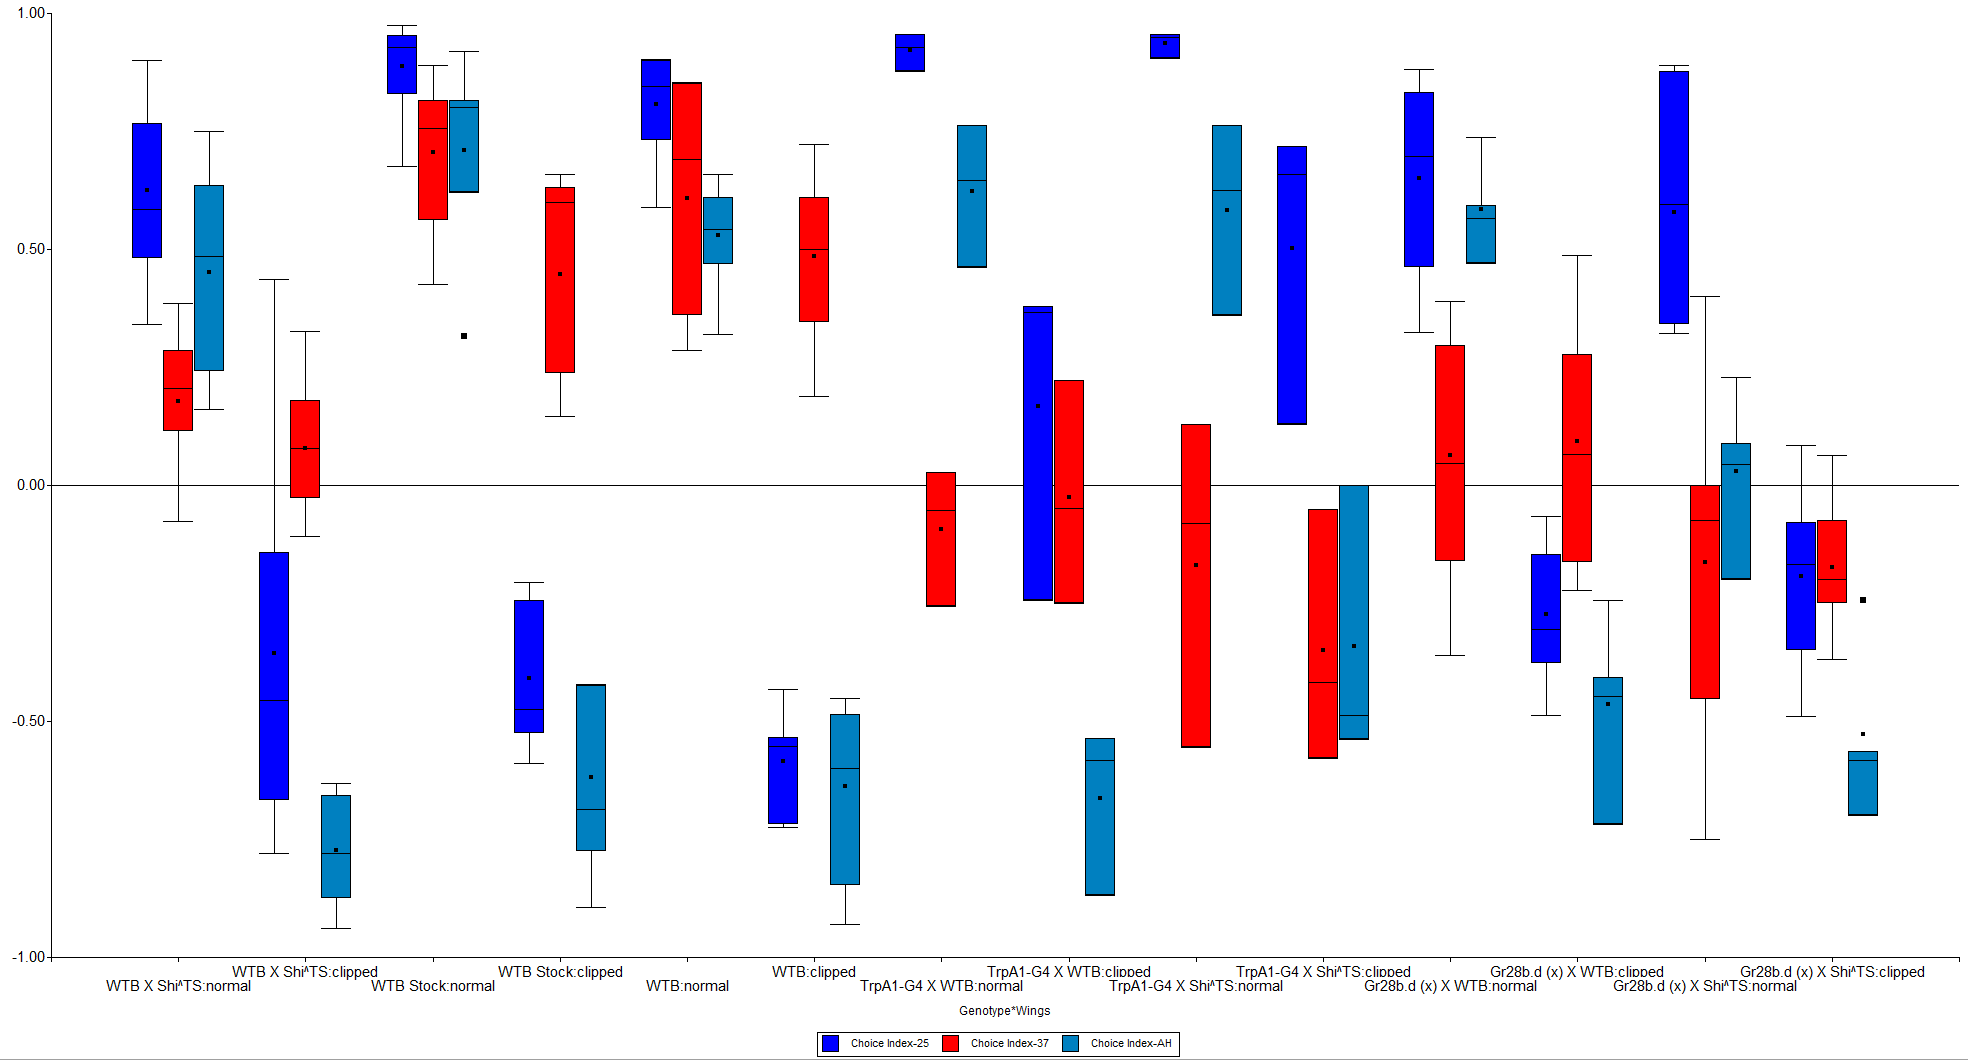
Figure 2: different genotypes tested at 25°C, 37°C and back at 37°C
Category: temperature_phototaxis, wing clipping | No Comments
Temperature Impact on Phototactic Behavior
on Friday, September 11th, 2015 8:36 | by Amelie Roedel
The apparatus I use to test the temperature impact on light preference is the T-Maze.
One day before the trials, I clipped off the wings of about 30 – 40 flies under CO2 and put them in a vial together with 30 – 40 flies with wings.
The intervals for the T-Maze are 15 minutes of temperature adaption, 10 minutes of darkness adaption, 30 seconds in the elevator and 30 seconds to choose between darkness and light.
In the rooms with the extreme temperatures of 4°C and 37°C, I had to check if they survive for the spell of time I wanted to test them (~ 26 minutes). In the room with the temperature of 4°C the flies didn’t survive longer than 3 minutes. So I tried to do a T – Maze with a 1 minute adaption for temperature, 1 minute adaption for darkness and again 30 seconds in the elevator and 30 seconds to choose between light and darkness. But the result was not evaluable because the flies didn’t move. So we agreed on not going on with this trial.
In the room with the temperature of 37°C the flies survived perfectly.
After having eight trials for each room, I evaluated the data with “InfoStat” (see figure 1 & 2). The flies without wings went to the darkness and the ones with wings went to the light. In the room with the temperature of 37°C the results were not as we expected (expected Choice Index = 0). I tested them again, but it remained the same. After realizing that the intensity of light could influence the behavior I measured the lux in the different rooms to see if that was a reason for the unexpected results. But even after controlling the intensity of light in all the rooms the behavior didn’t change (see figure 1 and 2).
We decided to retest the flies. I took eight vials holding ~ 40 flies with wings and ~ 40 flies without and tested them in the room with the temperature of 25°C. After the trial I gave them approximately 5 hours to recover from the CO2 treatment and I reused them for the trial in the room with the temperature of 37°C. The result was the same (see figure 3).
We decided to try what would happen if I gave them more time to choose between light and darkness. Now the behavior changed (see figure 4; 3 minutes to choose between light and darkness, “Slow Phototaxis”).
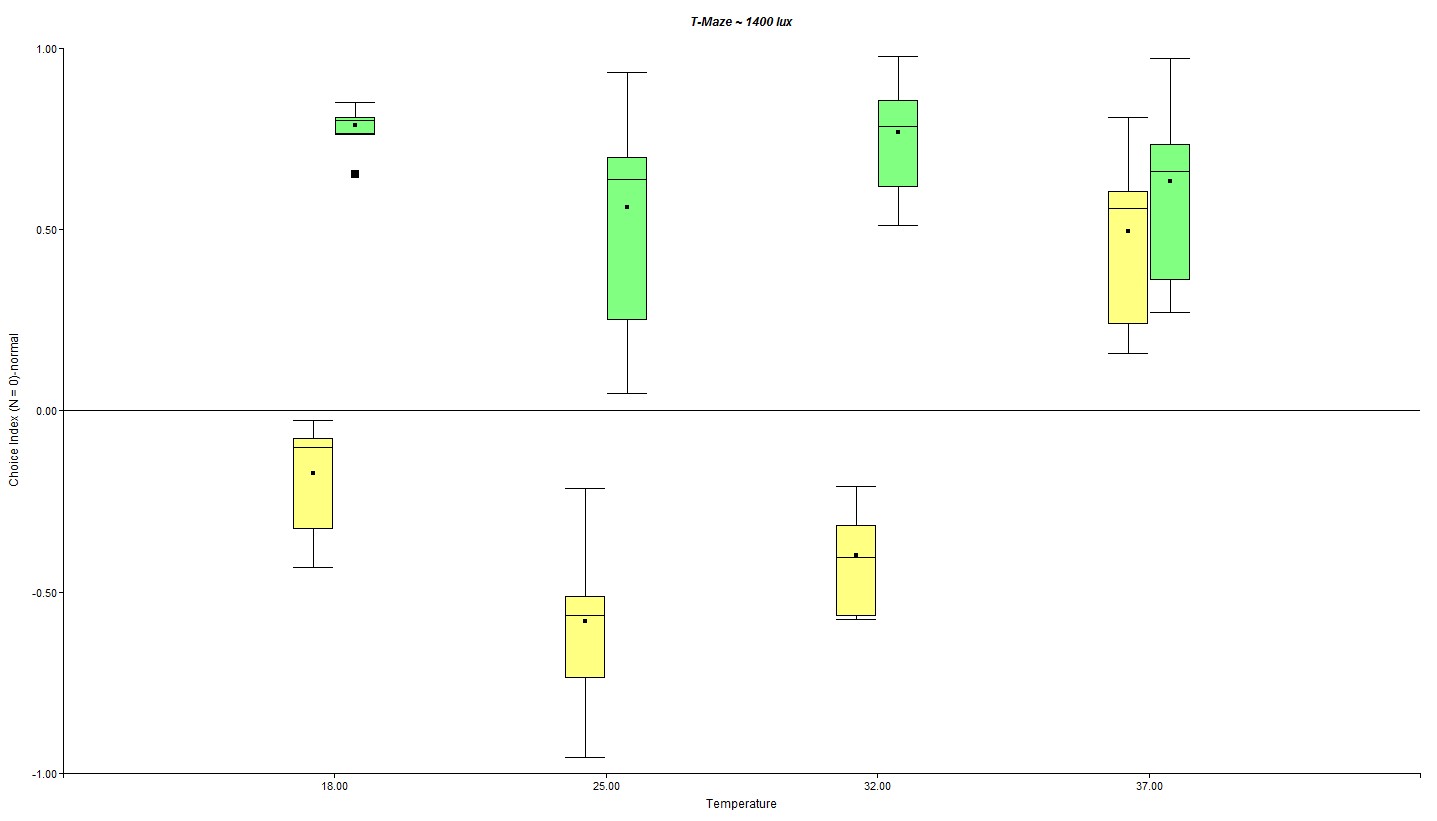
(Figure 1: Behavior in the rooms with the different temperatures, light intensity = 1400 lux)
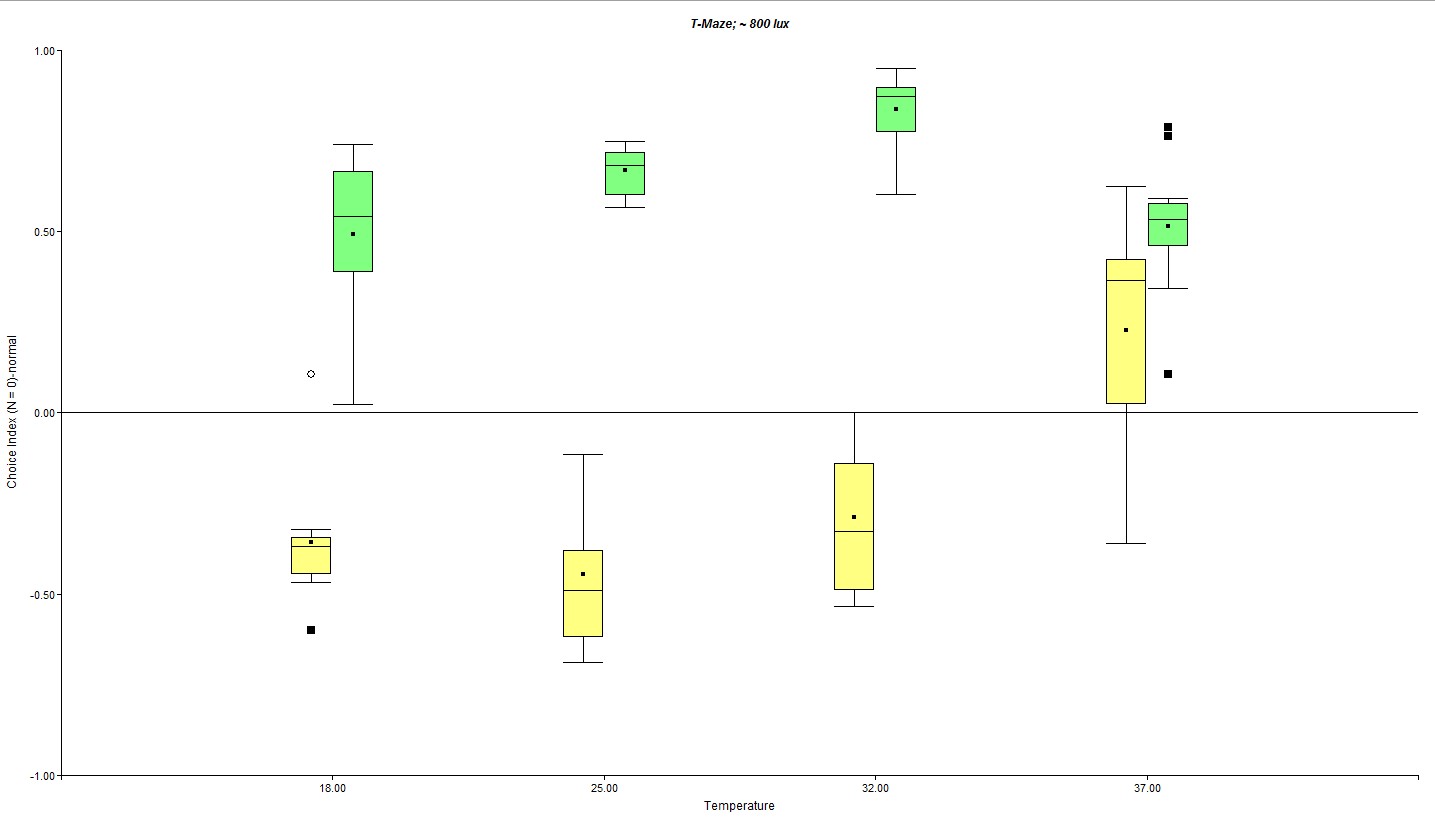
(Figure 2: Controlled intensity of light, 800 lux)
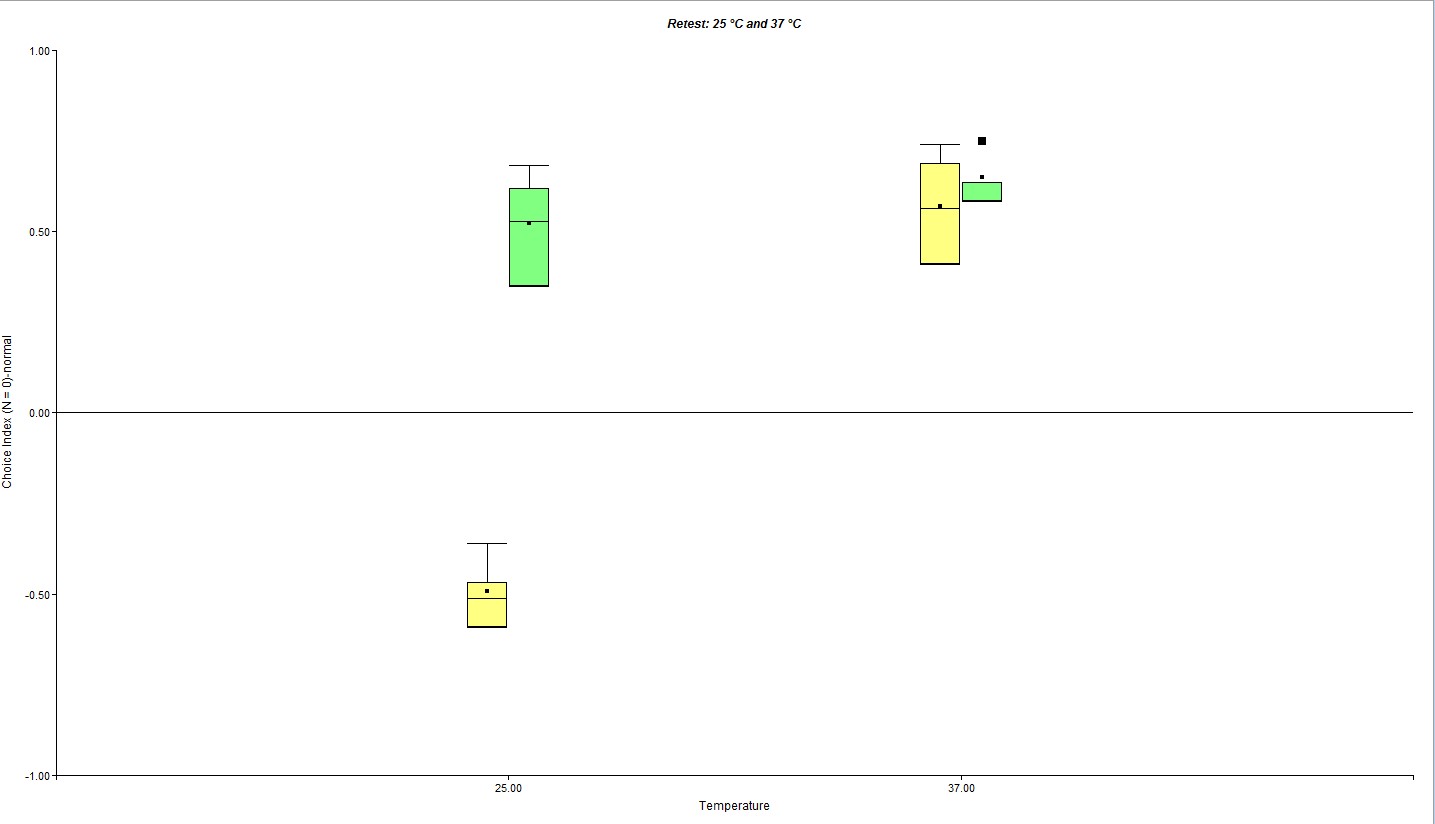
(Figure 3: Retest of eight vials in the rooms with the temperatures of 25°C and 37°C)
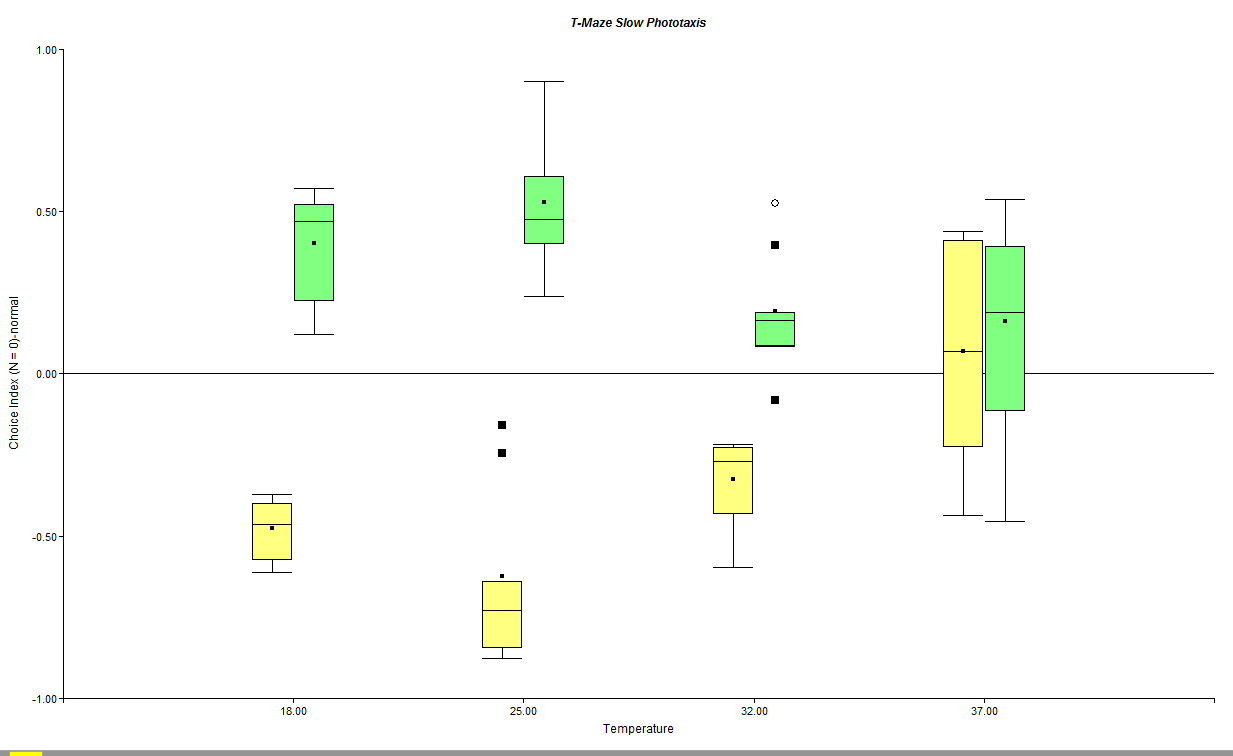
(Figure 4: Slow Phototaxis, behavior changed in the room with the temperature of 37°C)
Category: temperature_phototaxis | No Comments