Prediction with binnning
on Monday, March 21st, 2016 1:13 | by Christian Rohrsen
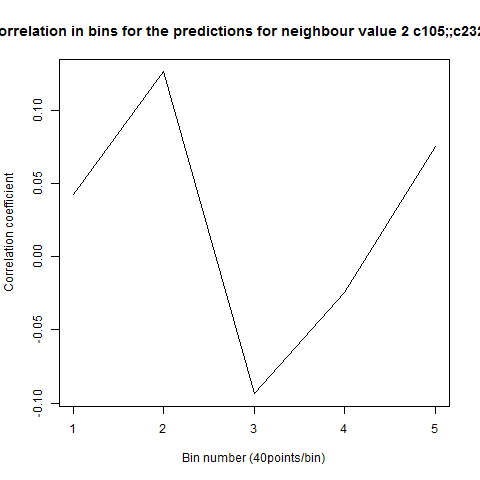
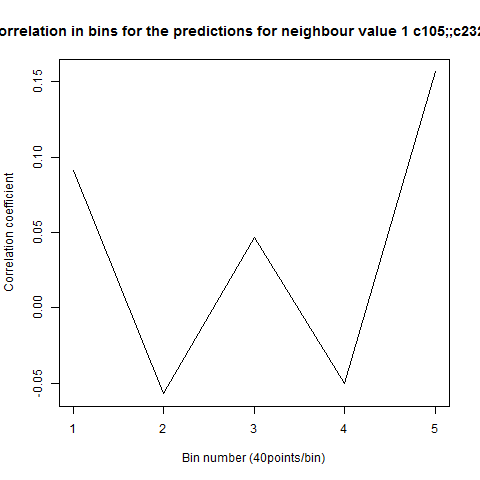
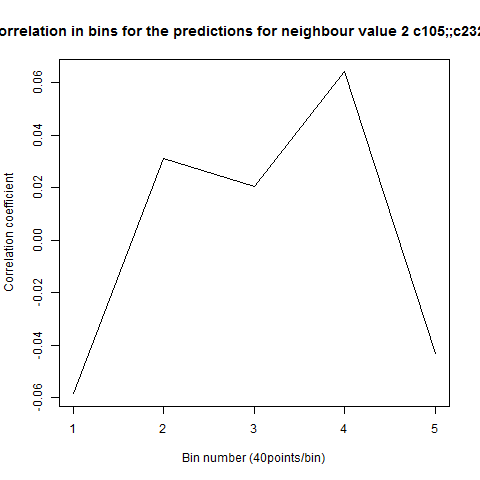
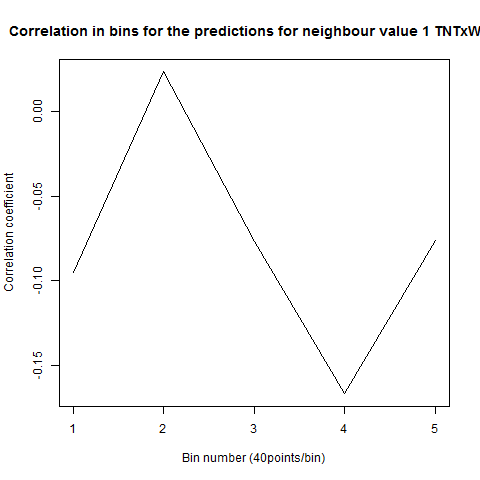
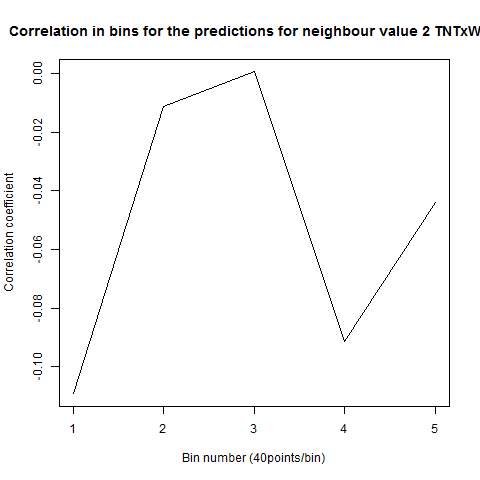
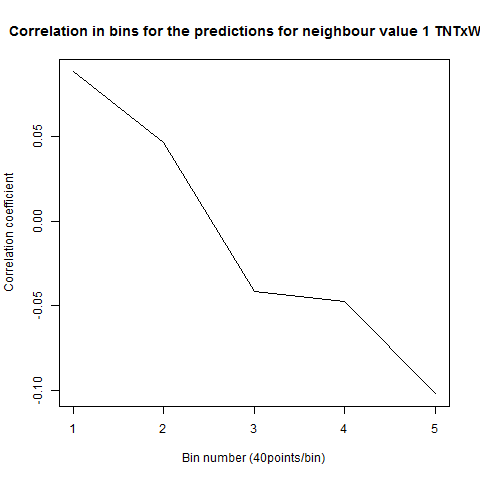
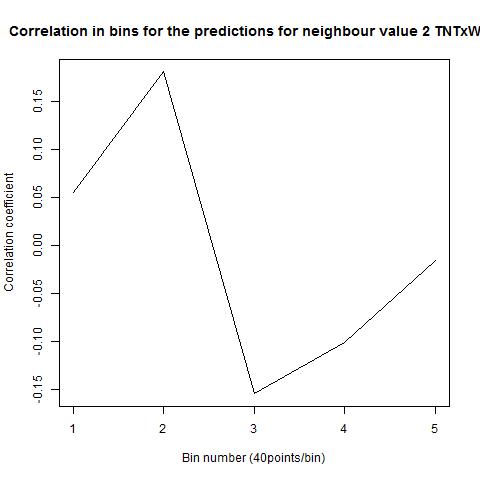
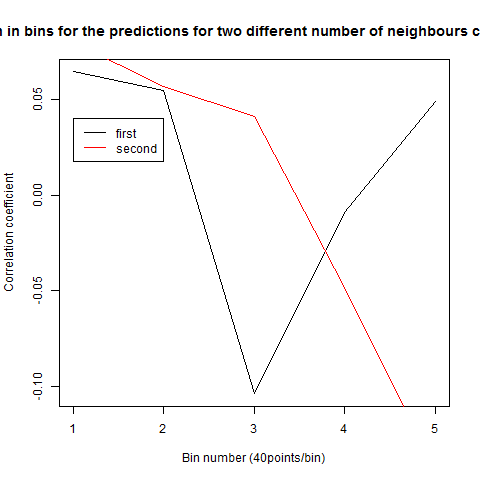
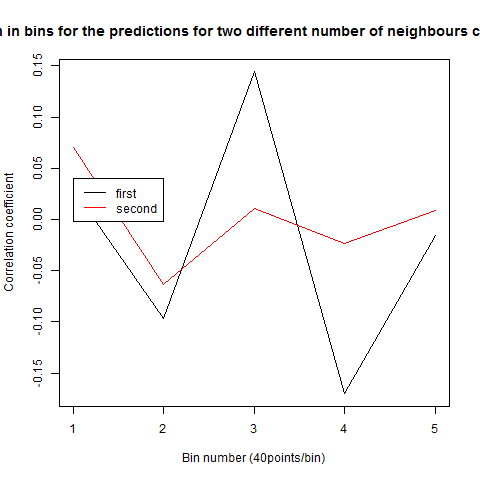
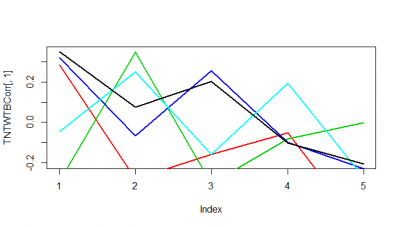
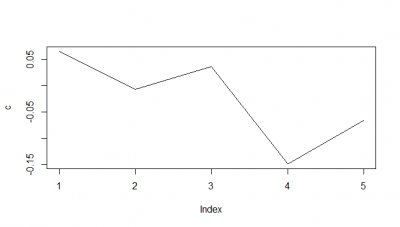
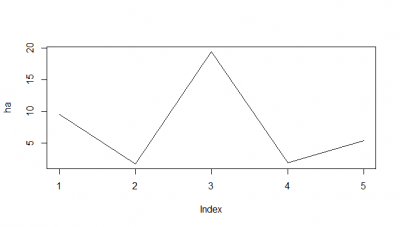
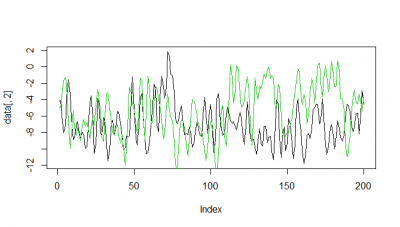
To see if there is an exponential decay in the prediction of the fly traces we did correlations of bins of 40 data points. We have 4 graphs (the last one merged) which consist of predictions at two different points with two different number of neighbours used for the prediction. So we have for each group sucesively: prediction at the first prediction point with the first number of neigbours, then the same with different number of neighbours. The last two are two different numbers of neighbours for the second prediction point. In the order: c105;;c232>TNT, TNTxWTB, c105;;c232xWTB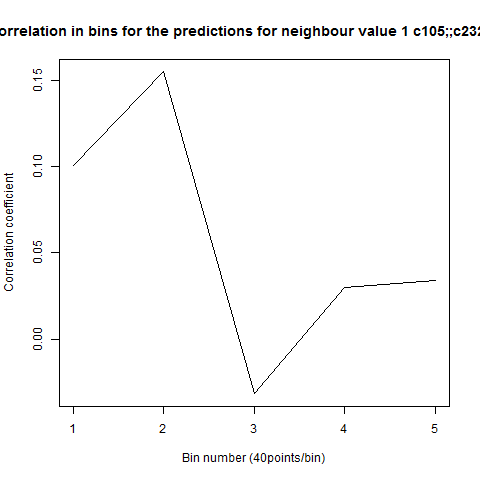

Category: R code, Spontaneous Behavior, strokelitude, WingStroke | No Comments
Nonlinear signature of Drosophila in Strokelitude
on Monday, March 14th, 2016 1:48 | by Christian Rohrsen
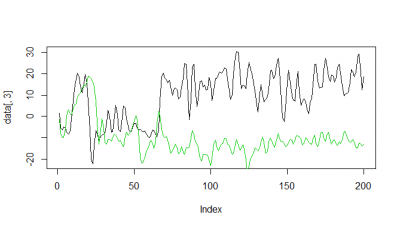
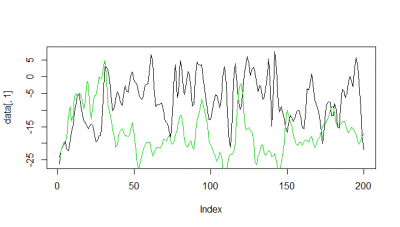
This is now the results from trying to predict the fly behavior doing ensembles of two predictions for the next 200 data points at two different points of the traces.
c105;;c232>TNT:
WTBxTNT: 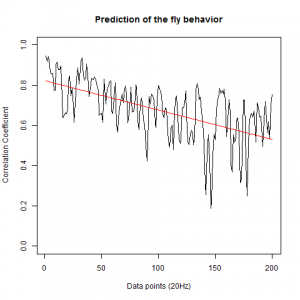
WTBxc105;;c232: 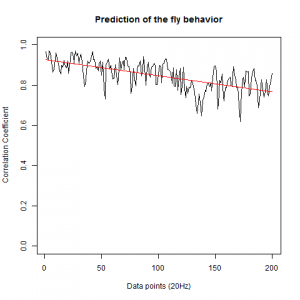
From what we see here, there is no “flattening” in the prediction of the fly when the neurons under c105 and c232 are targeted by TNT. This is done with around 14/15 flies for each group with two predictions in each ensemble of the two starting points. That makes a total of 15flies x 3 groups x 2 starting points for prediction x 2 predictions per ensemble = 180 prediction traces. Now I´m trying to calculate it by making correlations of bins in the prediction-observed for the same fly
Category: R code, Spontaneous Behavior, strokelitude, WingStroke | No Comments
Fly behavior prediction in the platform
on Monday, February 15th, 2016 2:25 | by Christian Rohrsen
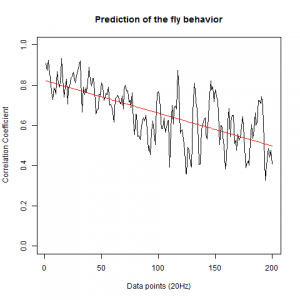
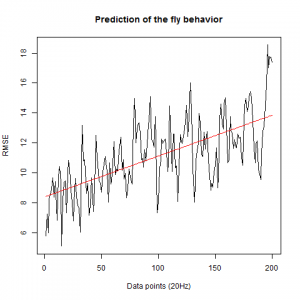
This is the prediction analysis of flies in the platform under a 20min experiment under dark conditions. The number of experiments change drastically among groups because of technical problems: WTBxTNT is 4, WTBxc105;;c232 is 22, for the experimental line is 6 (c105;;c232>TNT), for the platform without flies is 10. I show the root mean squares and the correlation coefficient for each group.
This is the experimental group: c105;;c232>TNT.
The group without flies on the platform. I expect here to get a very good predictability overall:
WTBxc105;;c232 group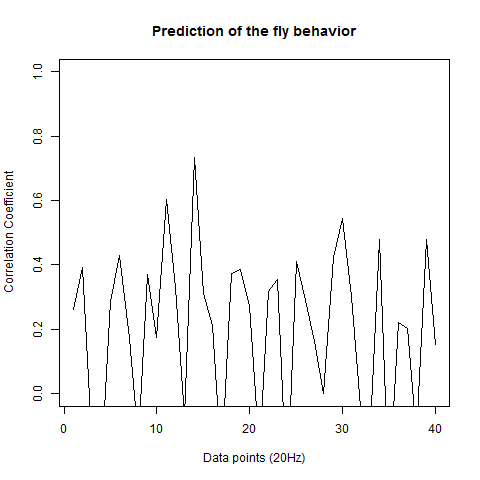
 WTBxUAS-TNT
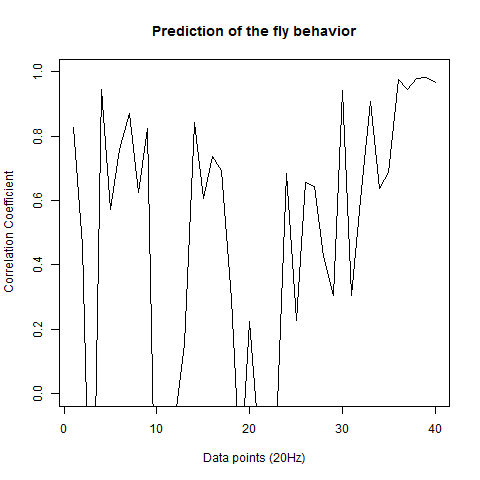
Category: R code, Spontaneous Behavior, strokelitude | No Comments
First tests of fly prediction under a mean of the flies on single data points
on Monday, February 8th, 2016 12:11 | by Christian Rohrsen
These were done the week before last one but I could not upload it last time, so here are they. These are the results for predicting 4-5 flies of each group. Just one prediction from the middle of the time series for the 40 data points ahead in the future. First group is c105;;c232>TNT.
This is c105;;c232 x WTB
This is UAS-TNT x WTB 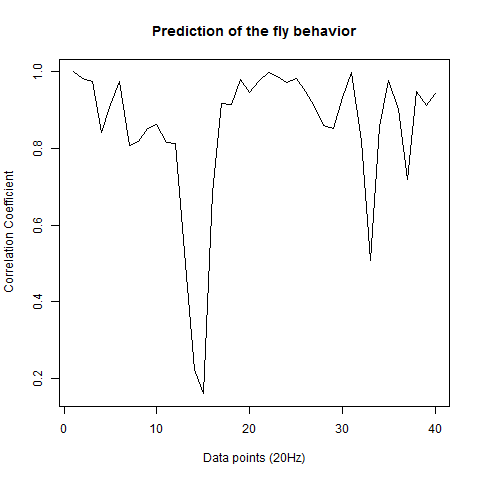
As I saw that the graph had so much zig-zag I told Pablo to make a bigger number of tested flies and this is what he is presenting today.
In addition I did analyze other parameters which are all saved under a PDF file below (Strokelitude). This contains some parameters with doubtfull processing which I still don´t trust so I have to find a better way for the calculation of it.
Category: R code, Spontaneous Behavior, strokelitude | No Comments
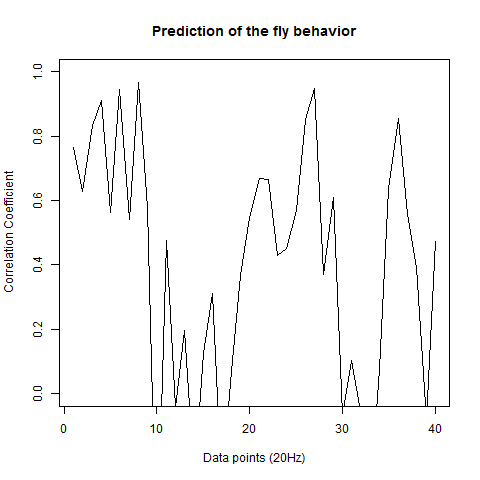
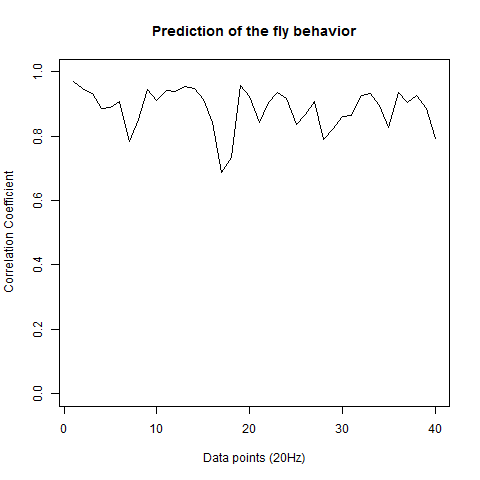
Data analysis of the prediction of wingstroke amplitude with 40 datapoints.
on Monday, February 8th, 2016 11:38 | by Pablo Martinez
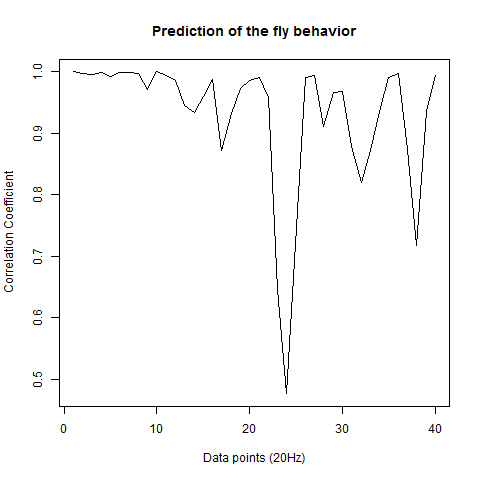
After we got the data of the behavior of the fly with strokelitude, we have made the analysis of 40 datapoints. Those datapoints were randomly picked in the middle of our dataset (10 minutes) and we made a second prediction, taking the points just before the end of the flight. For that we made a double correlation with those two predictions for each line and those are the results:
For the two control lines,
WTB x C105;;C232
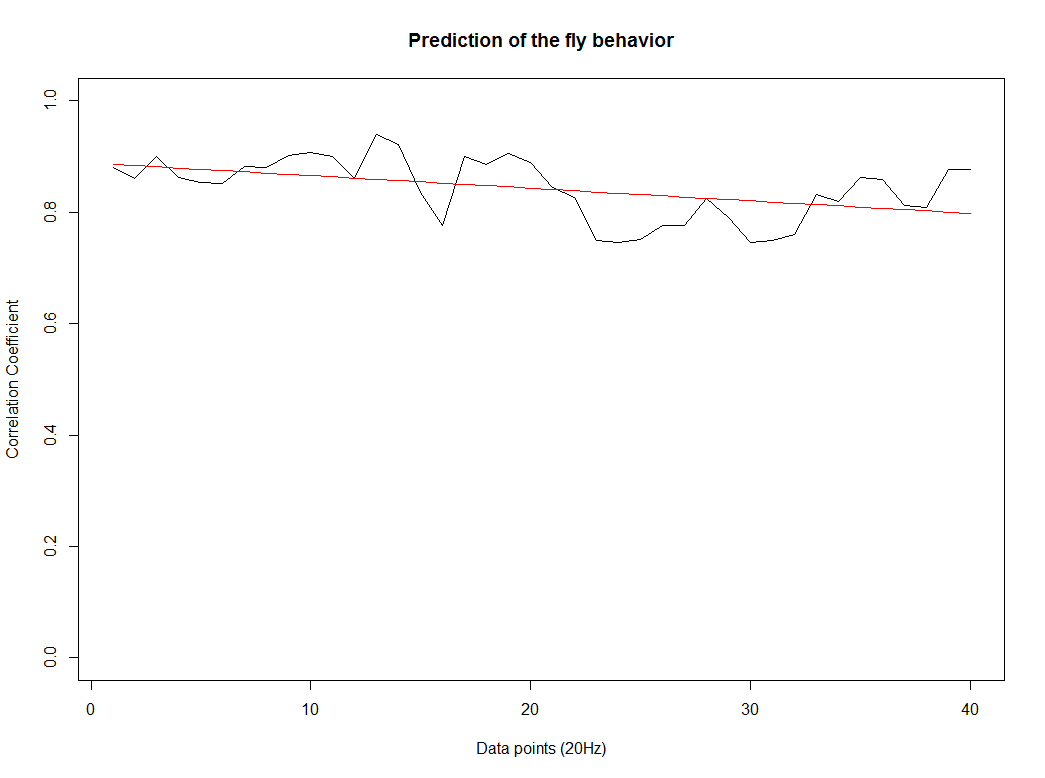
UAS-TNT-E x WTB
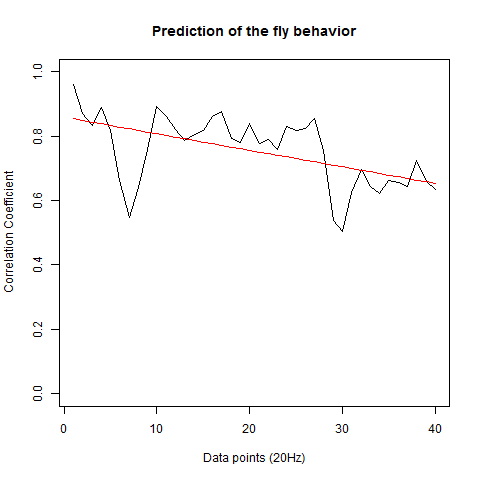
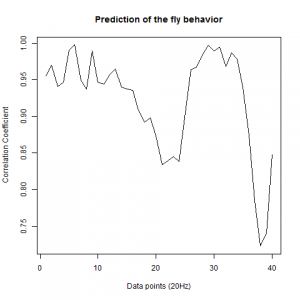
And for the experimental line (UAS-TNT-E x C105;;C232)
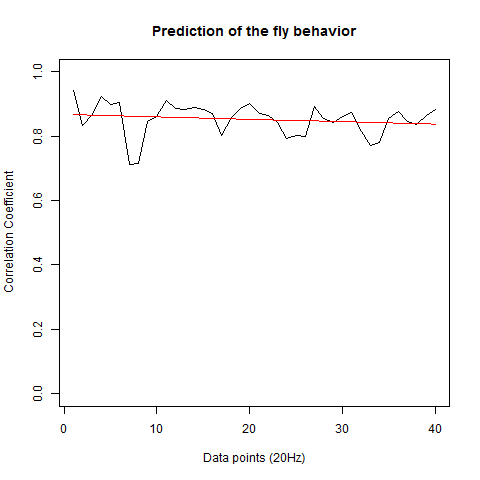
As long as the linear regresion decreases, more impredictable is the fly so its behave like non-linear function. The two controls are suposed to be more impredictable than the control line. There is more decrease in those two lines comparing to the experimental line, although is not too remarkable.
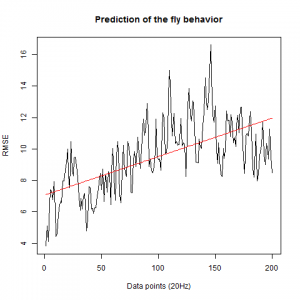
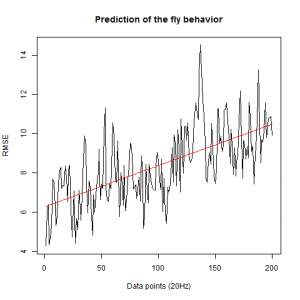
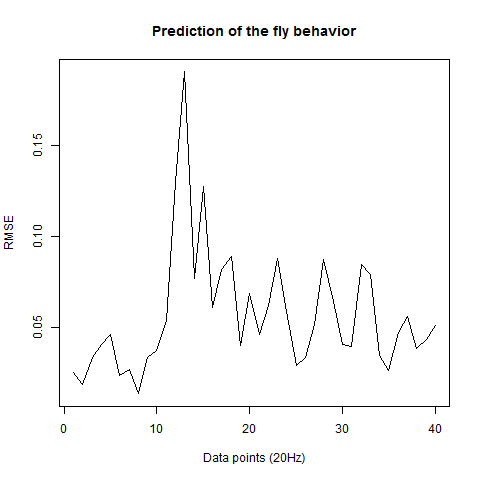
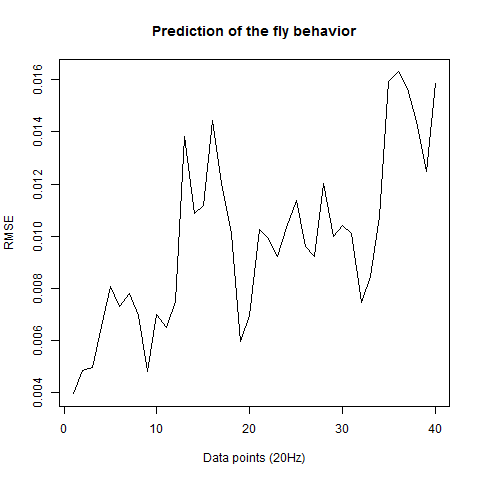
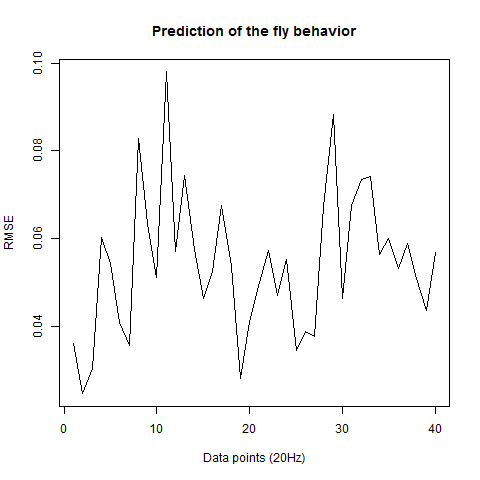
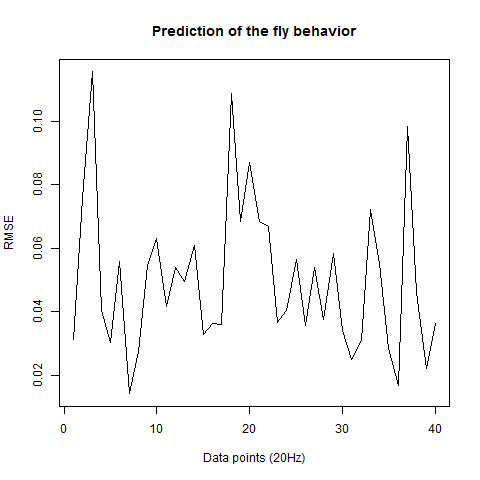
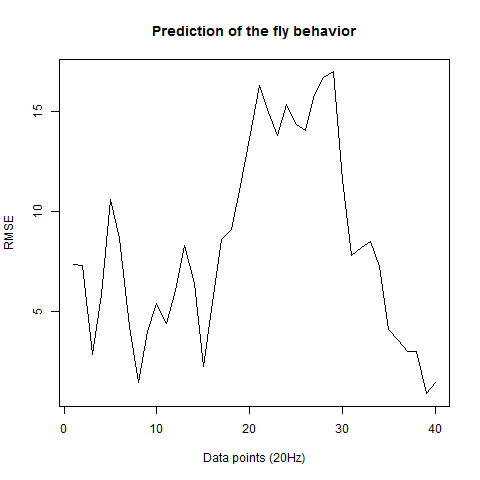
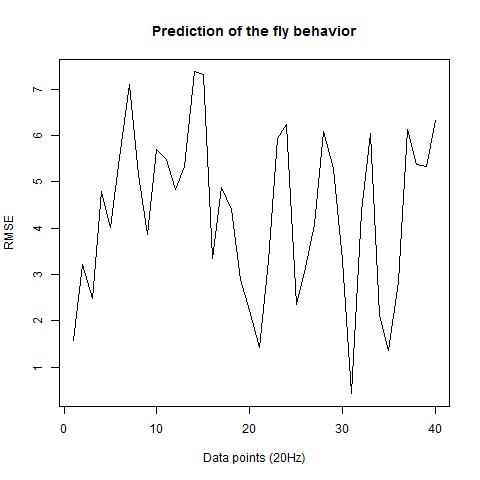
We also made an RMSE analysis, Christian explained it in his post. “RMSE measures just the differences of the absolute points whereas correlation coefficient is rather if the direction and degree of variation correlates (covariates)”
Here we have the plots:
WTB x C105;;C232(control)
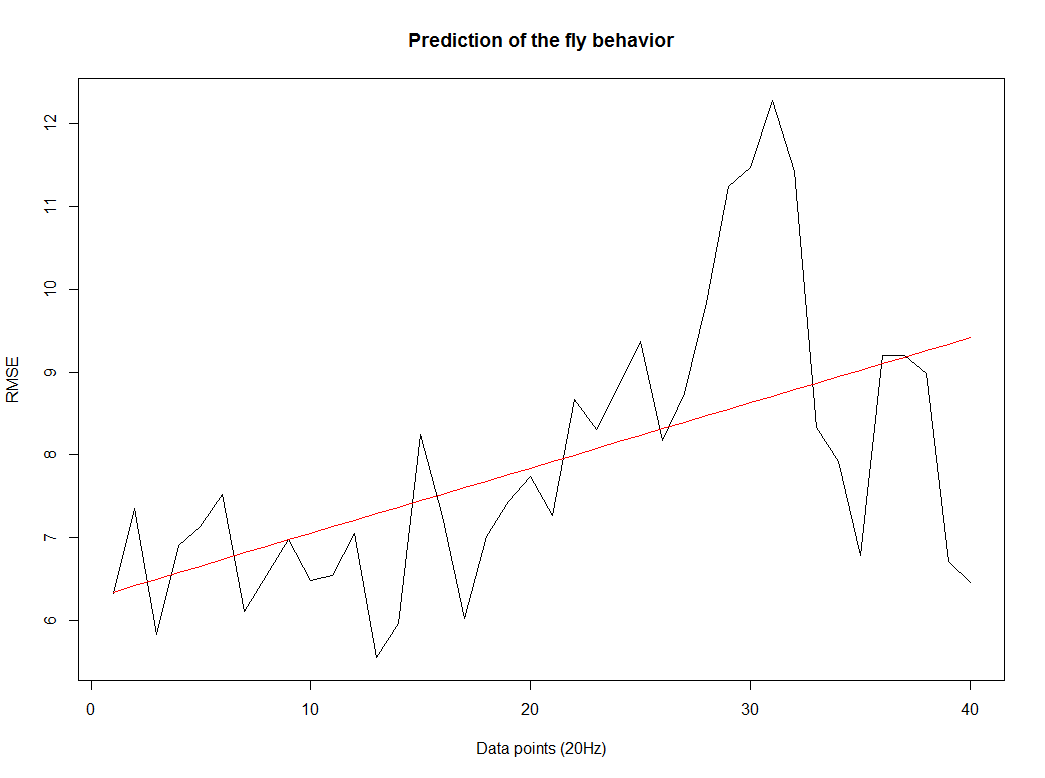
UAS-TNT-E x WTB(control)
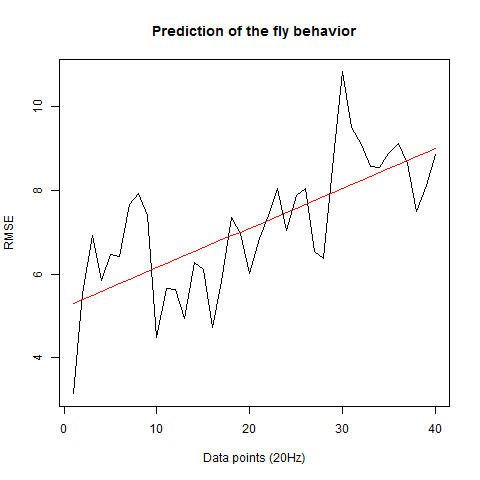
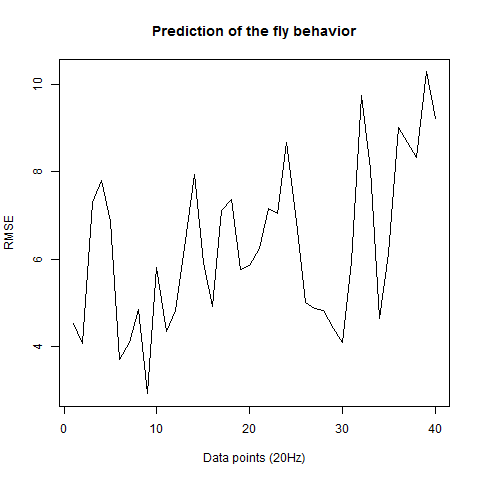
experimental line (UAS-TNT-E x C105;;C232)
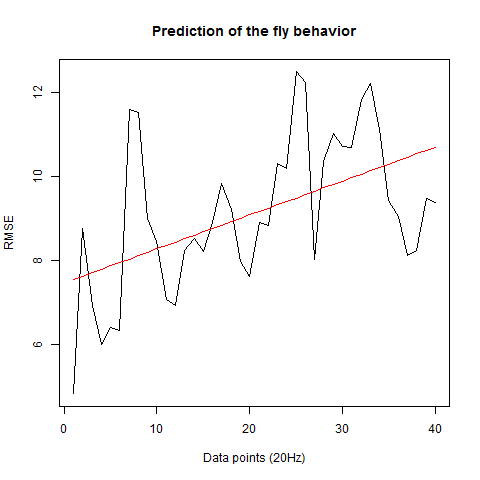
As long as the linear regresion increases, the absolute points differ from the prediction and the normal trace.
Category: Spontaneous Behavior, strokelitude, Uncategorized | No Comments
Prediction analysis
on Sunday, January 17th, 2016 7:02 | by Christian Rohrsen
These are just 5 flies (WTBxTNT) from the strokelitude where I measured the correlation coefficient on the Y-axis. In the X-axis, first bin is from 0-2 s of prediction, second is 2-4s and so on.
It seems as if some flies do nicer than others. Although it seems to me that a correlation coefficient from 0.3 isnt a big thing with all this variability. I have to find out the best binning though, I think it needs to be much more in the short term.
When I do the mean of the 5 flies measured, I do see a very slight decay. But once more I would say the decay is from the bin 1 to the second.
Here I tried another way, the RMSE, which according to literature and to my own reasoning should be a better analysis. I think RMSE measures just the differences of the absolute points whereas correlation coefficient is rather if the direction and degree of variation correlates (covariates). I find a very weird result. The fit is bad, the it gets better (but it should be just a chance event because correl coef decreases) and then it get very bad and so on.
I think for the future I have to make ensembles of two k neighbours maybe, which seem to increase the prediction power 10-15%. And maybe not look that much into the future as it was done here (10s).
Here some examples of predictions vs observations:
Category: R code, Spontaneous Behavior, strokelitude, Uncategorized, WingStroke | 1 Comment
Measuring Wingstroke Amplitude with Strokelitude (V)
on Monday, December 14th, 2015 2:42 | by Pablo Martinez
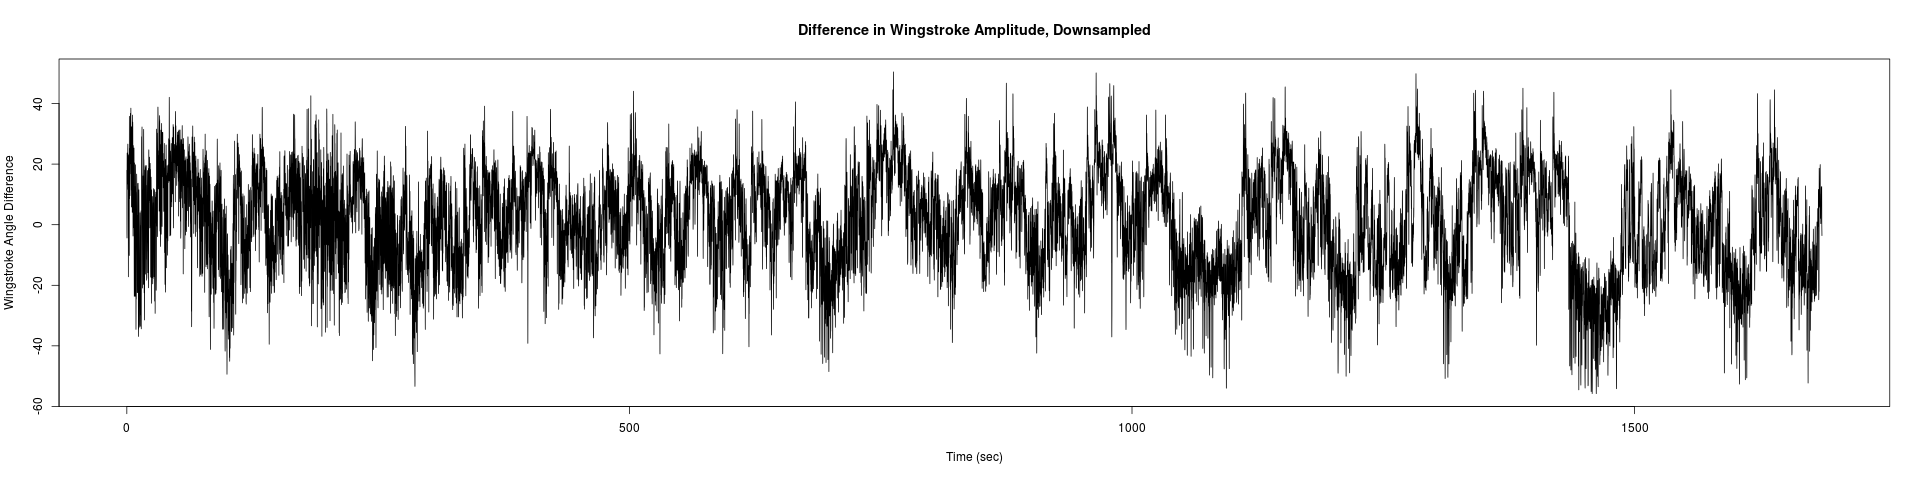
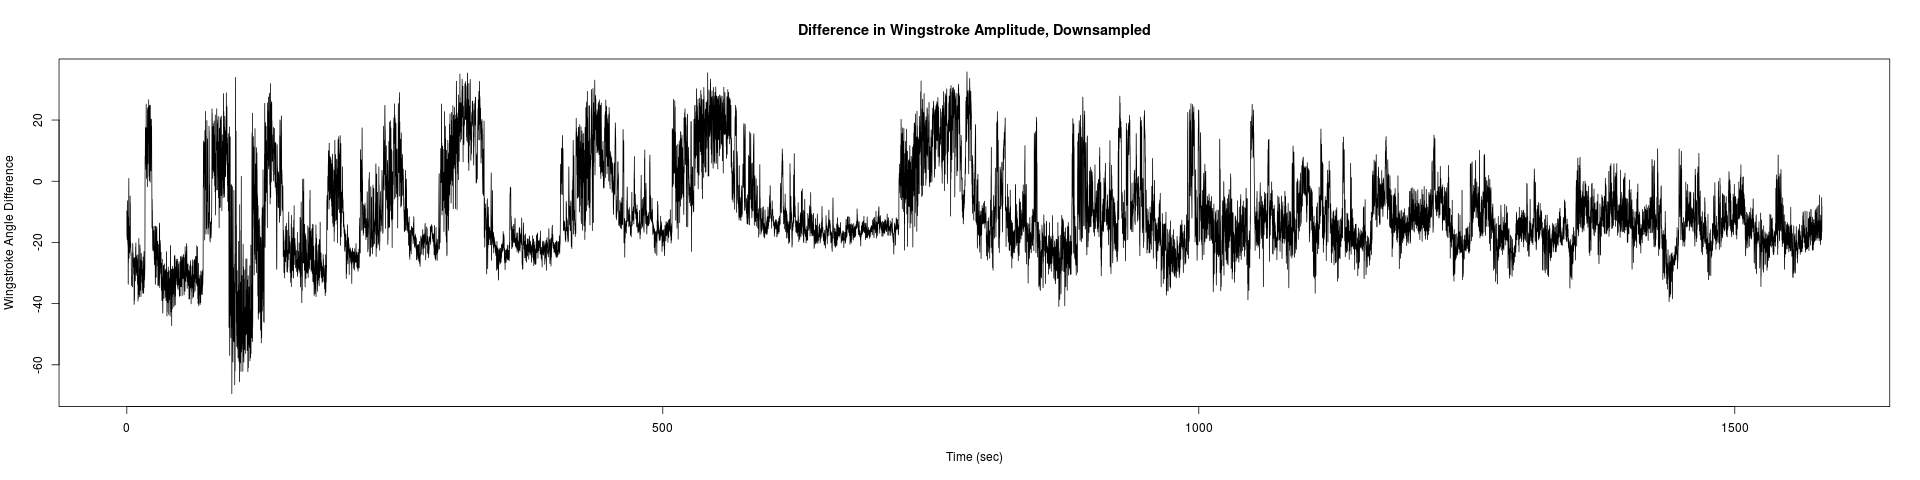
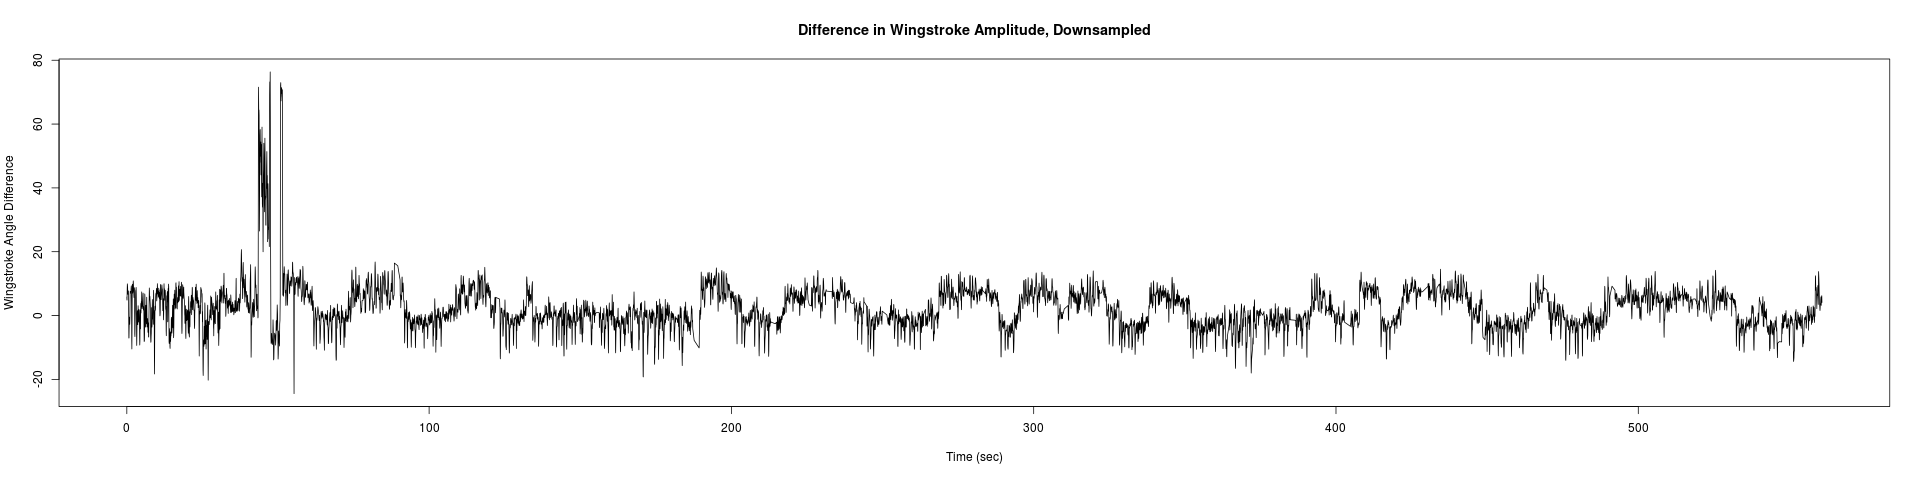
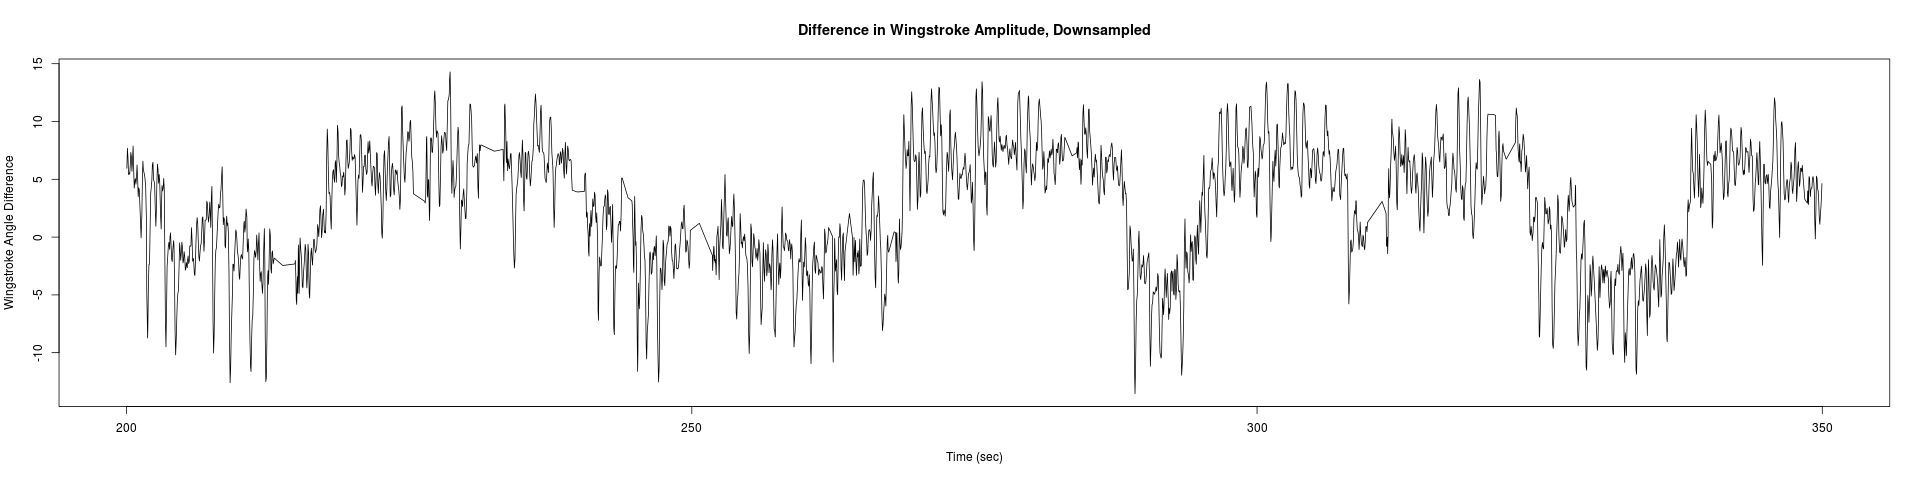
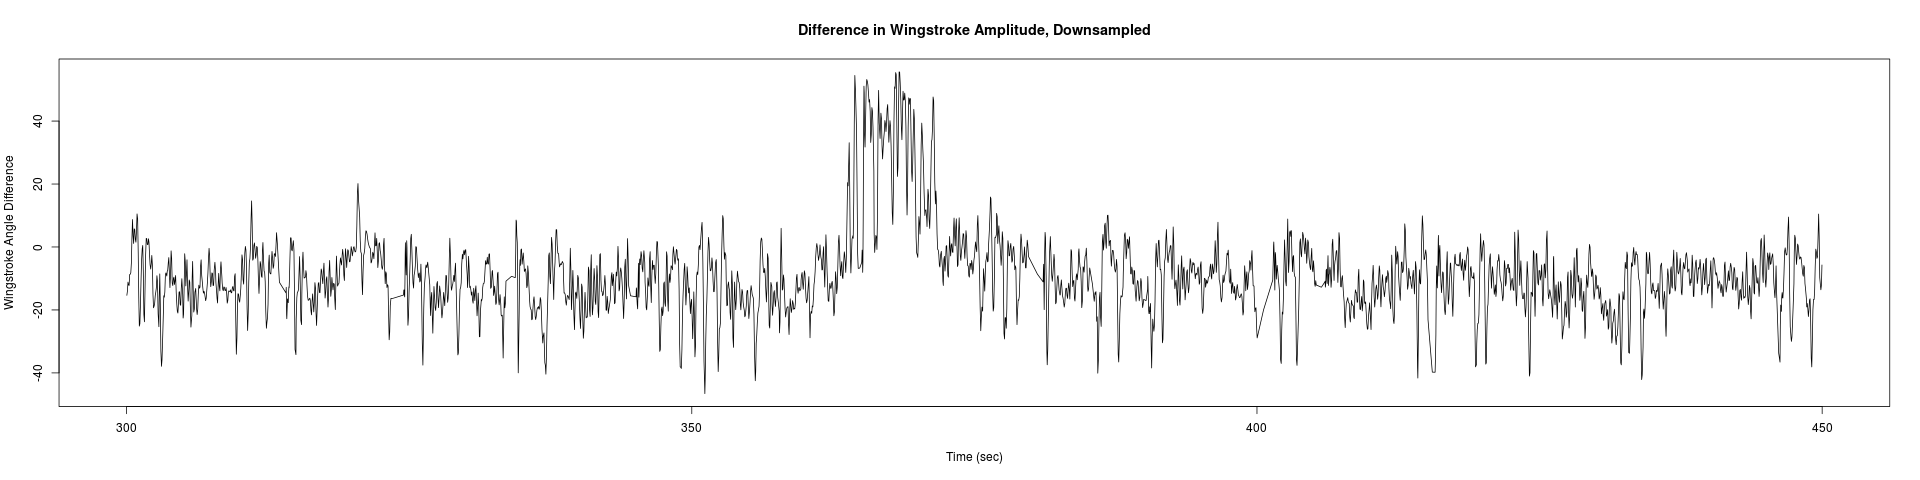
For a further data analysis, we should have a minimum number of samples. During the last week, I have been measuring the wingstroke amplitude of the flies, to get at least 10 samples of each one(two controls and the experimental line). Here three examples of the different lines:
Males WTB x C105;;C232 (control)
Males UAS-TNT-E x C105;;C232
Males UAS-TNT-E x WTB (control)
Category: flight, Spontaneous Behavior, strokelitude, WingStroke | No Comments
Measuring Wingstroke Amplitude with Strokelitude (IV)
on Monday, December 7th, 2015 2:56 | by Pablo Martinez
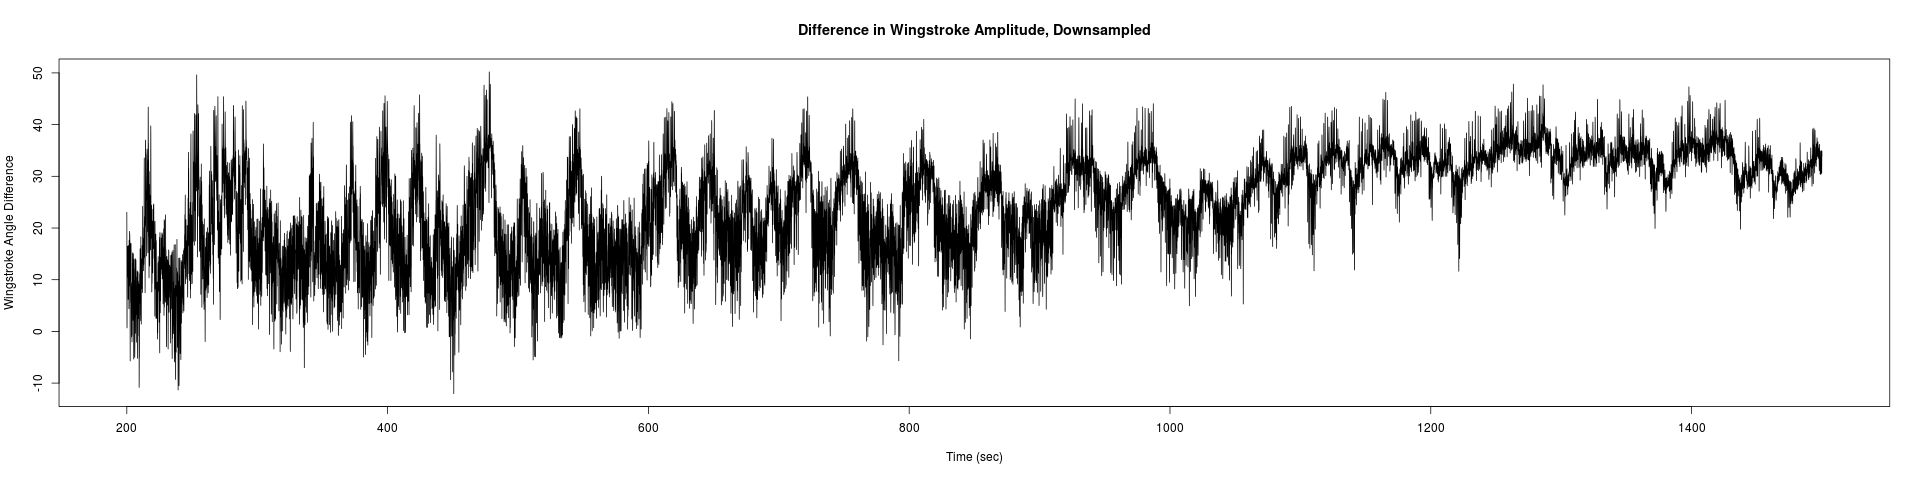
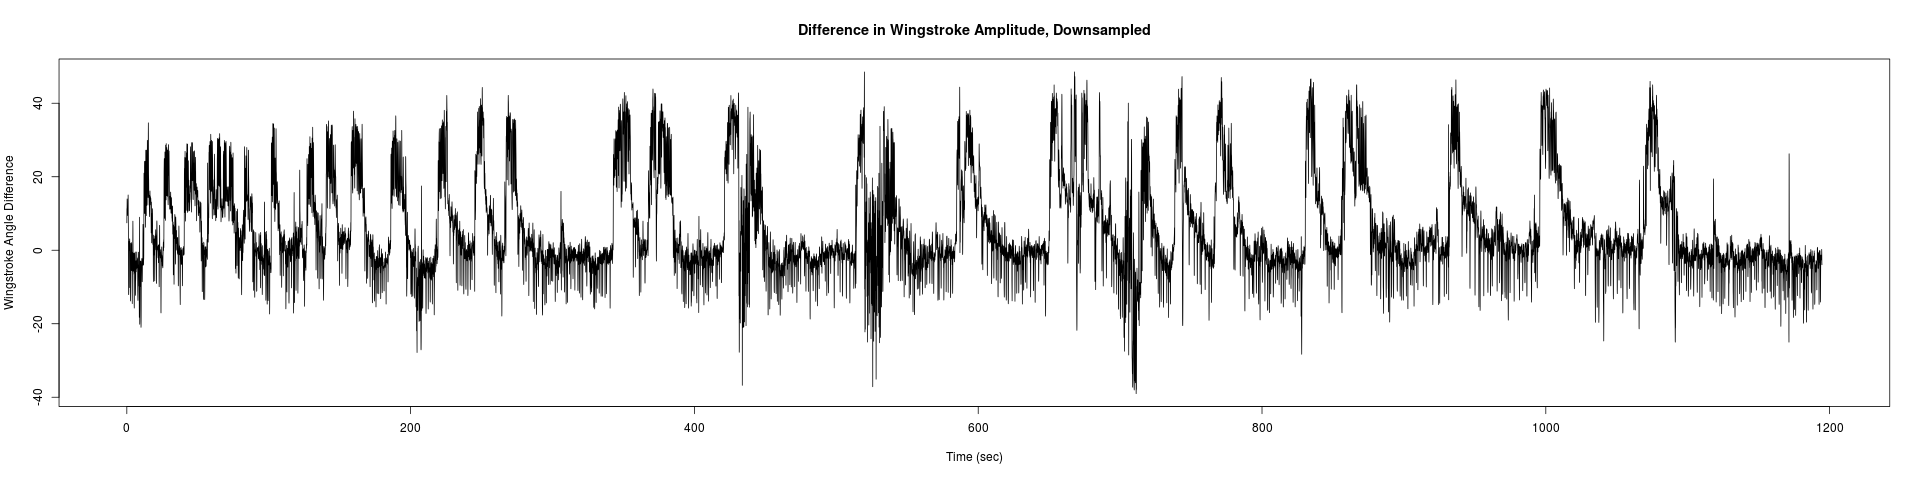
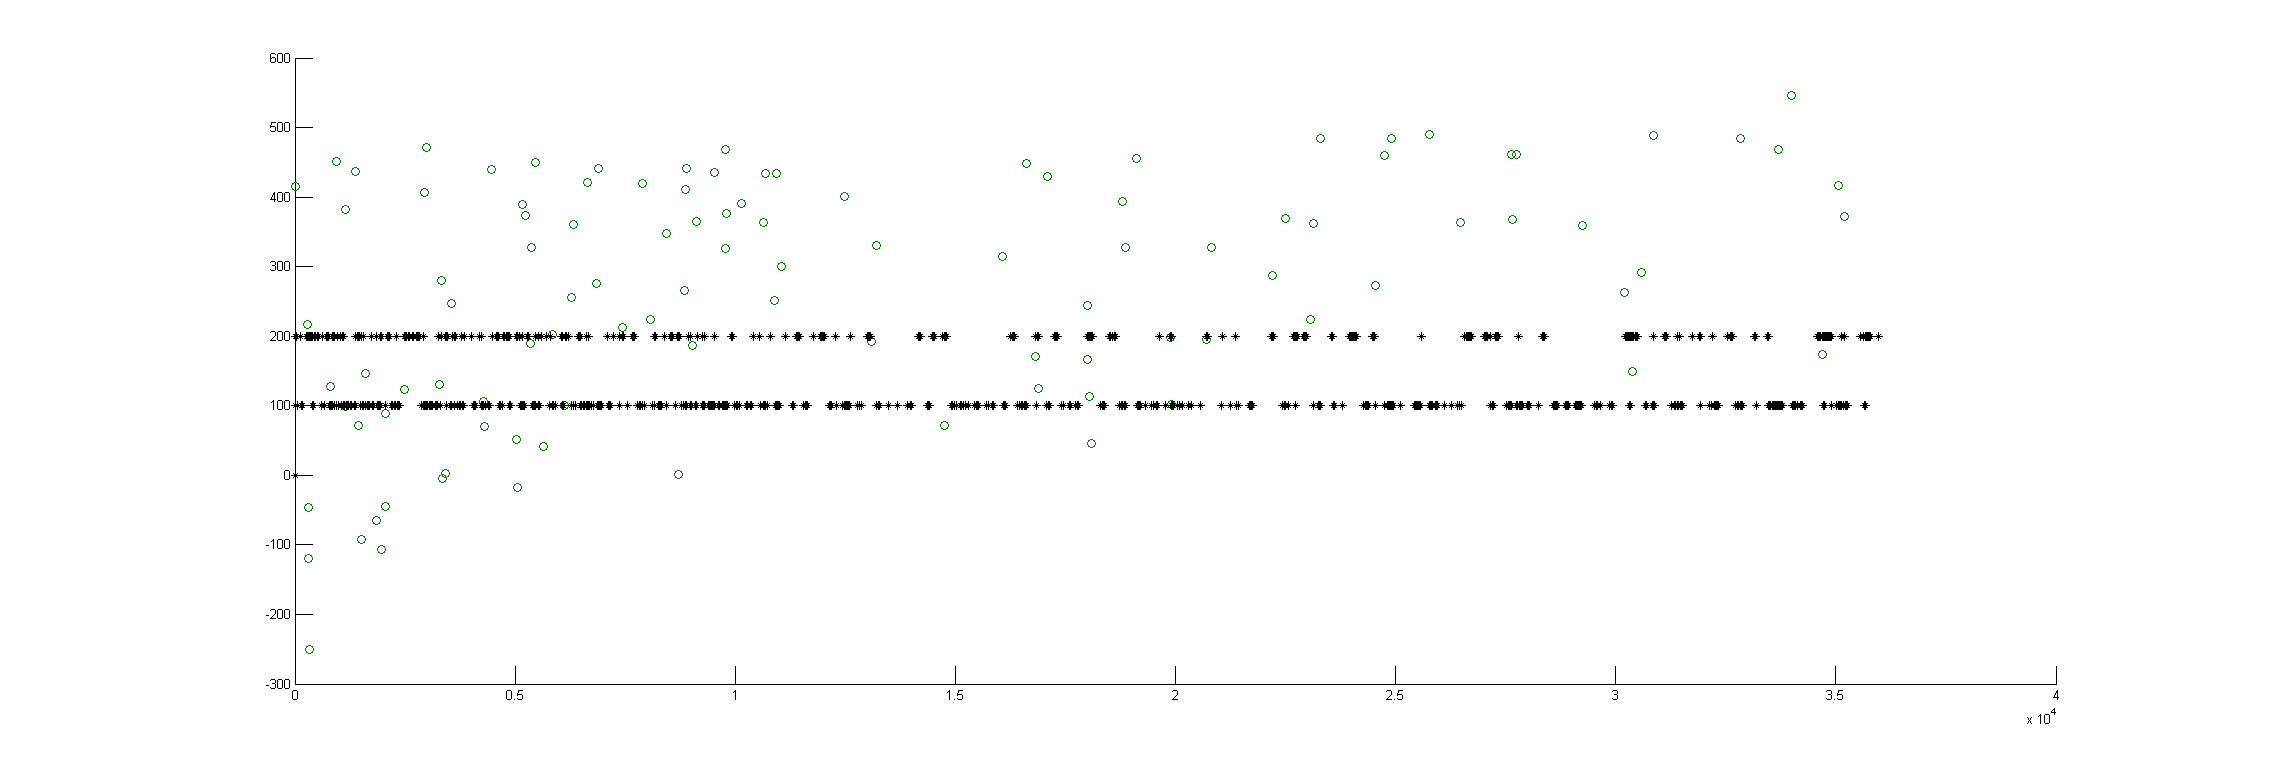
After getting good results in the measurement of the wingstroke, and solving problems with the sampling intervals (image below). I have started to measure flies for the experiments.
The time between samples was different depending on the background programs running on the background:
Figure 1
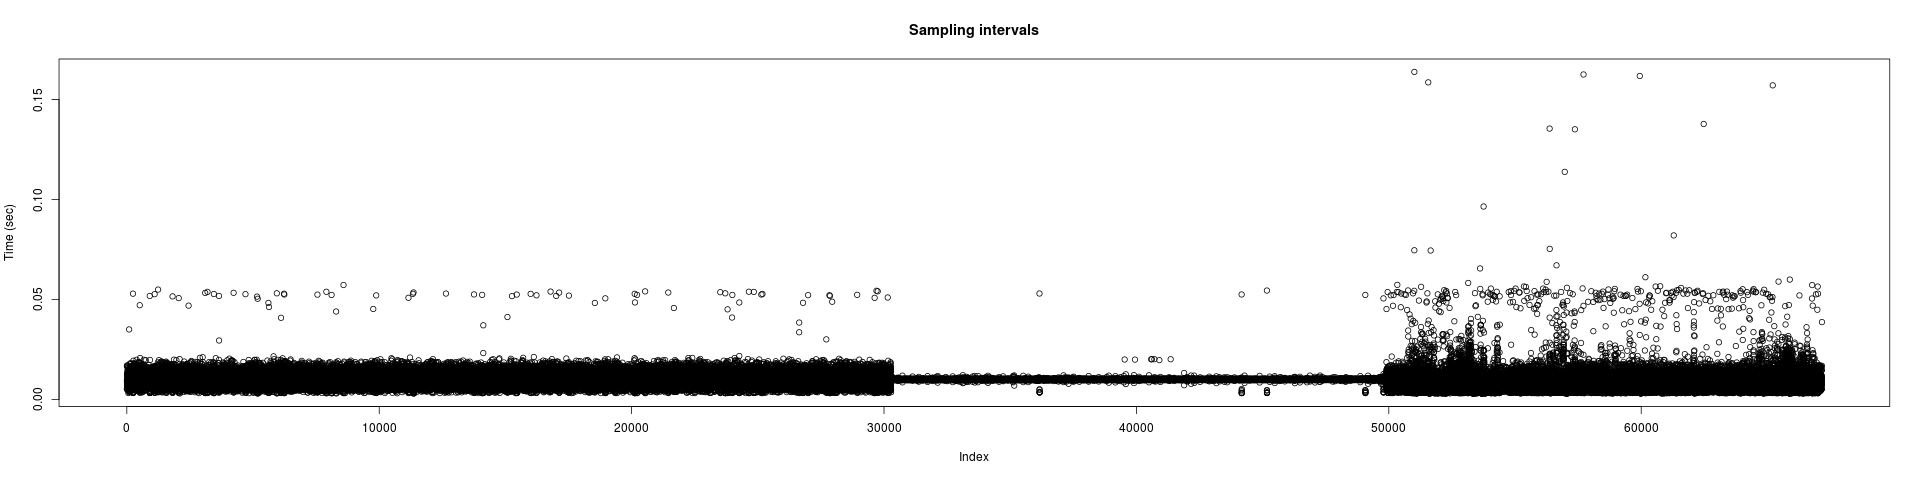
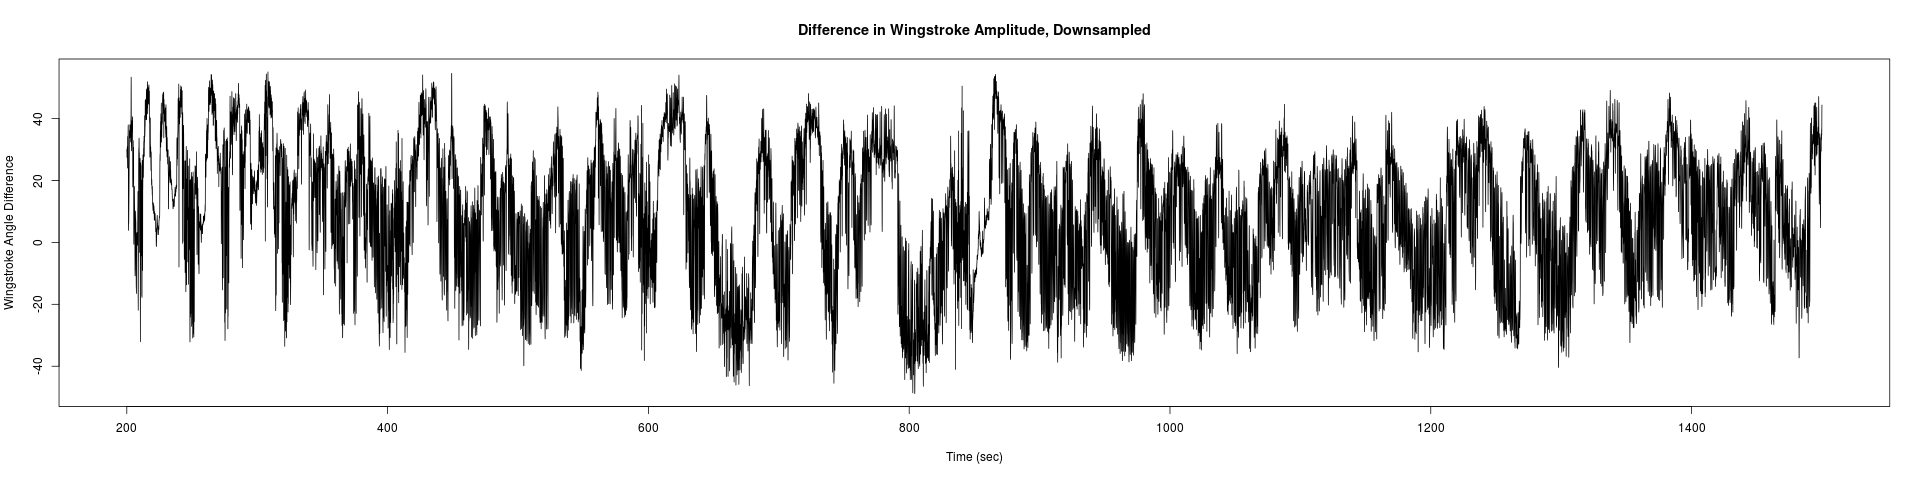
More differences in time within samples when more programs are running at the same time as strokelitude (3nd 1/3 of the plot), when just the display of the camera is running( 1st 1/3 of the plot), and everything shut down(2nd 1/3 of the plot).
The differences among sampling intervals was bigger but with an adjustment of the data, Christian Rohrsen managed to changed. The time between two samples could arise until 1.7 seconds and with the correlation, the time is not bigger than 0.05 seconds.
The strains of flies used fore the experiments are:
UAS-TNT-E, that express the tetanus toxin in the neural cells, using GAL4 system. Being Used as a control.
c105;;c232, that contains a promotor region to express the toxin. Being used as a control.
And the cross between both to have the expression of the tetanus toxin.
Some data from the control flies (UAS-TNT-E):
And some data of the spikes:
Category: flight, Spontaneous Behavior, strokelitude, WingStroke | No Comments
Interpolations and Spike analysis
on Monday, December 7th, 2015 2:42 | by Christian Rohrsen
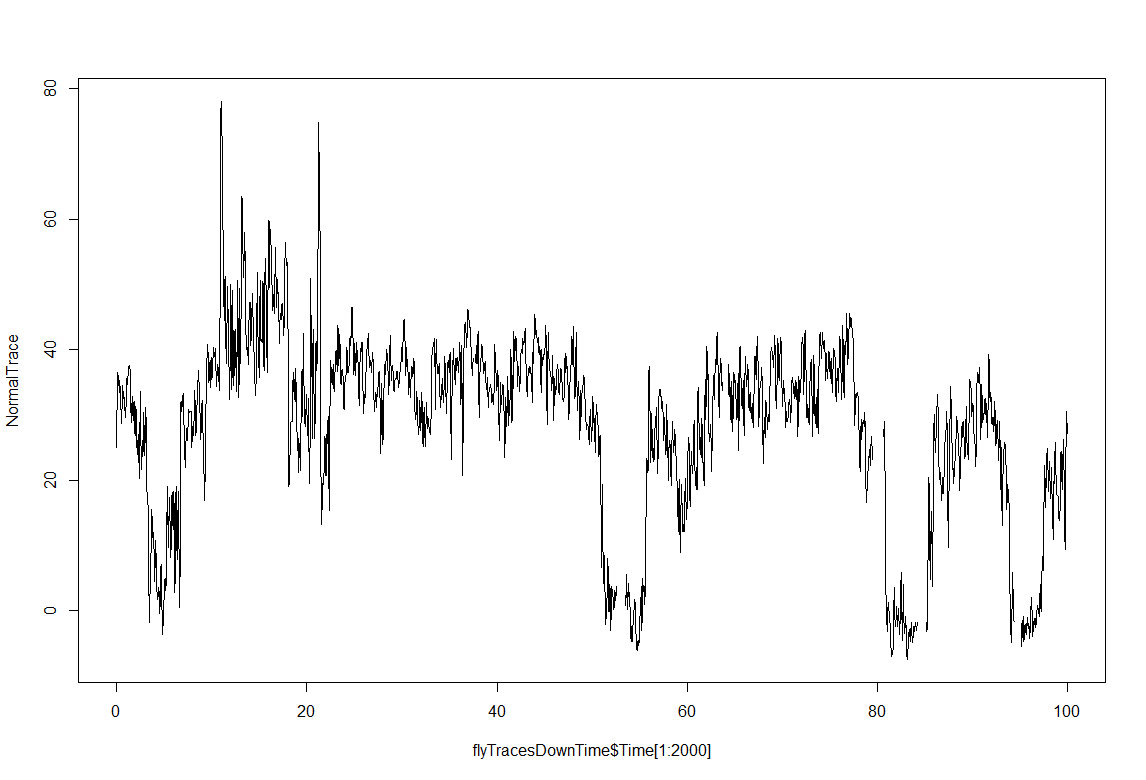
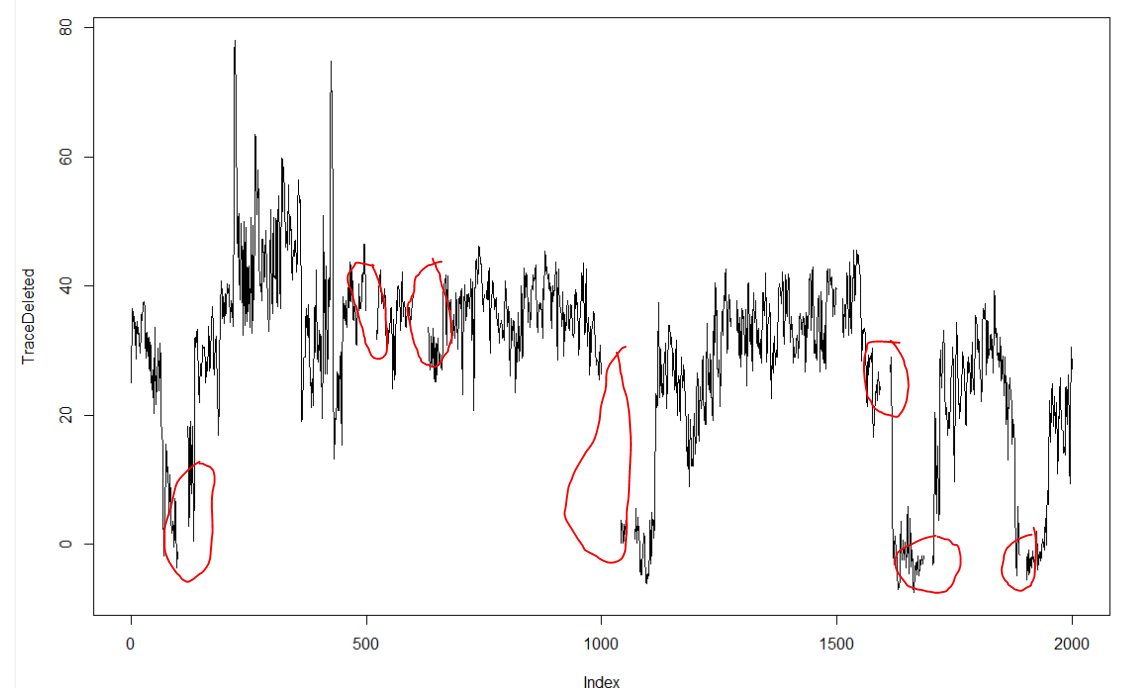
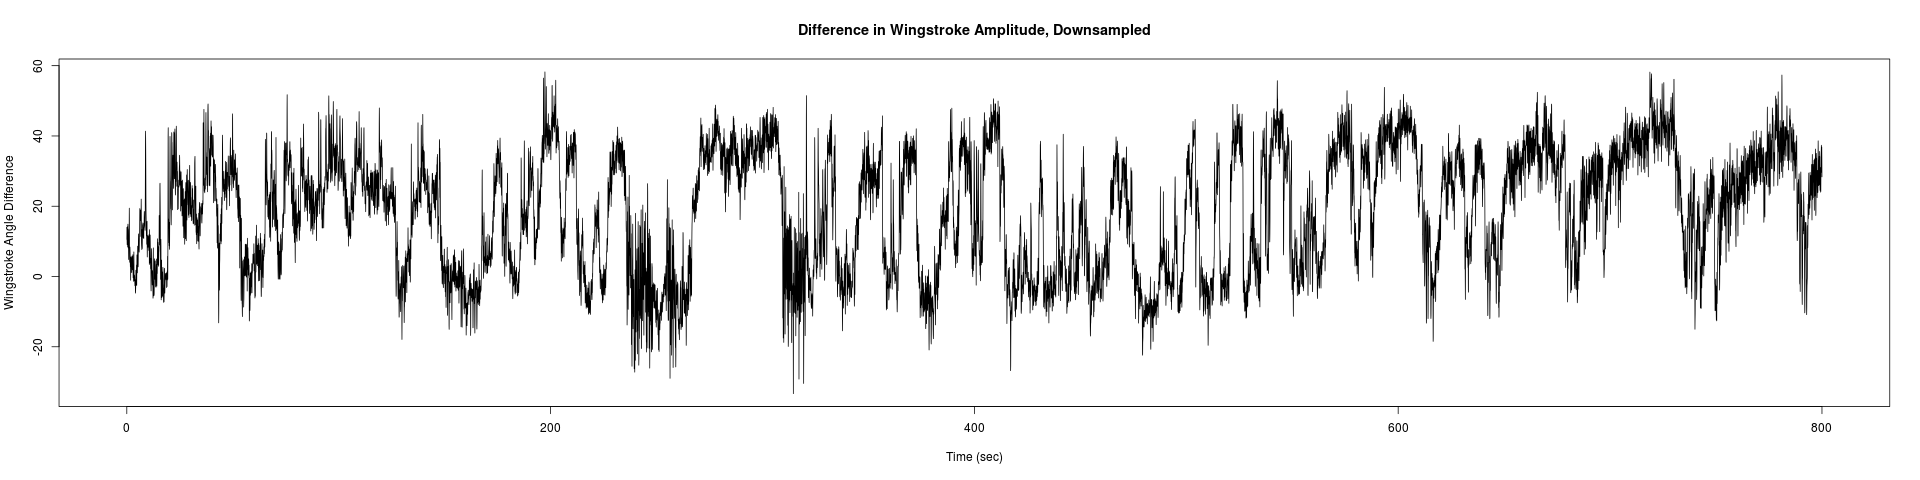
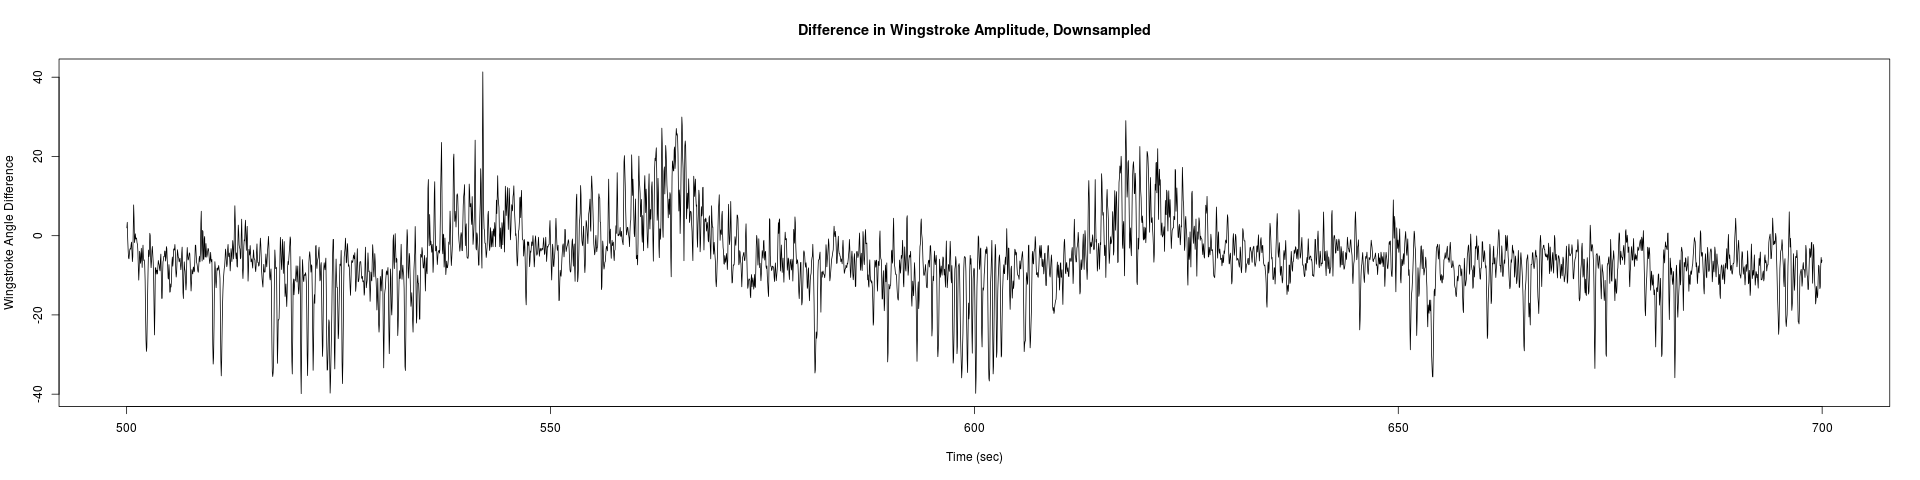
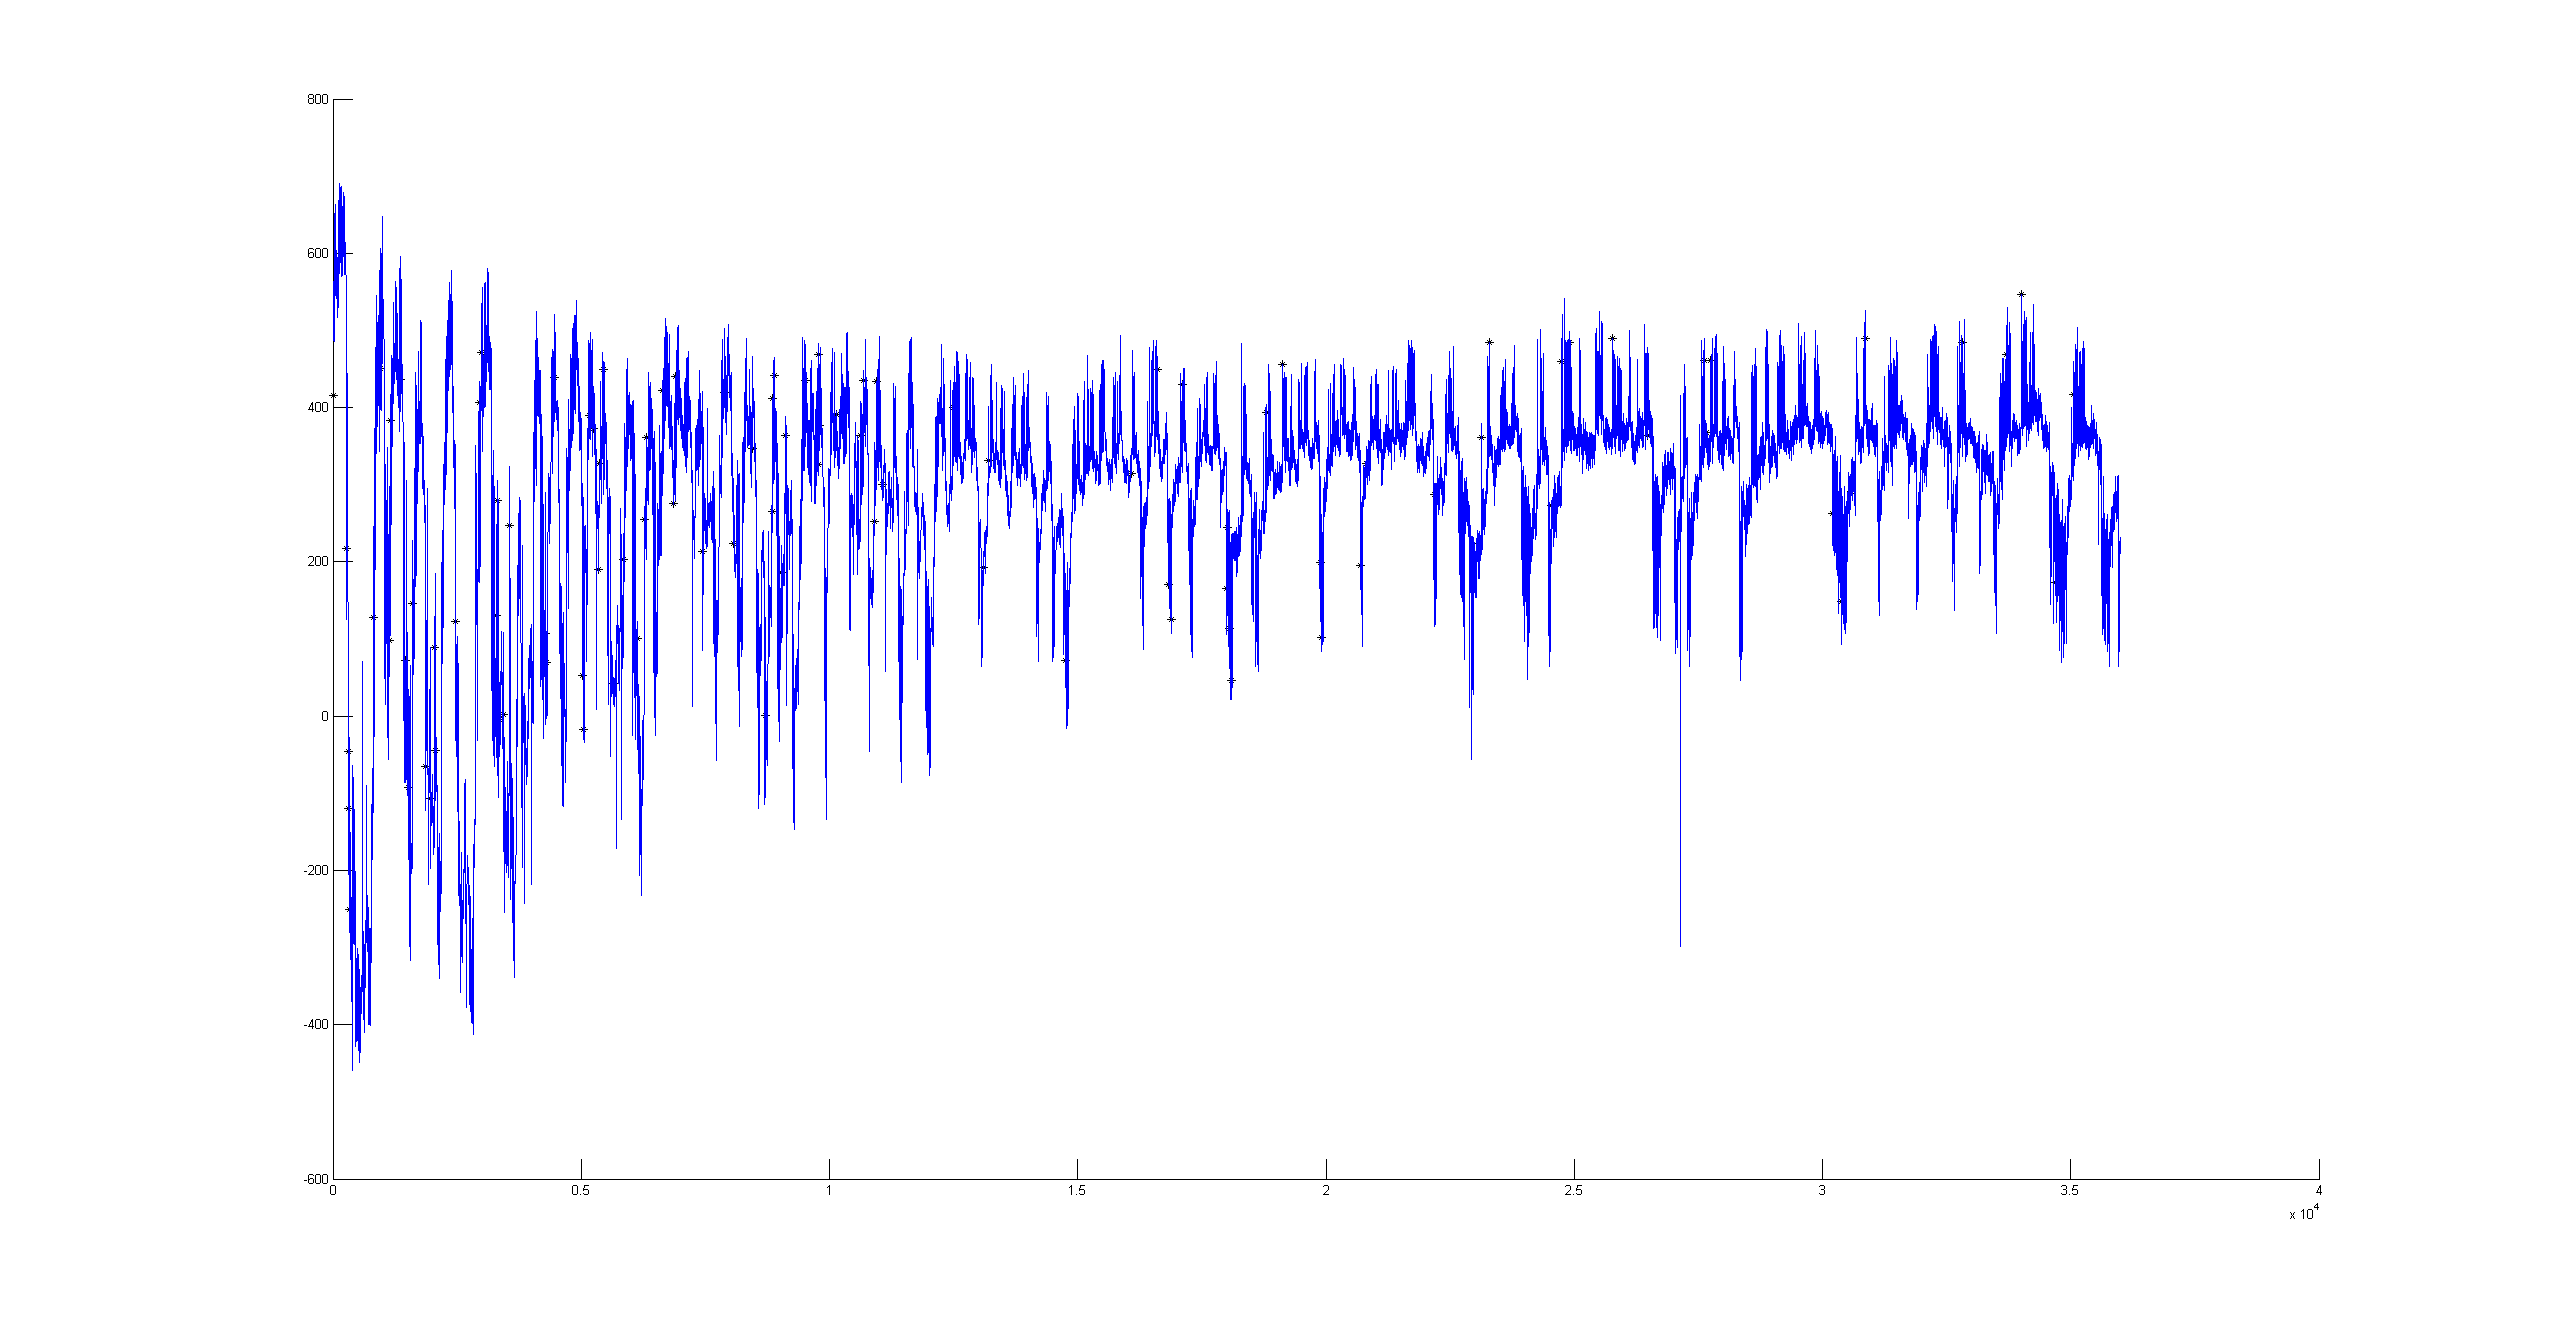
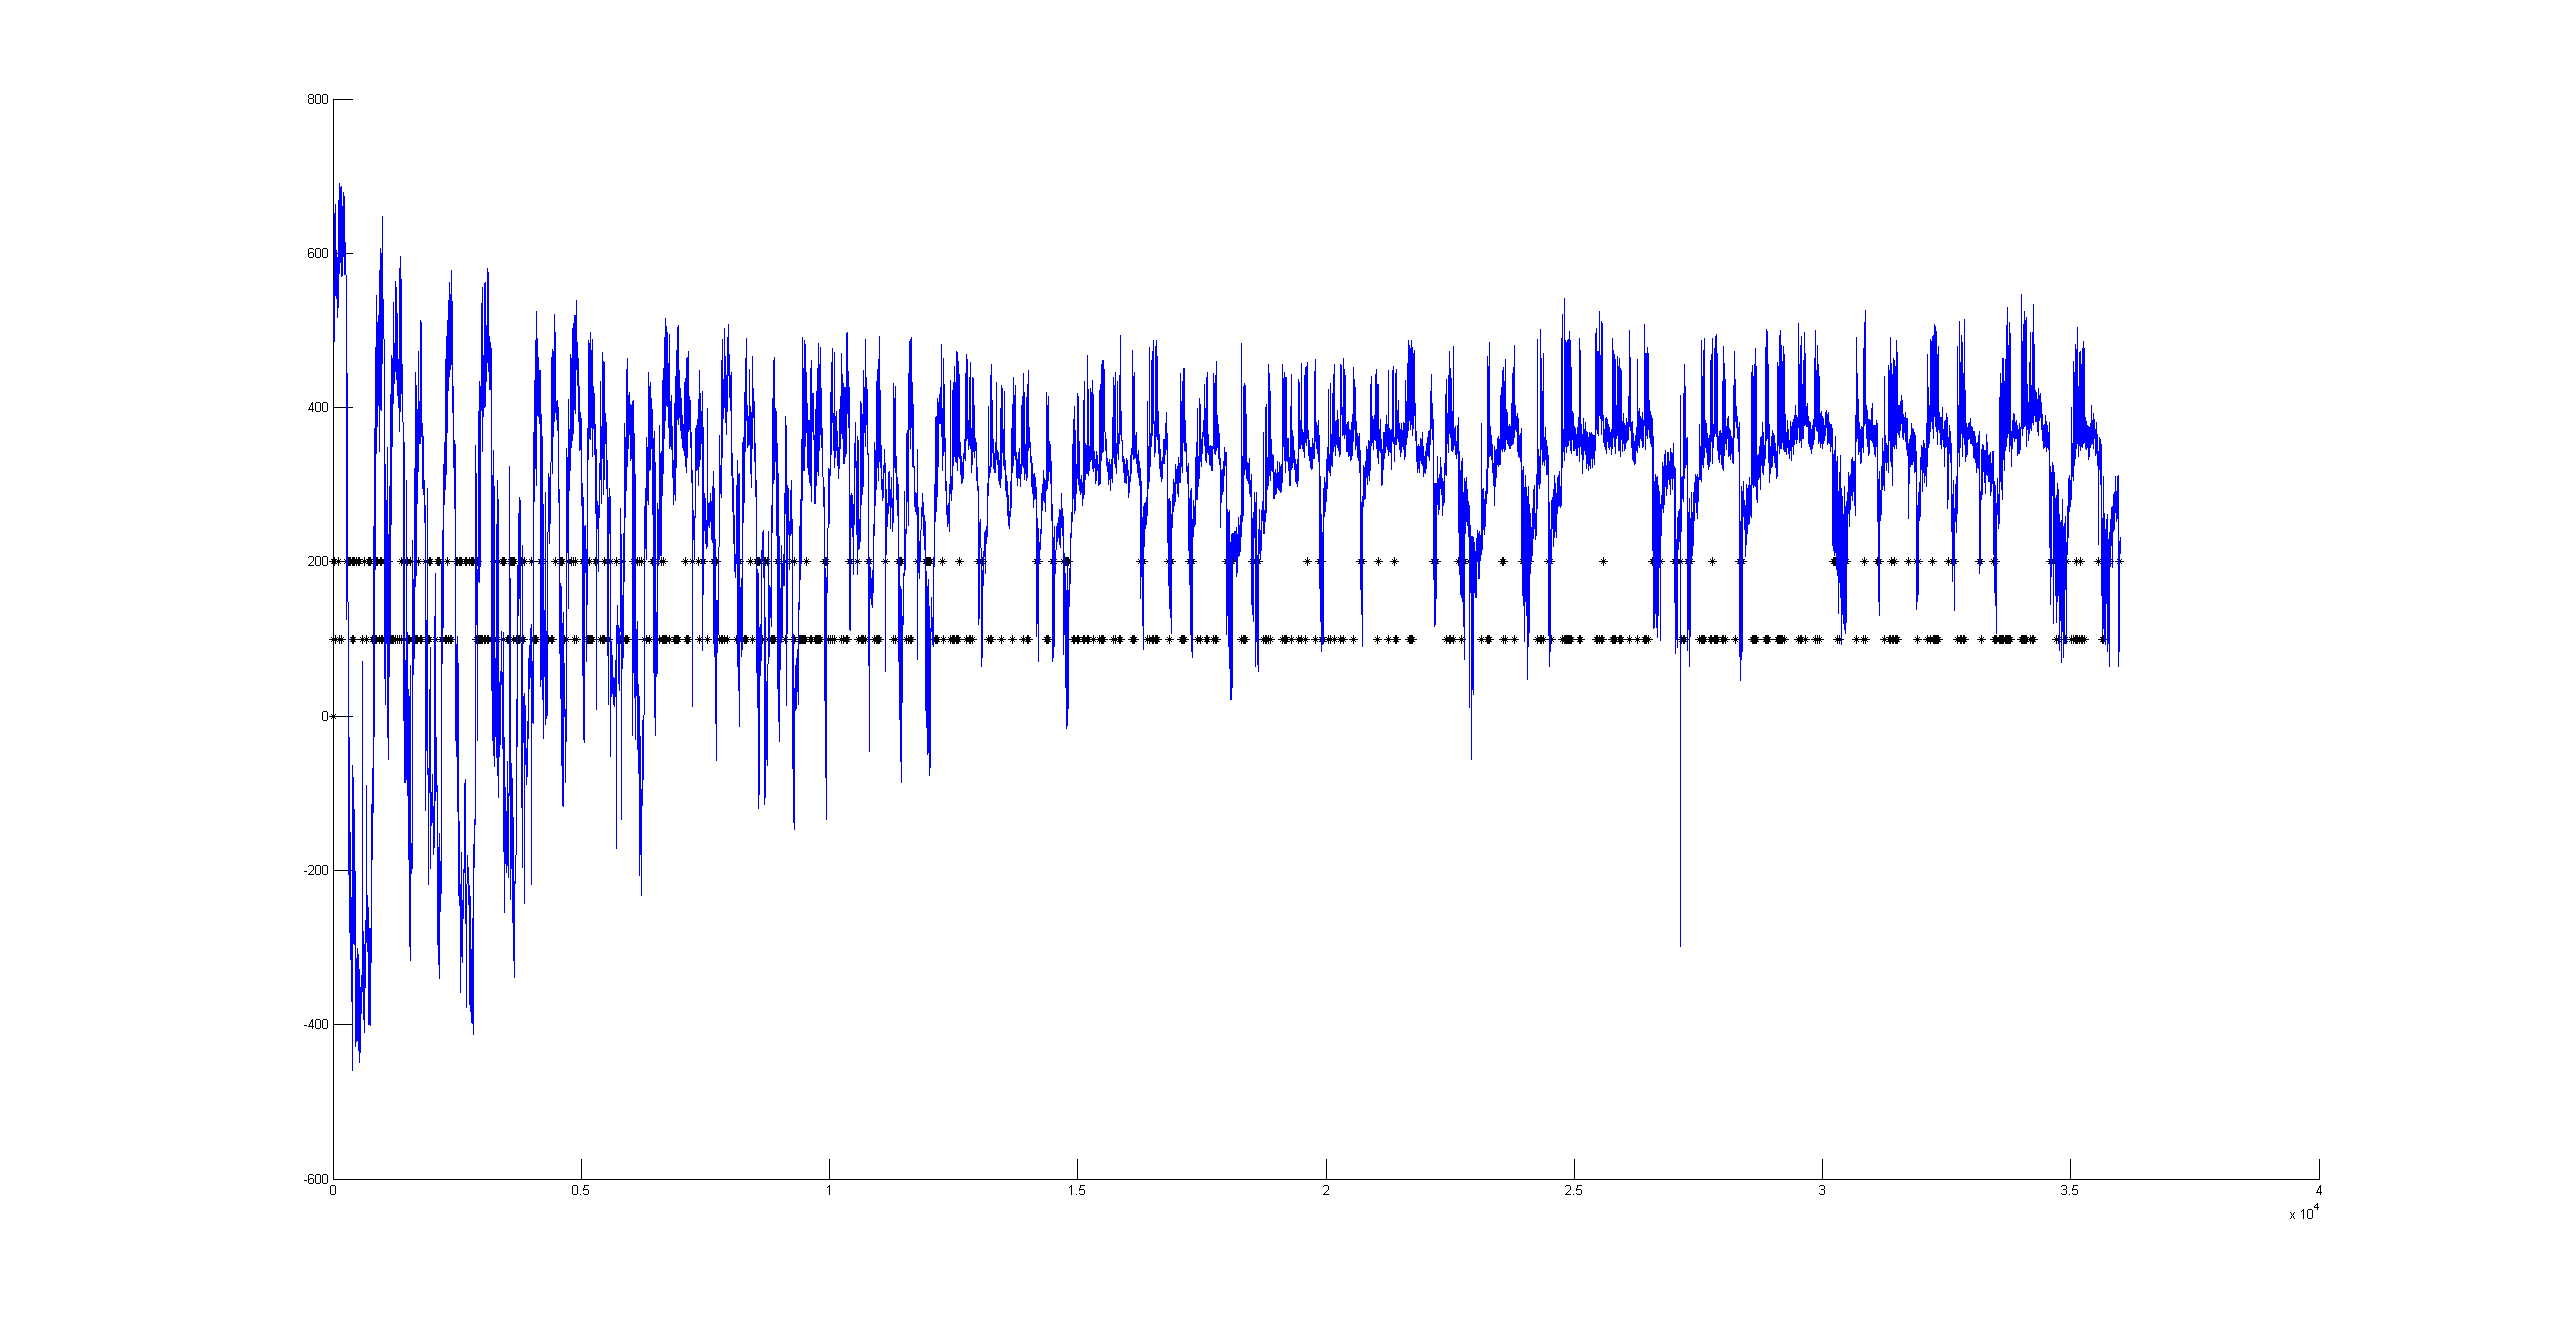
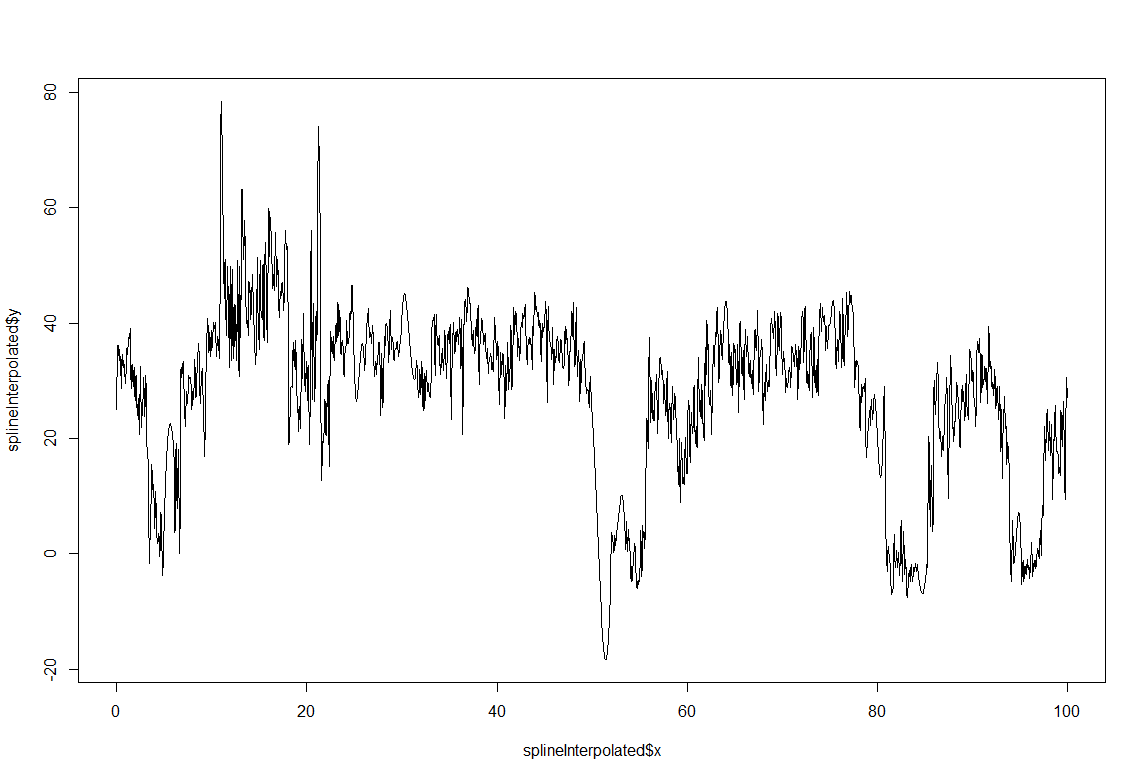 This is just a proof of concept how useful the interpolation is for this purpose: and I would say it´s almost useless. If I delete from the raw data (1st graph) some pieces (2nd graph), and I make a spline interpolation (3rd graph) it doesn´t match that well. Linear interpolation was done in previous weeks with not much of a success. Anyway, the result of a linear interpolation can be imagined by eye just by joinning the two ends with a straight line, and this doesn´t occur in the fly behavior as we can see in the raw data (1st graph).
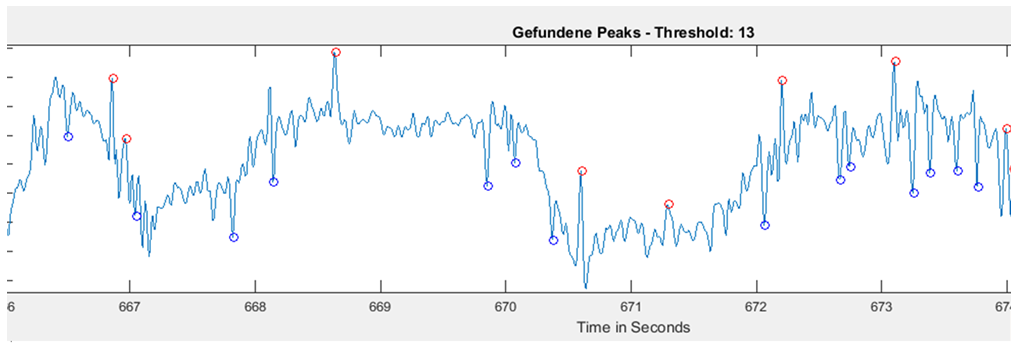
 There could be two posibilities for spike detection: one is the one from Ute and the other one is the one from Maye. It seems to me that the one from Maye is more precise. I have run the script but I do not get so many spike detections as he gets. I did try several thresholds for spike detection and doesn´t change very much. So I have to work more on it to see what is really the important factor for a proper spike detection
Category: flight, R code, Spontaneous Behavior, strokelitude, WingStroke | No Comments
Measuring Wingstroke Amplitude with Strokelitude (III)
on Monday, November 23rd, 2015 2:59 | by Pablo Martinez
After the measurements of this week, I get better results in the trace of the fly;
(1)
With the corresponding trace exerpt with the spikes of the figure above (1)
(1)
and two more from other flies:
Category: Spontaneous Behavior, strokelitude, WingStroke | No Comments