Strokelitude – Final Work
on Monday, April 15th, 2019 2:41 | by Miroslav Stojic
Final Stats (flew more than 8min/out of):
– Wild type: 14/17 (82%)
– ElavGal4 x UAS-Ryr 28919: 3/13 (23%)
– ElavGal4 x UAS-Ryr 65885: 13/100 (13%)
Wild Types:
ElavGal4 x UASRyR 65885

Category: Spontaneous Behavior, strokelitude, WingStroke | No Comments
Strokelitude – New Findings and Recordings (1.-7. Apr.)
on Monday, April 8th, 2019 1:14 | by Miroslav Stojic
Last week (1.-7.Apr 2019) we noted how many flies want to fly more than 8 min and here is the result (only the ones we noted):
– Wild type: 8/9 (88%)
– ElavGal4 x UAS-Ryr 28919: 3/12 (25%)
– ElavGal4 x UAS-Ryr 65885: 6/35 (17%)
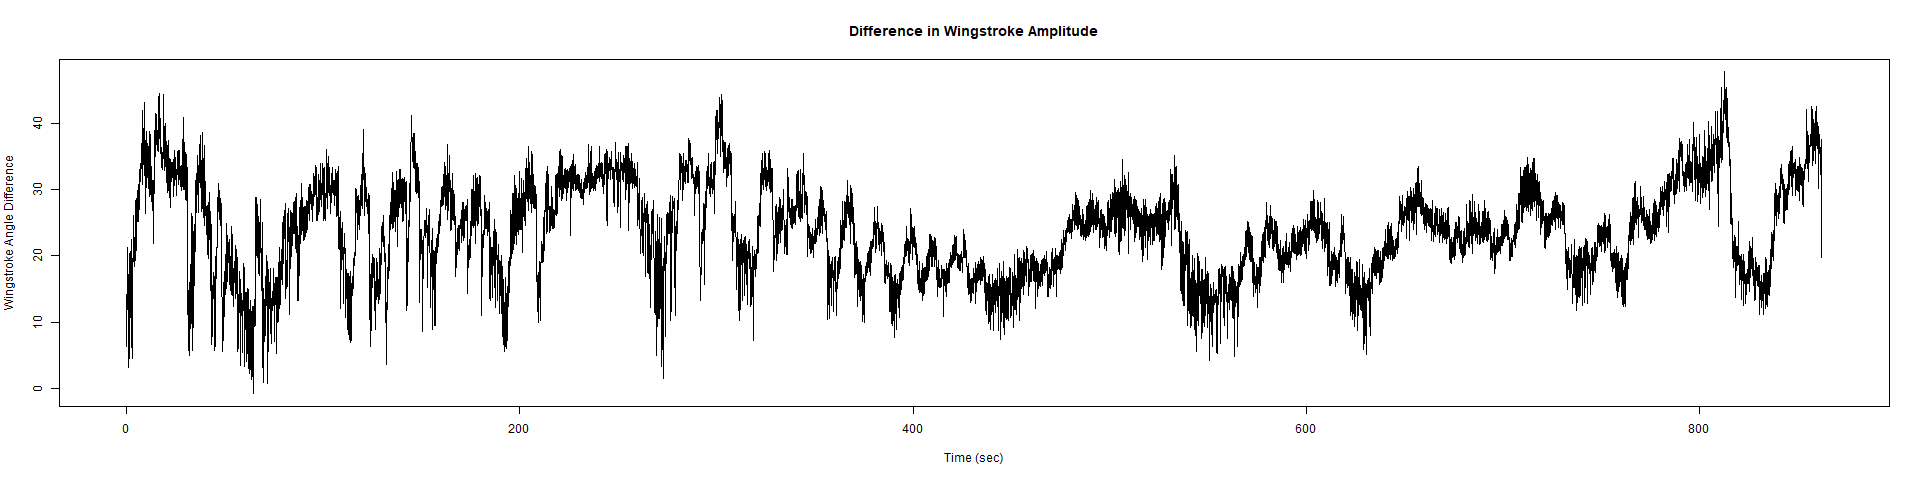
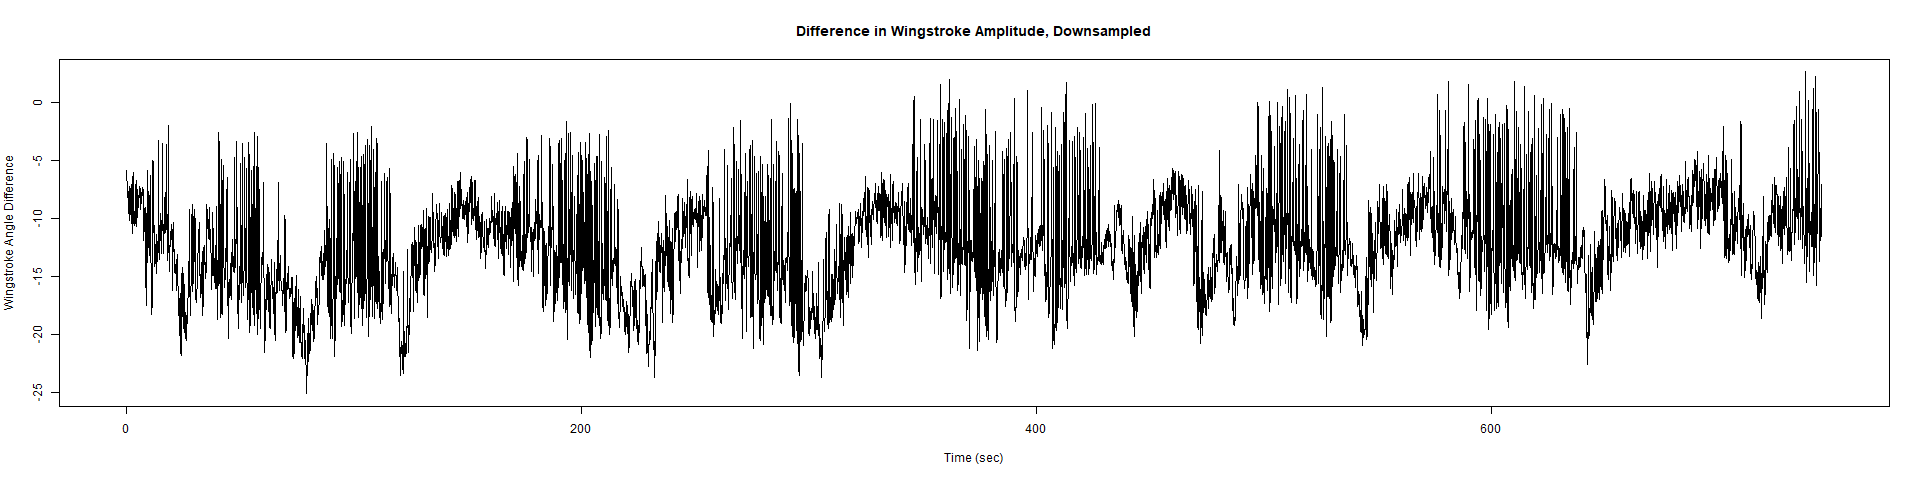
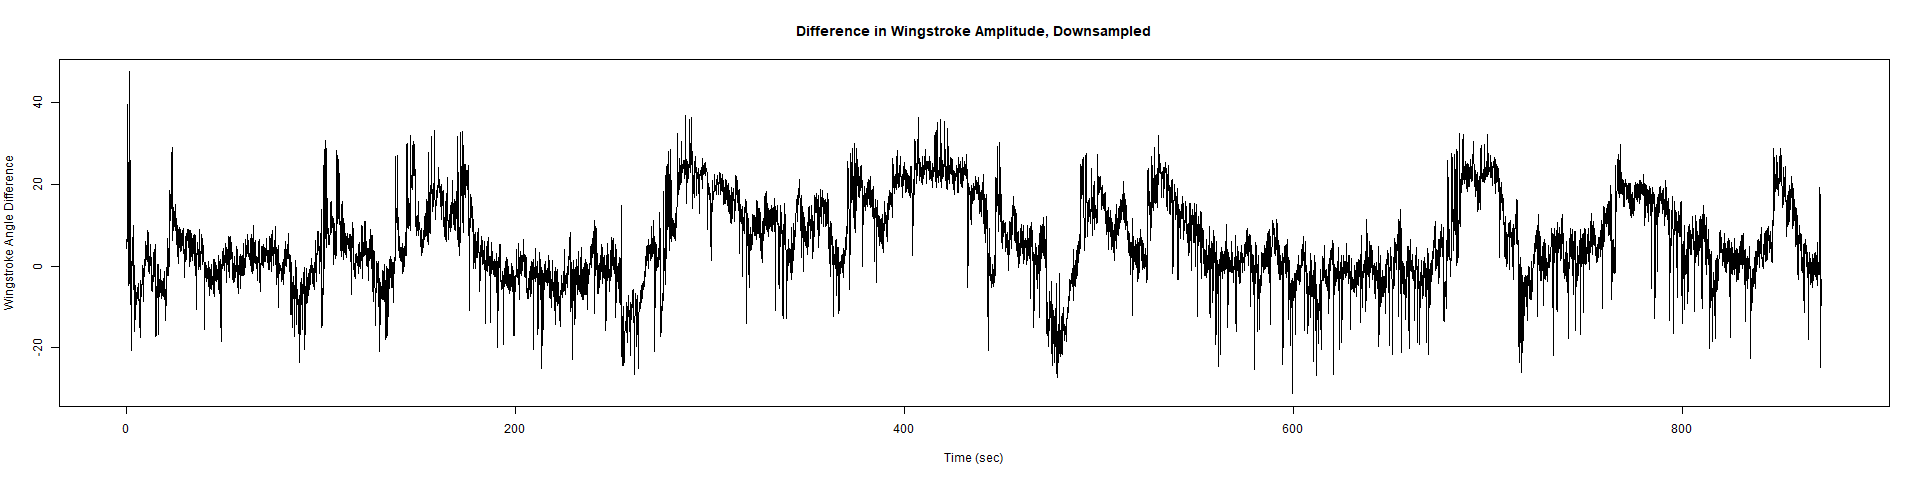
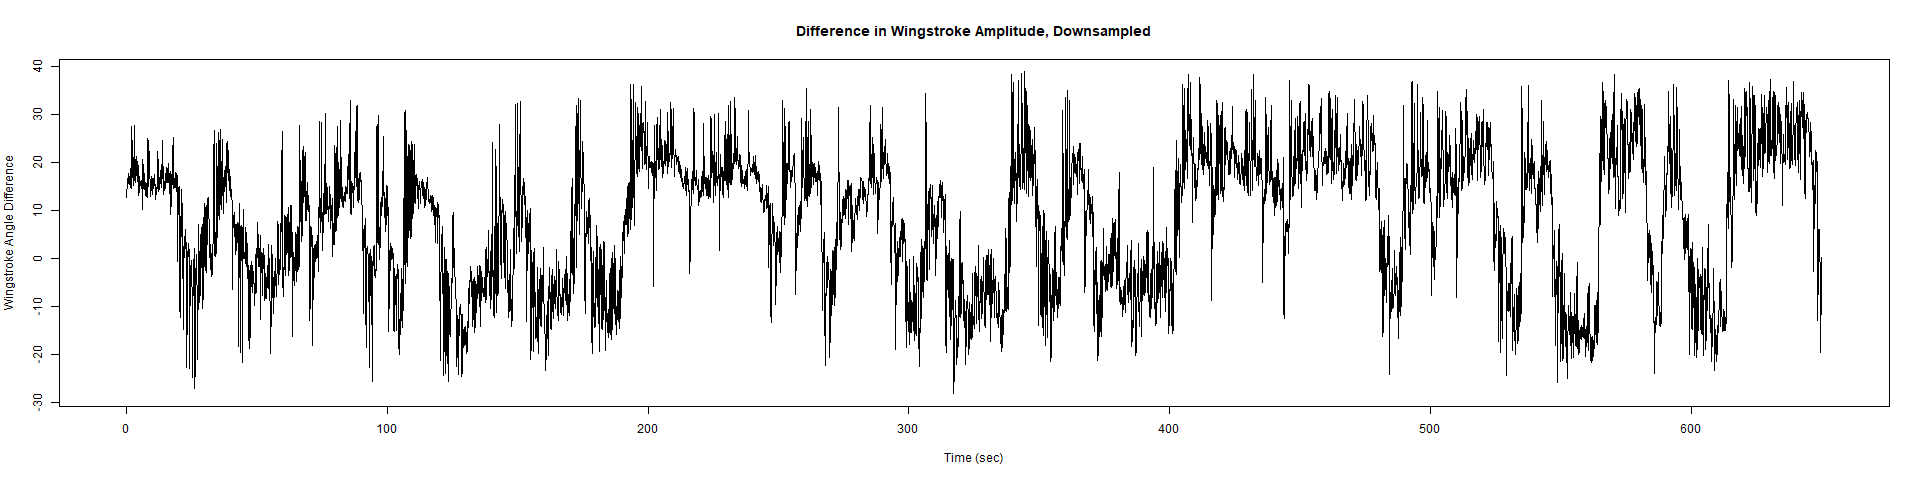
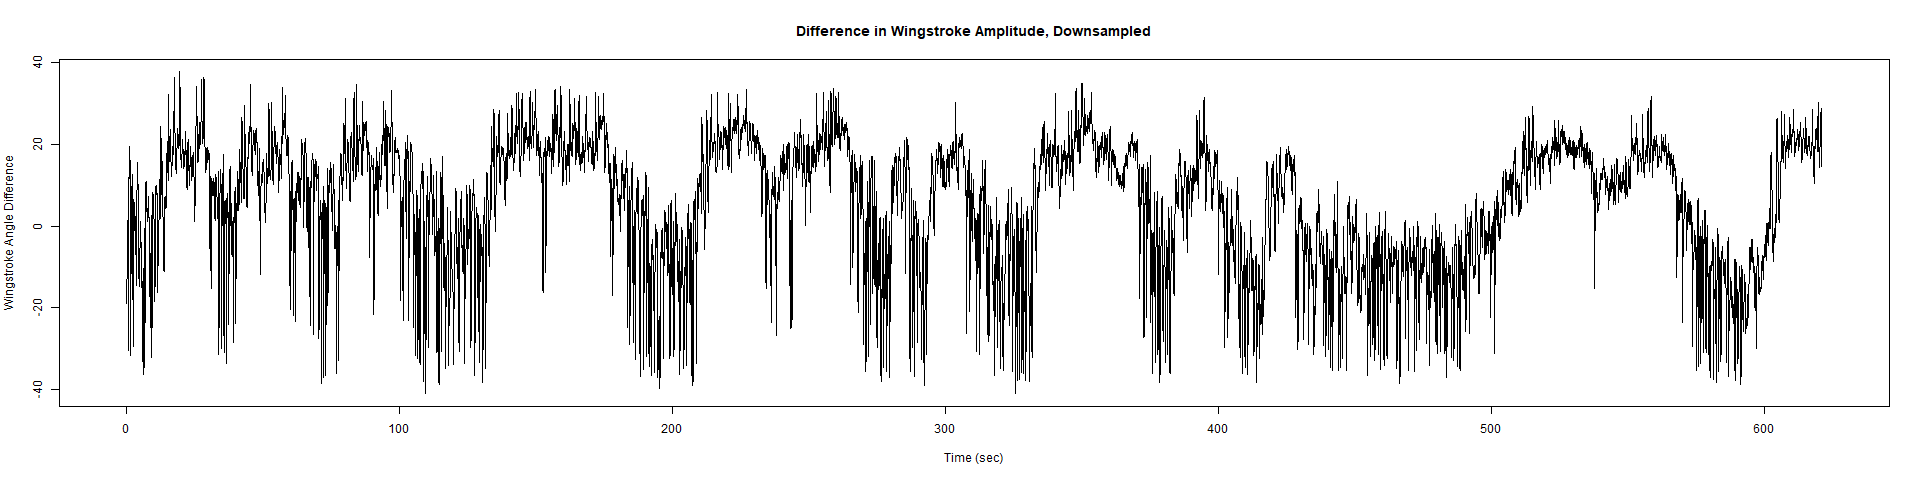
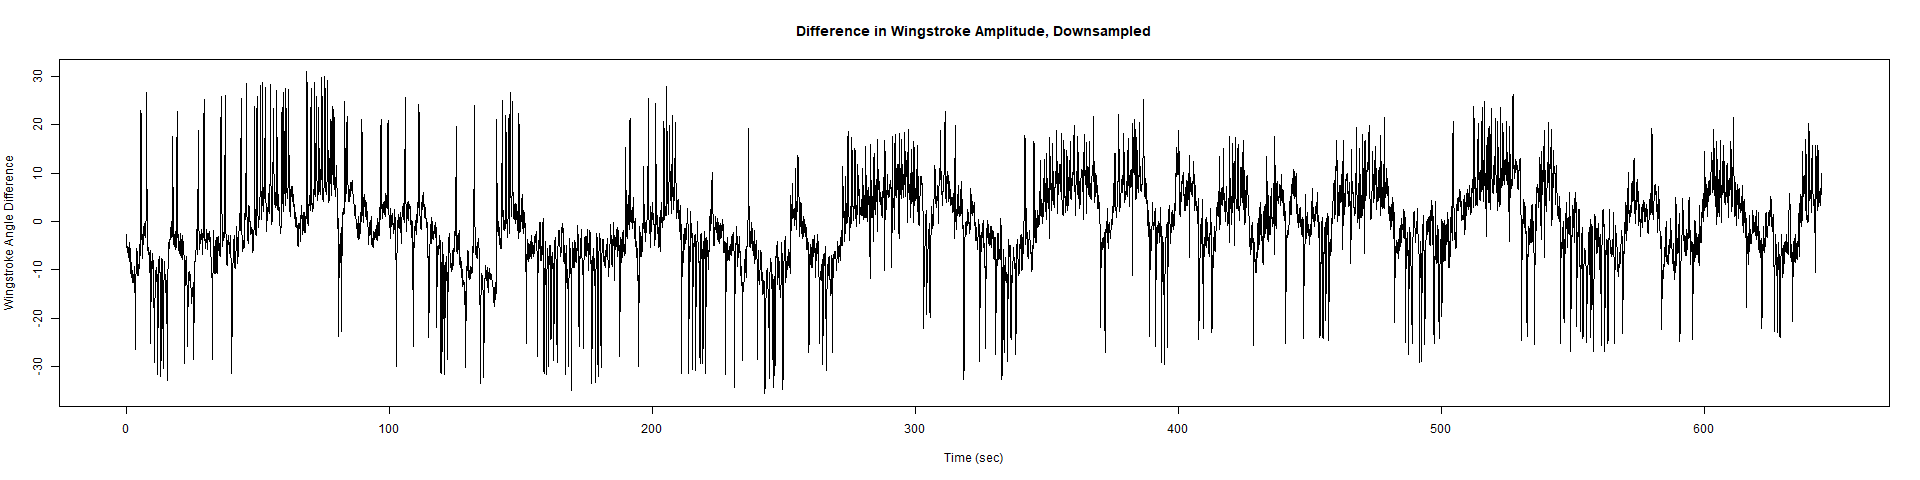
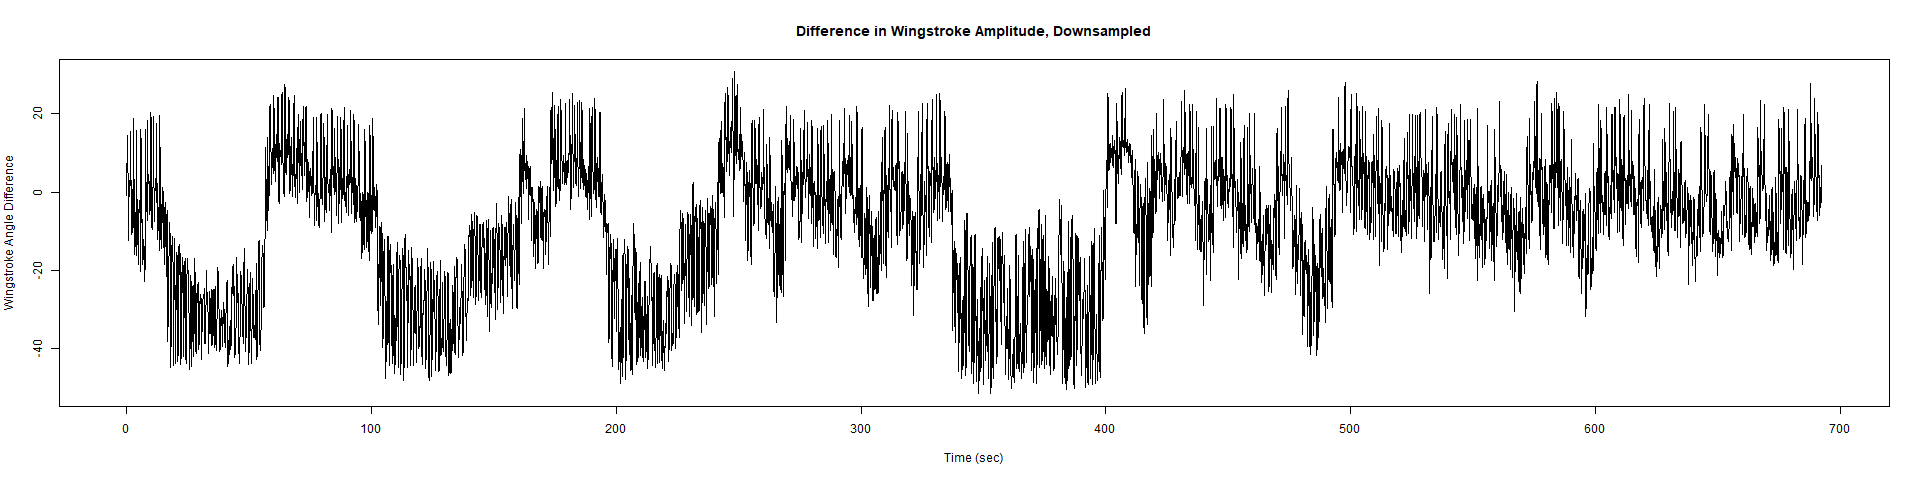
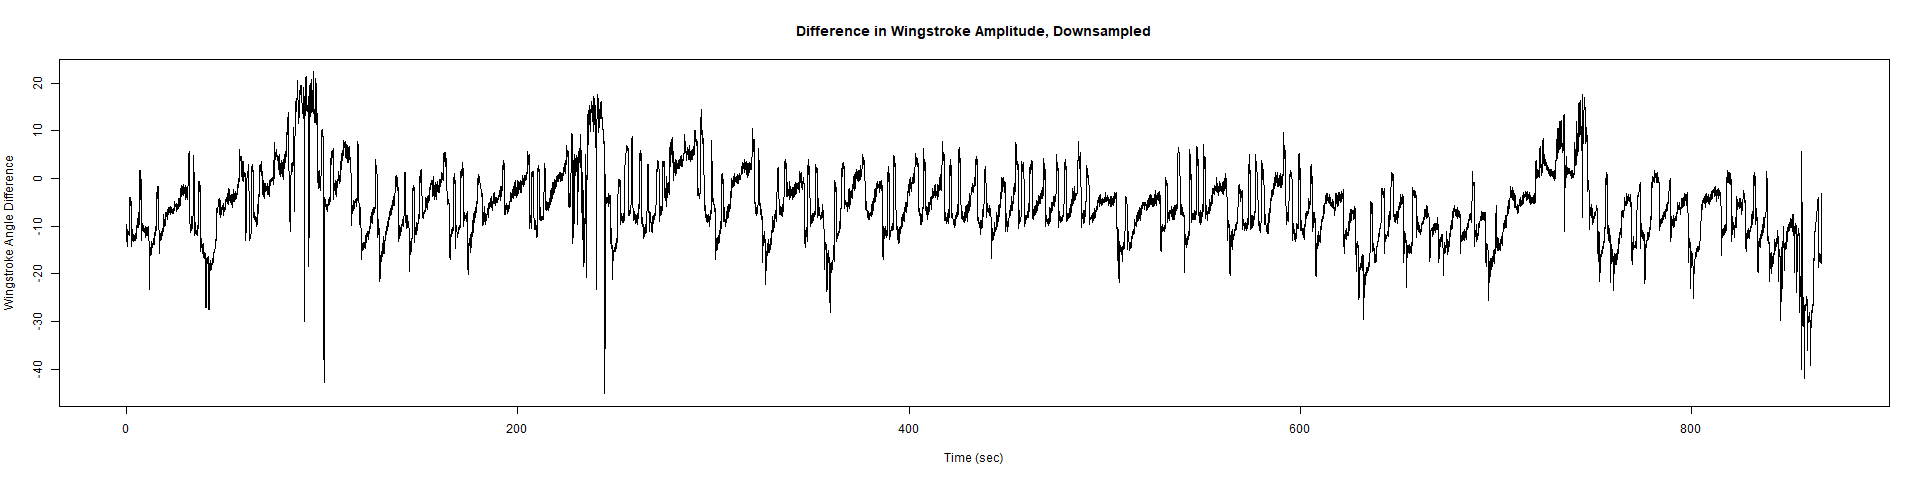
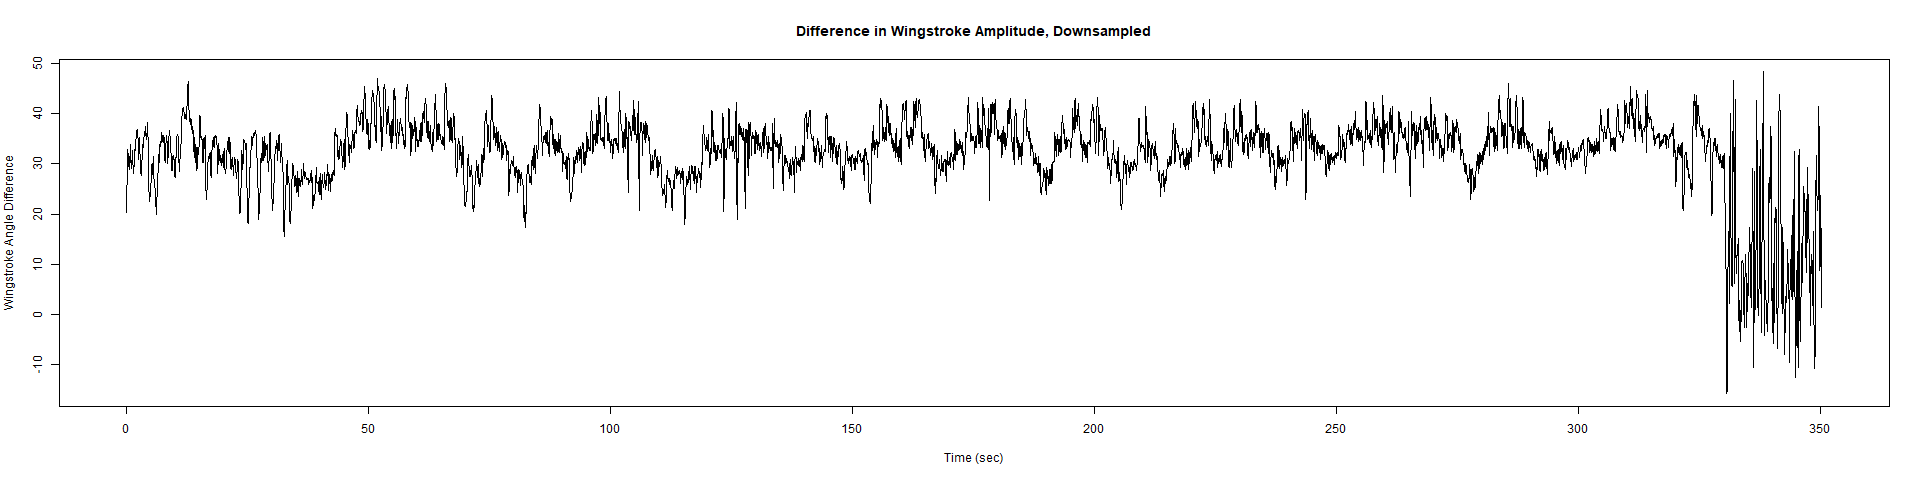
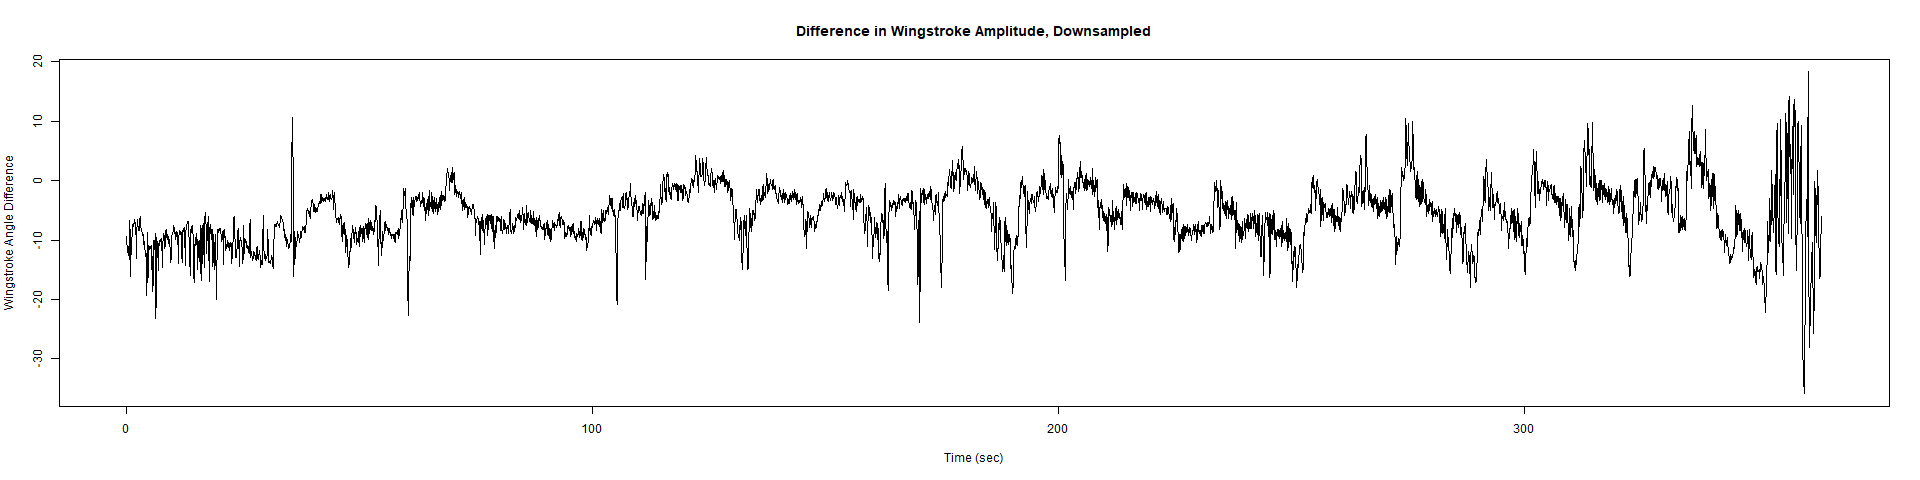
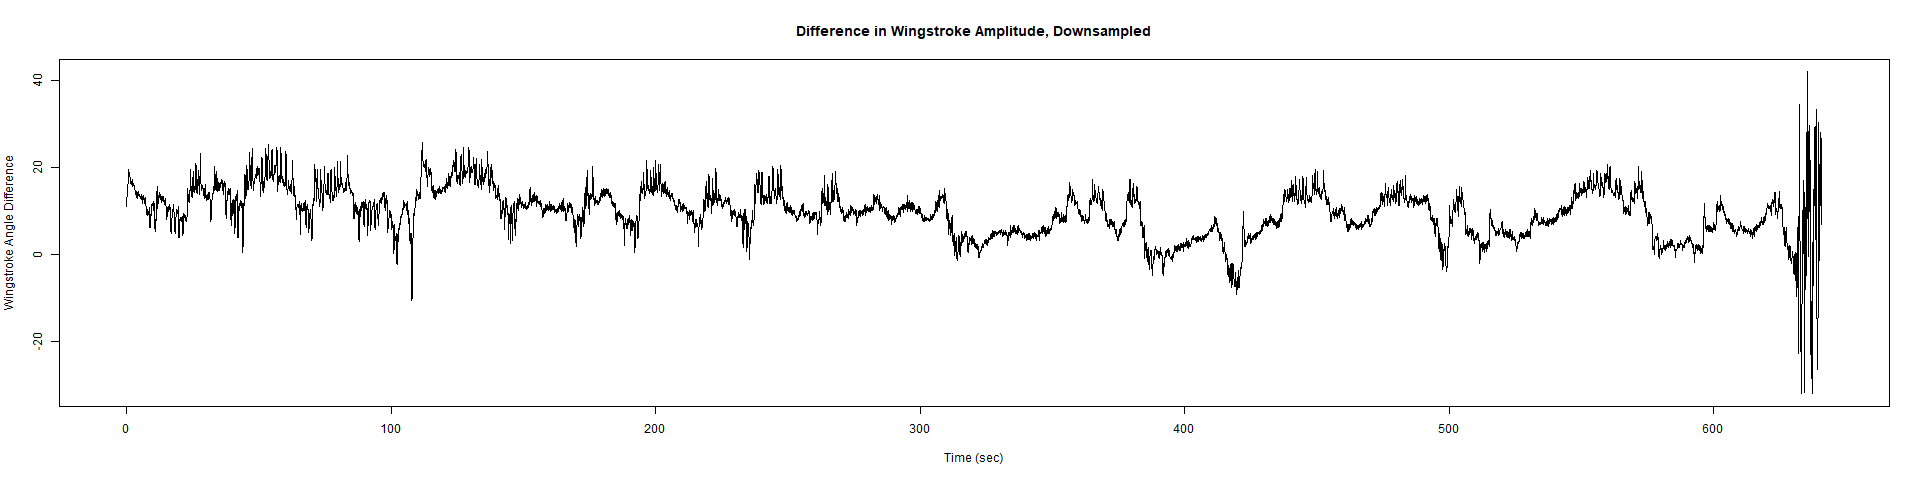
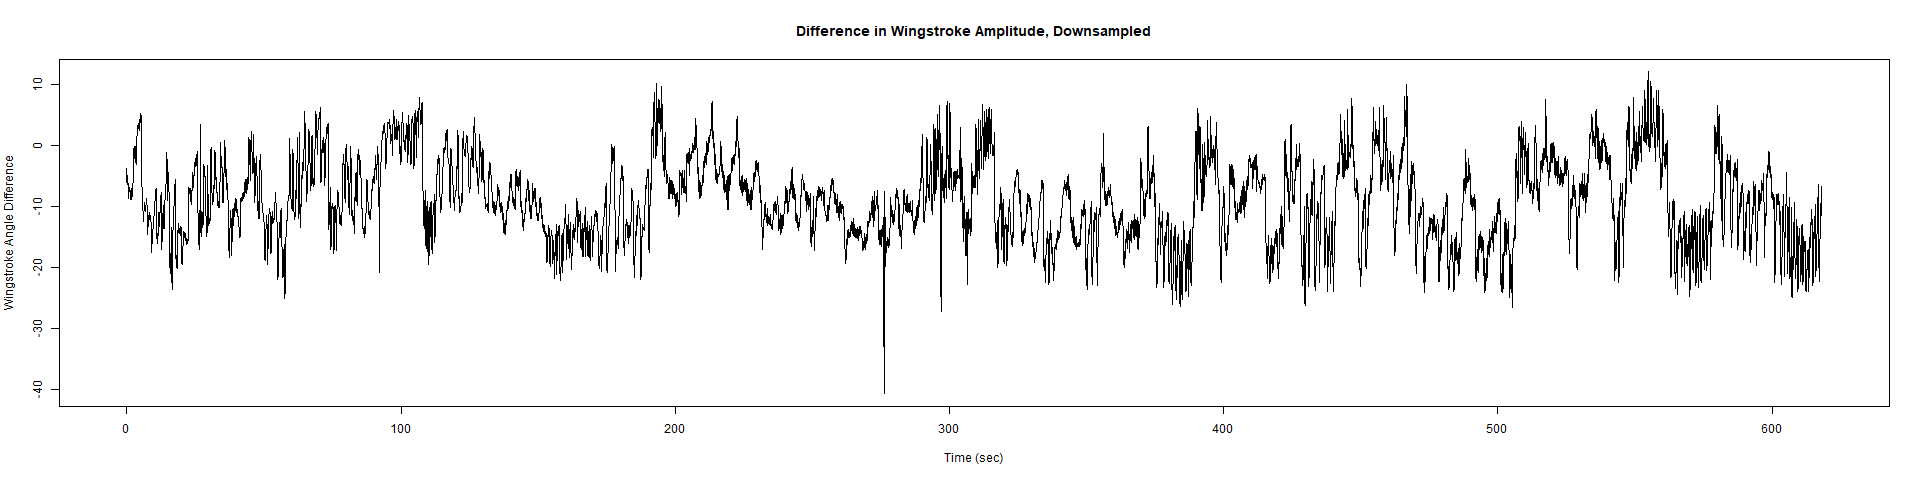
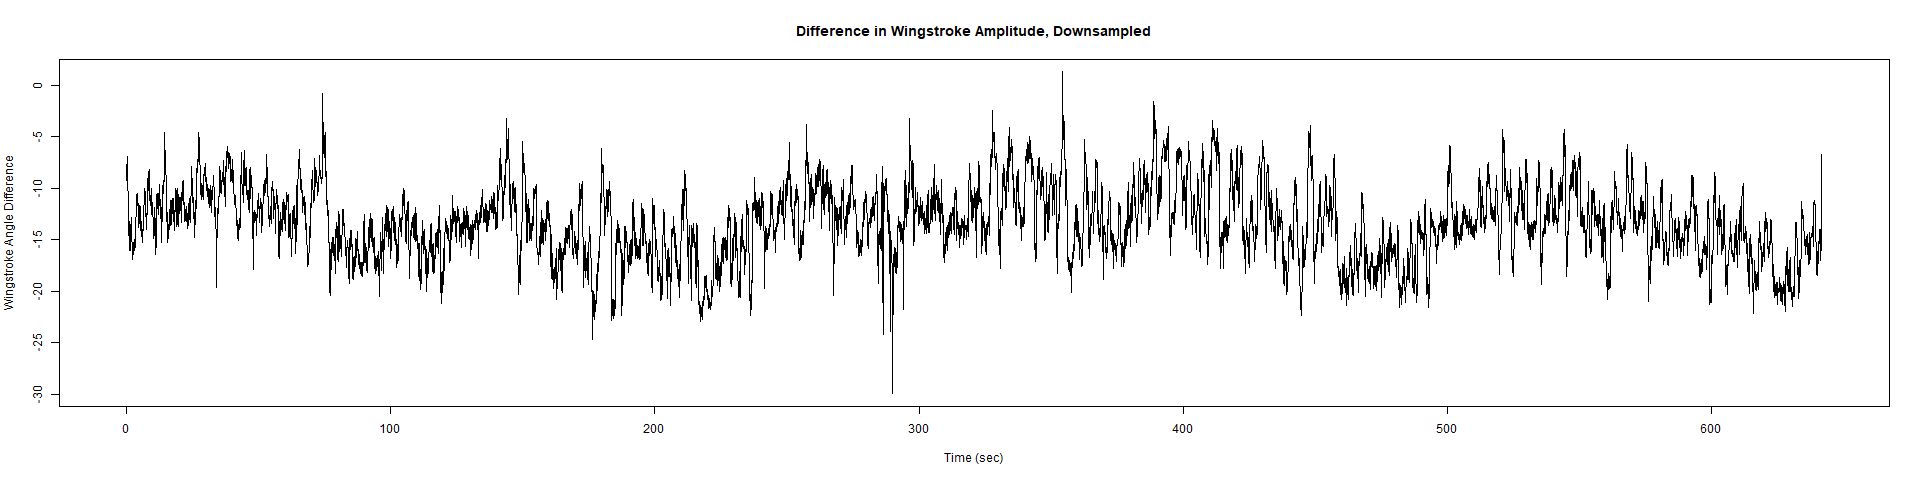
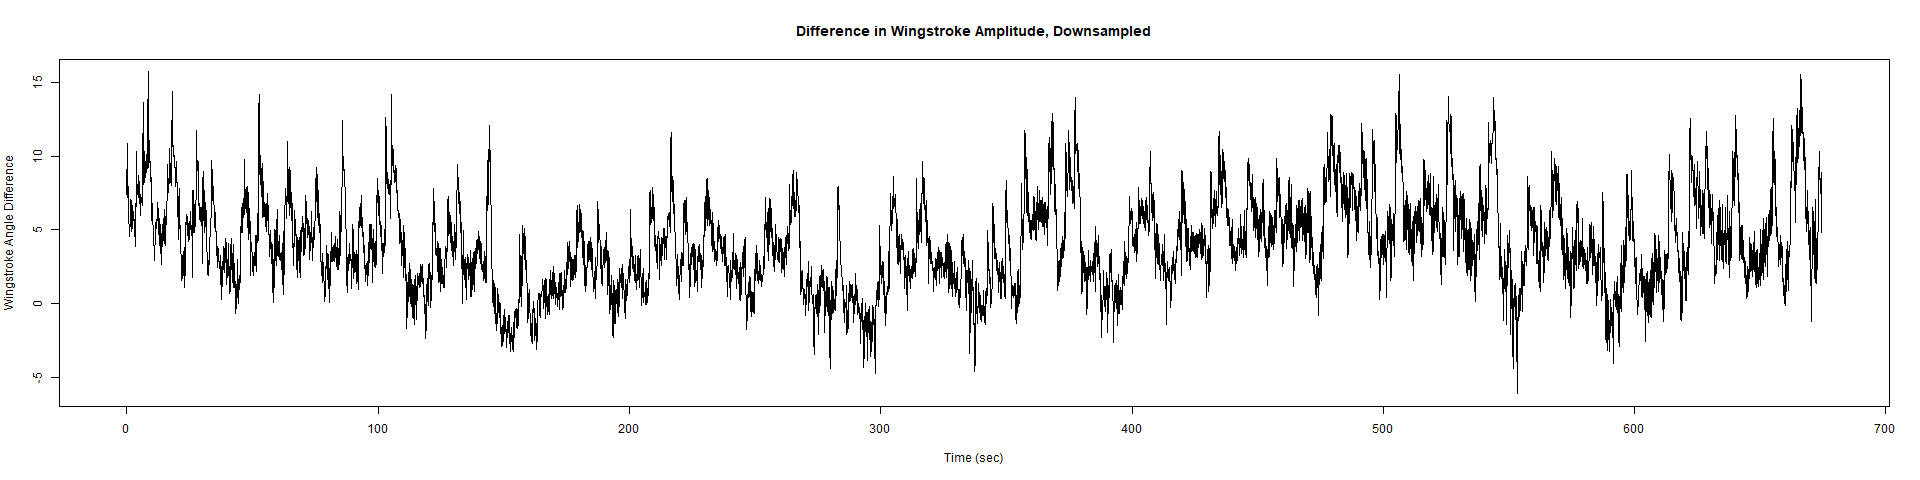
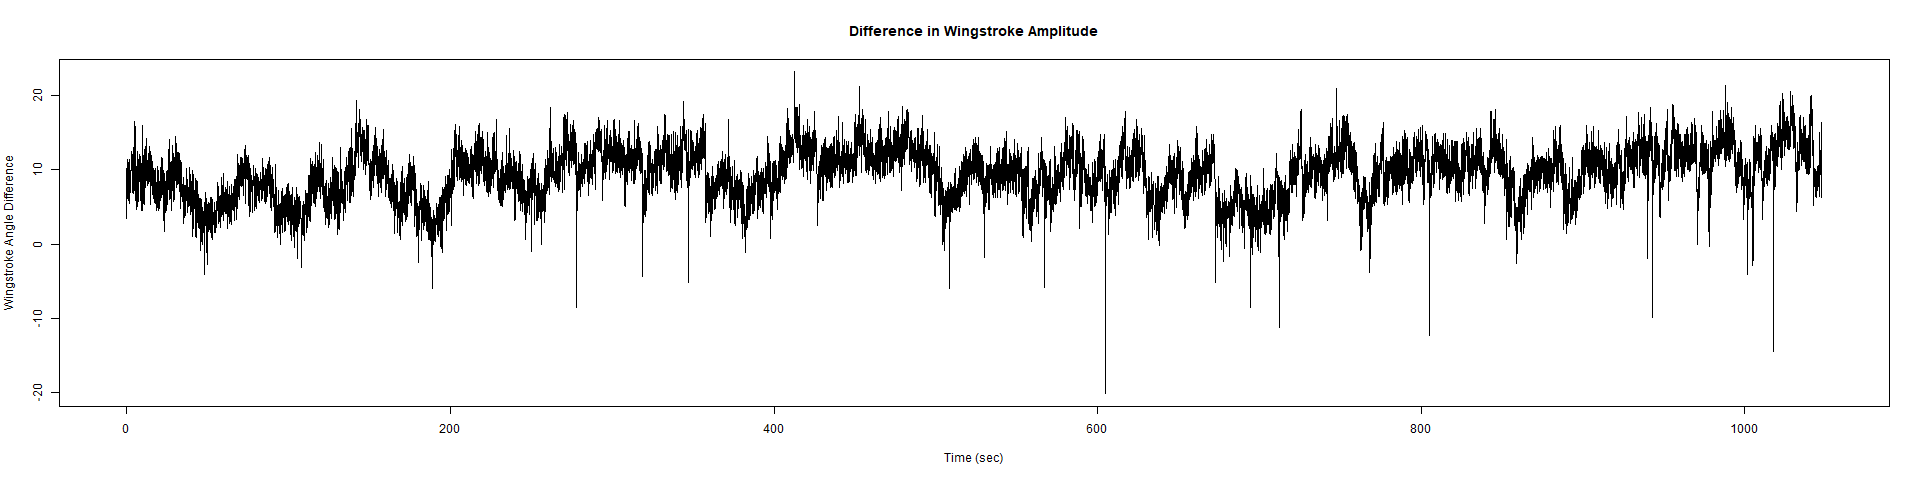
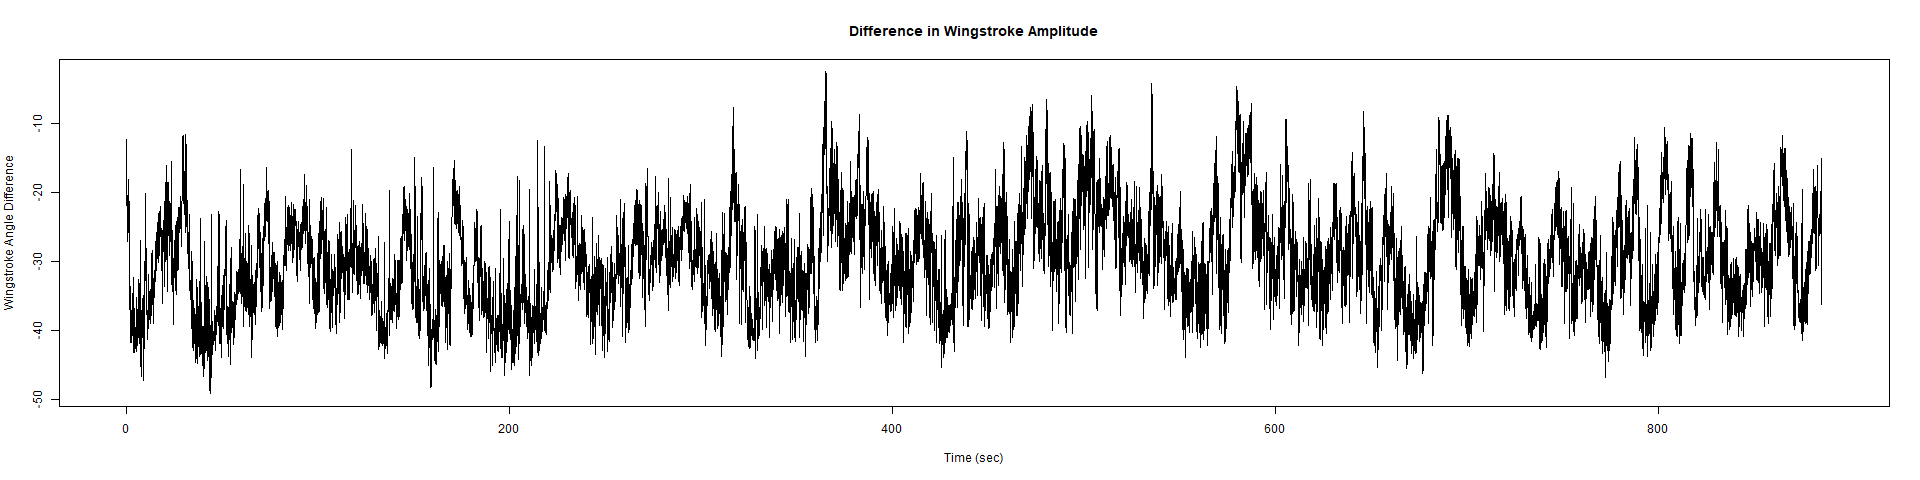
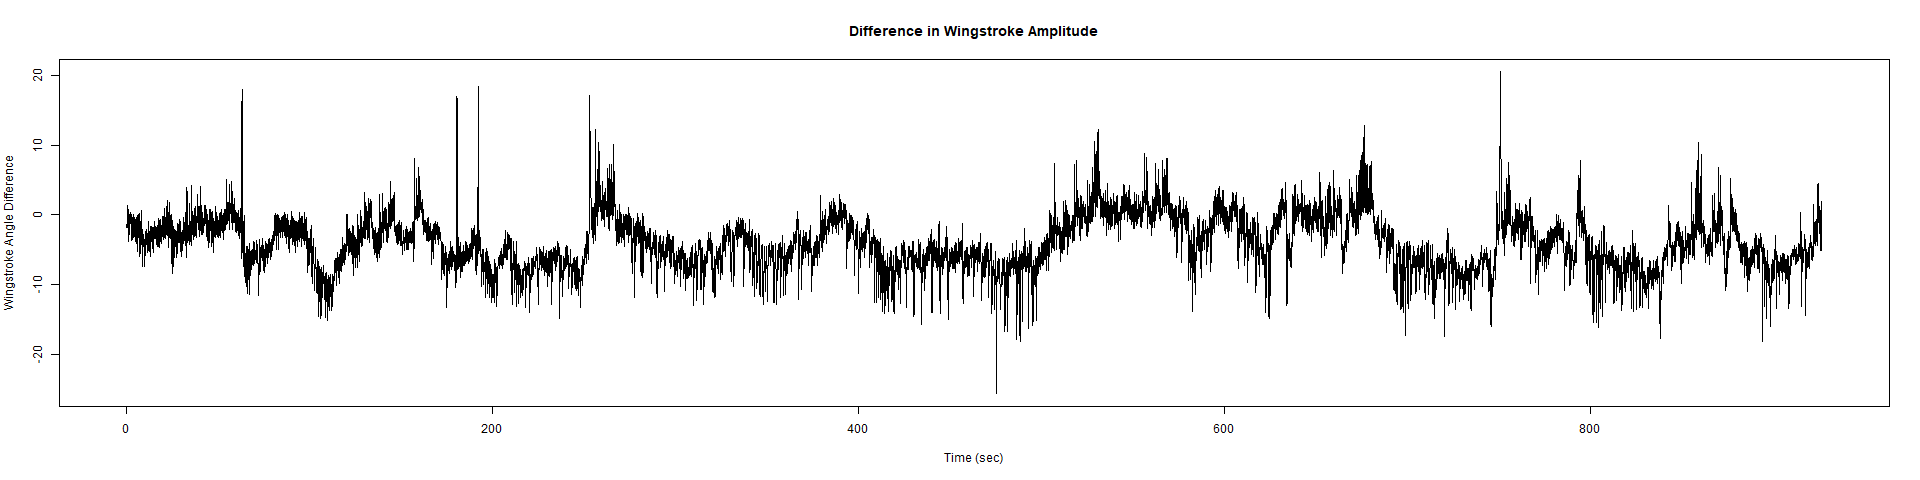
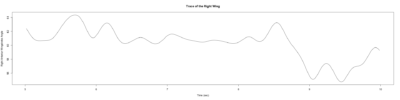
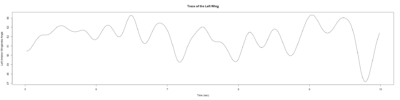
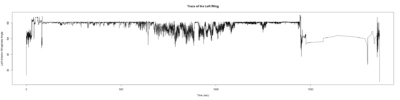
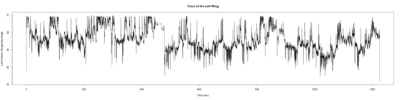
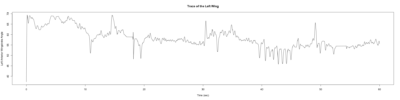
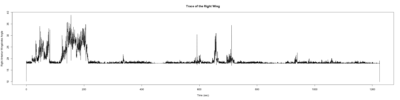
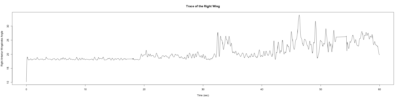
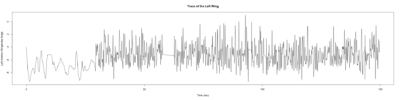
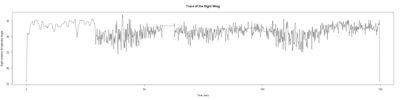
Trace (Downsampled 5) Graphs of Recordings
Wild type:
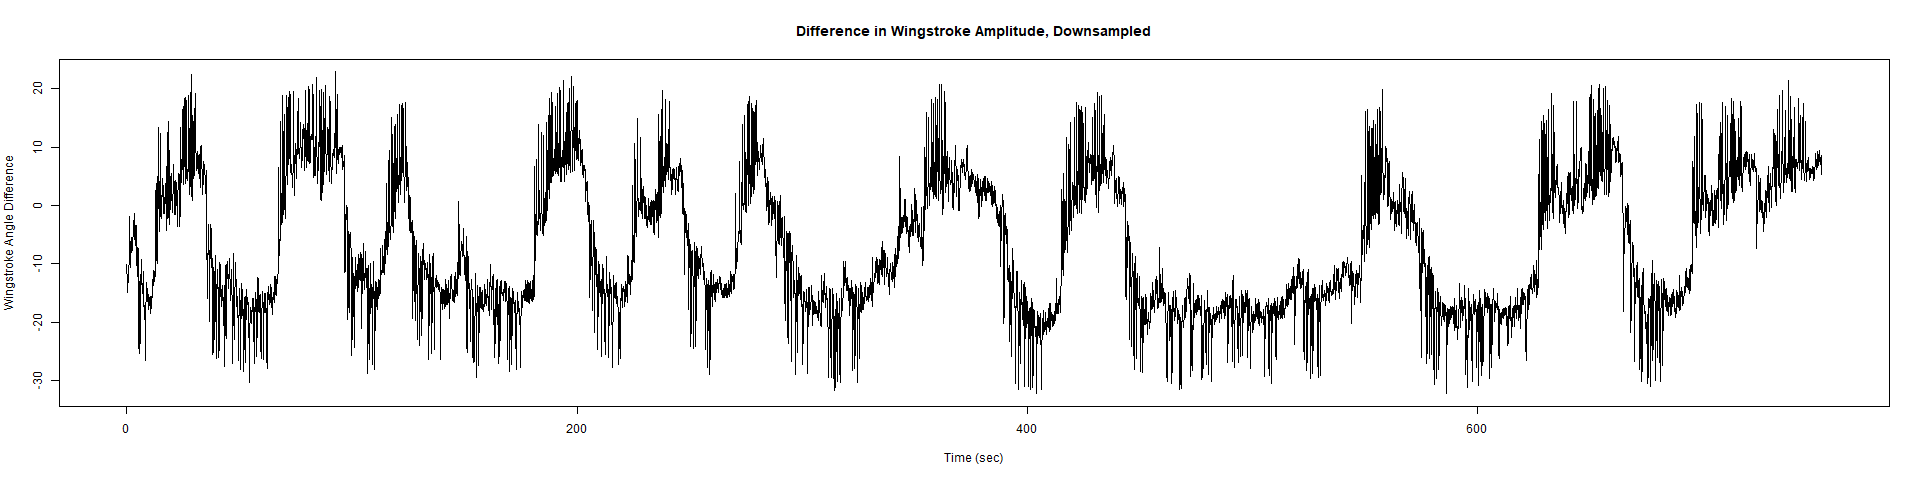
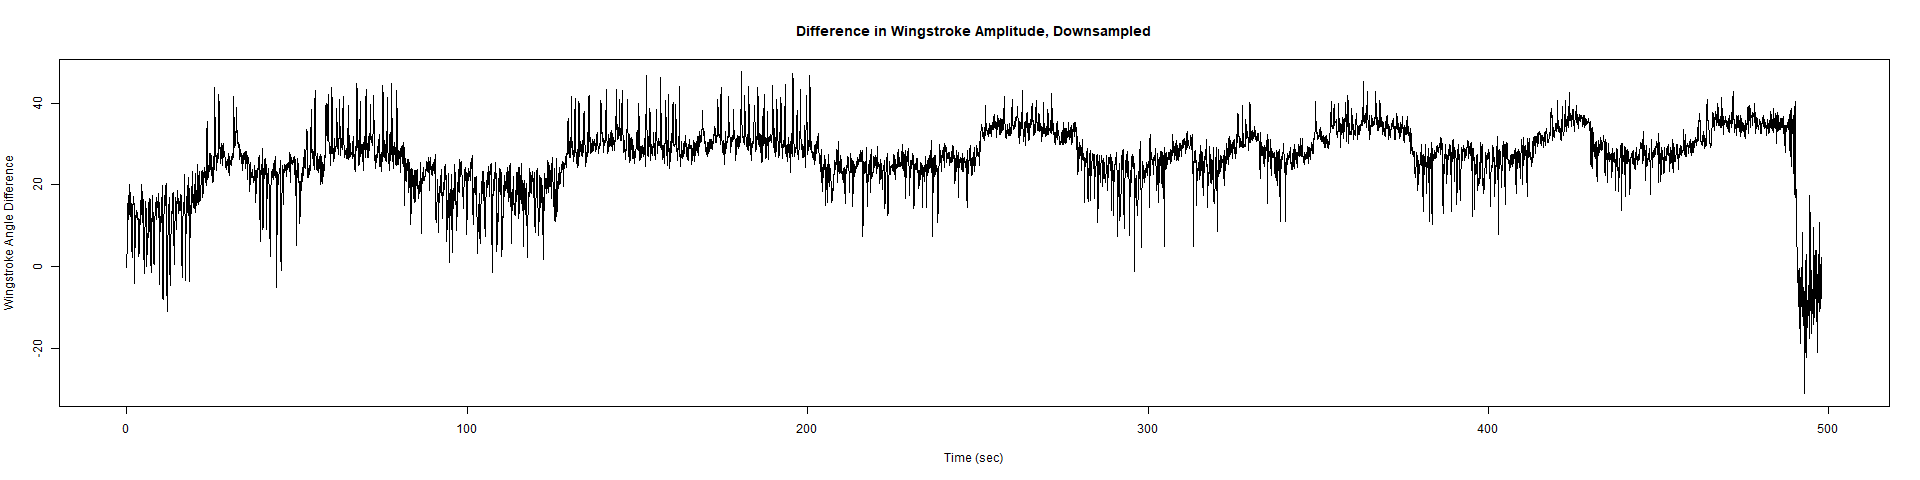
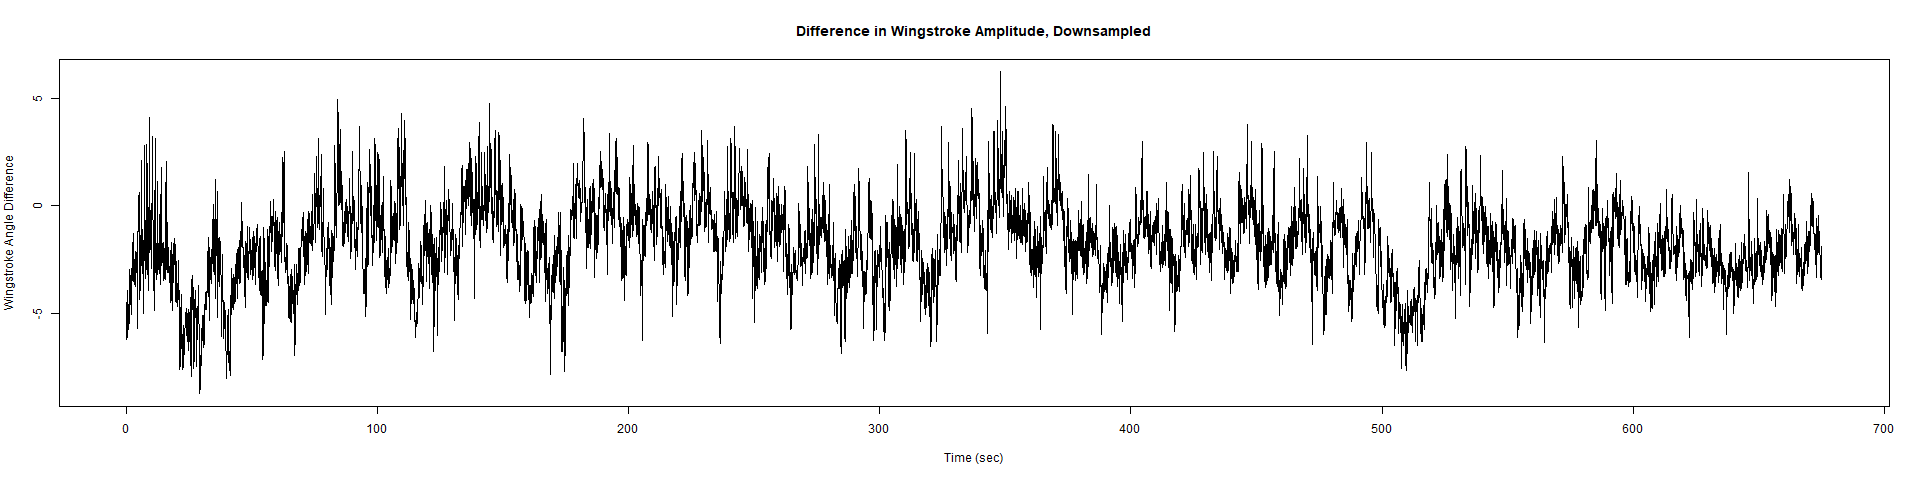
ElavGal4 x UAS-Ryr 28919:
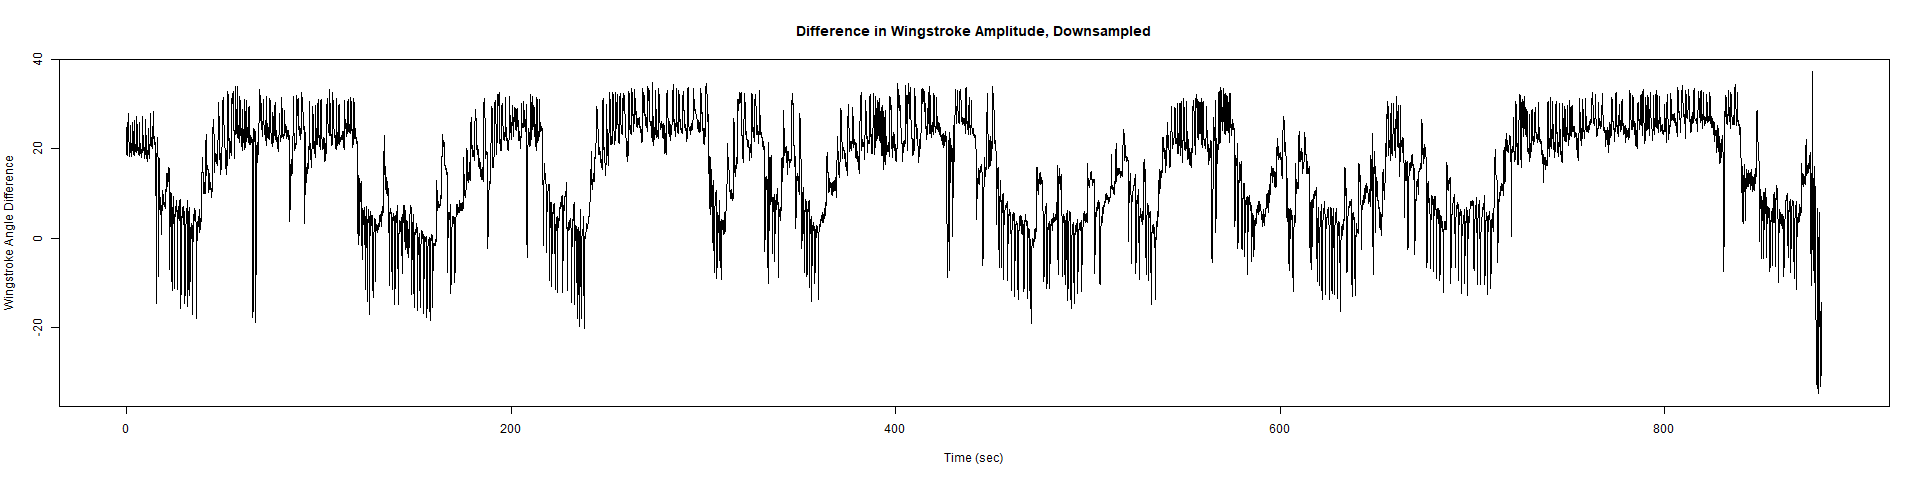
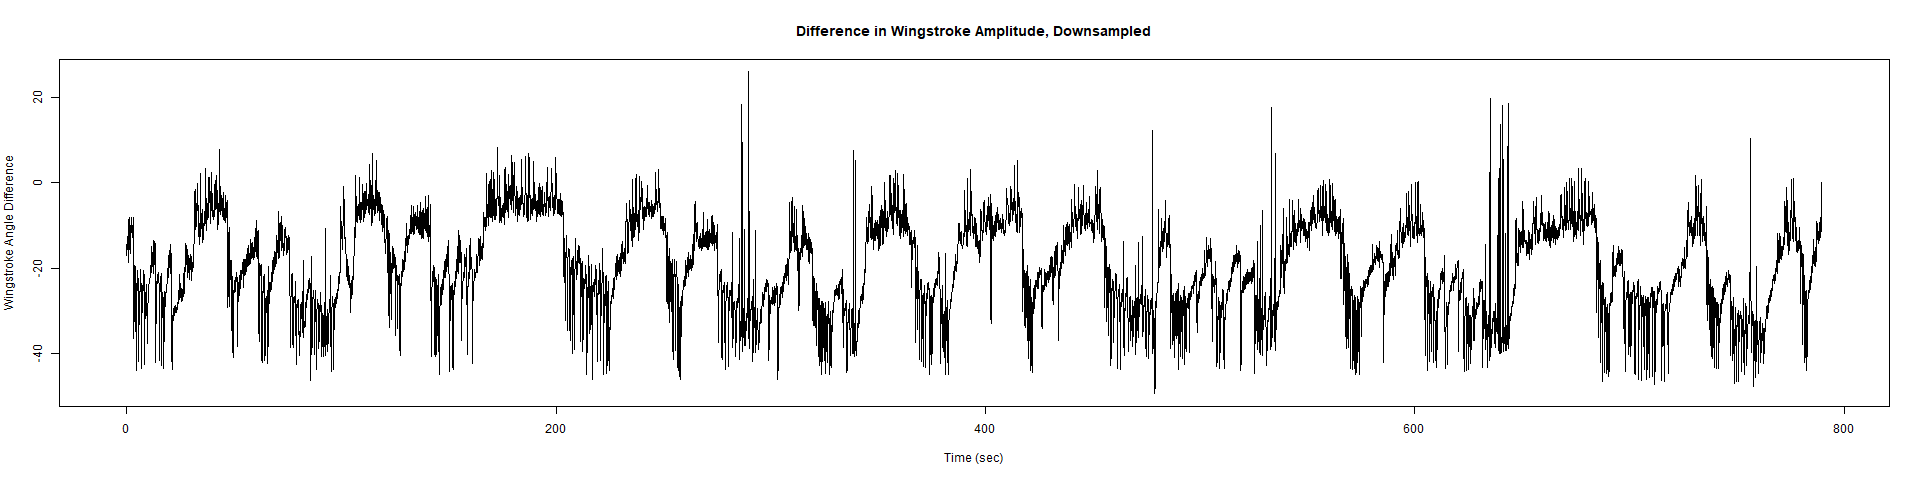
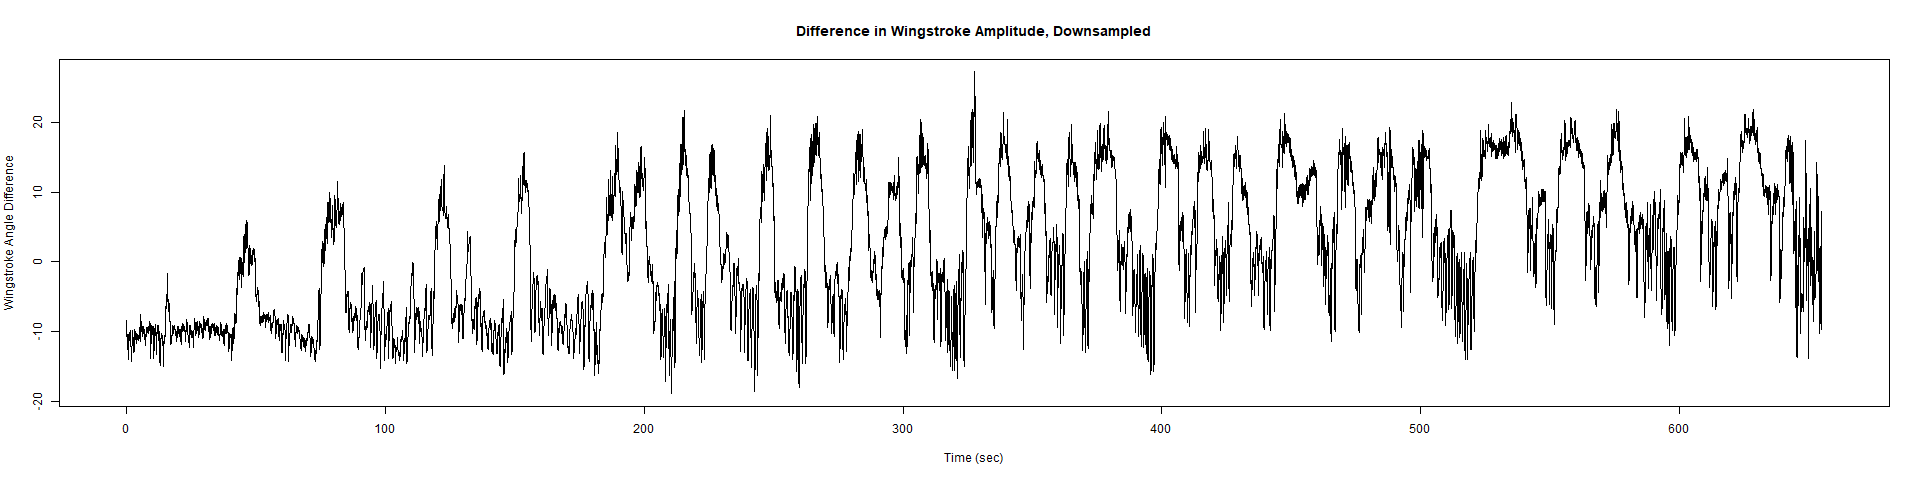
ElavGal4 x UAS-Ryr 65885:
Category: crosses, Spontaneous Behavior, strokelitude, WingStroke | No Comments
Strokelitude 5 New Rec
on Monday, April 1st, 2019 2:54 | by Miroslav Stojic
New Findings:
Elav-Gal4 x UAS-SERCA 44581 flies => Lethal before adulthood! (in all 5 vials so far)

Category: crosses, Spontaneous Behavior, strokelitude, WingStroke | No Comments
Strok(e)litude – Practice
on Monday, March 25th, 2019 12:49 | by Miroslav Stojic
And the journey begins…
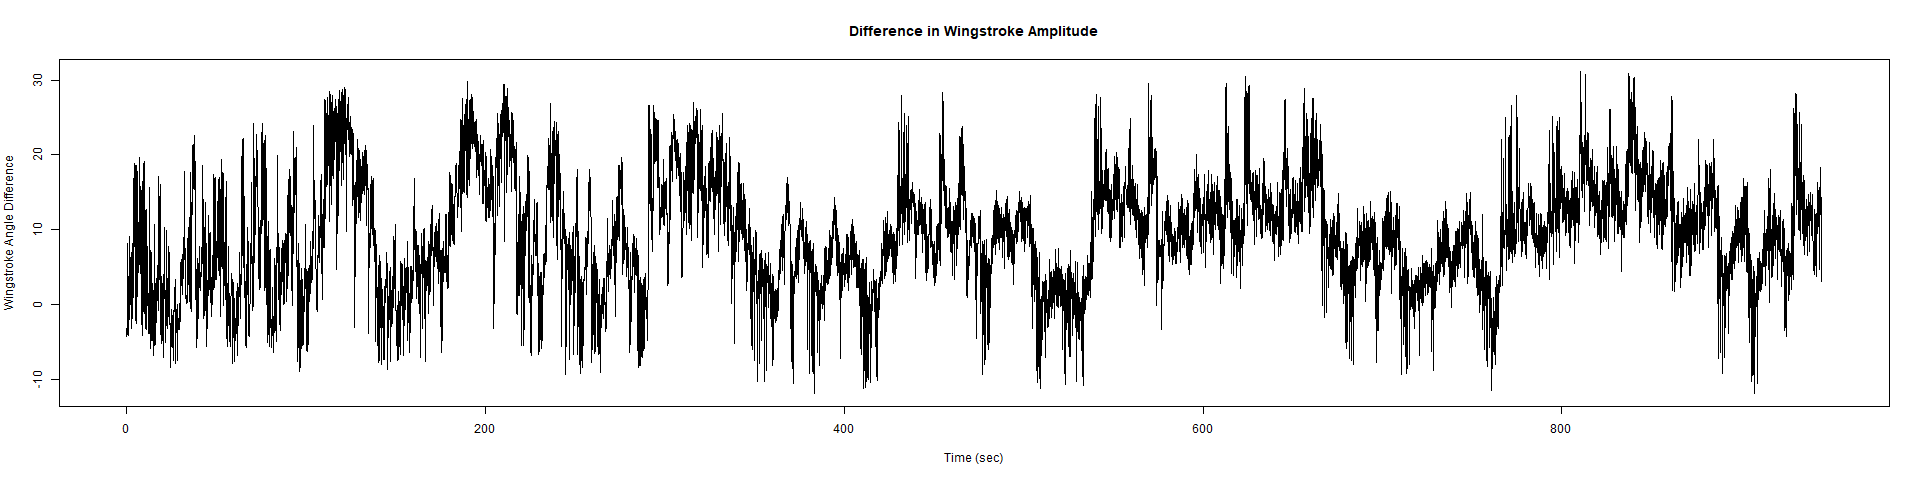
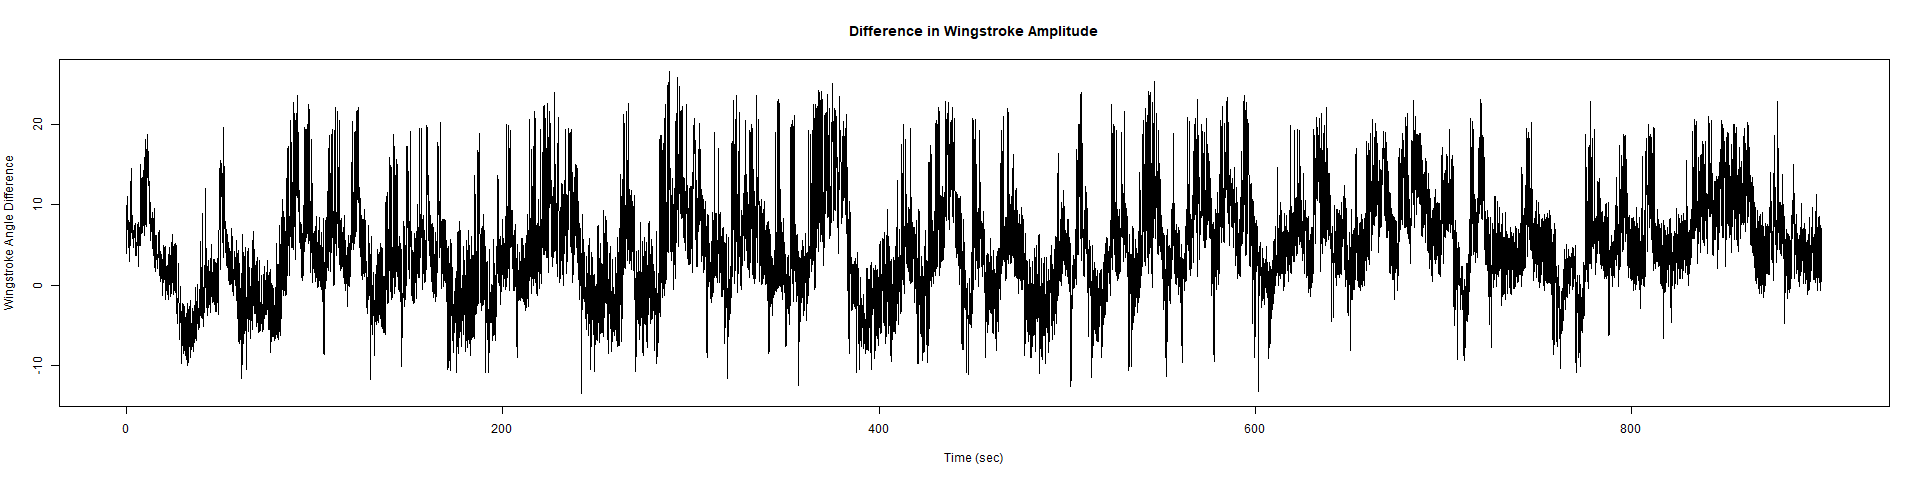
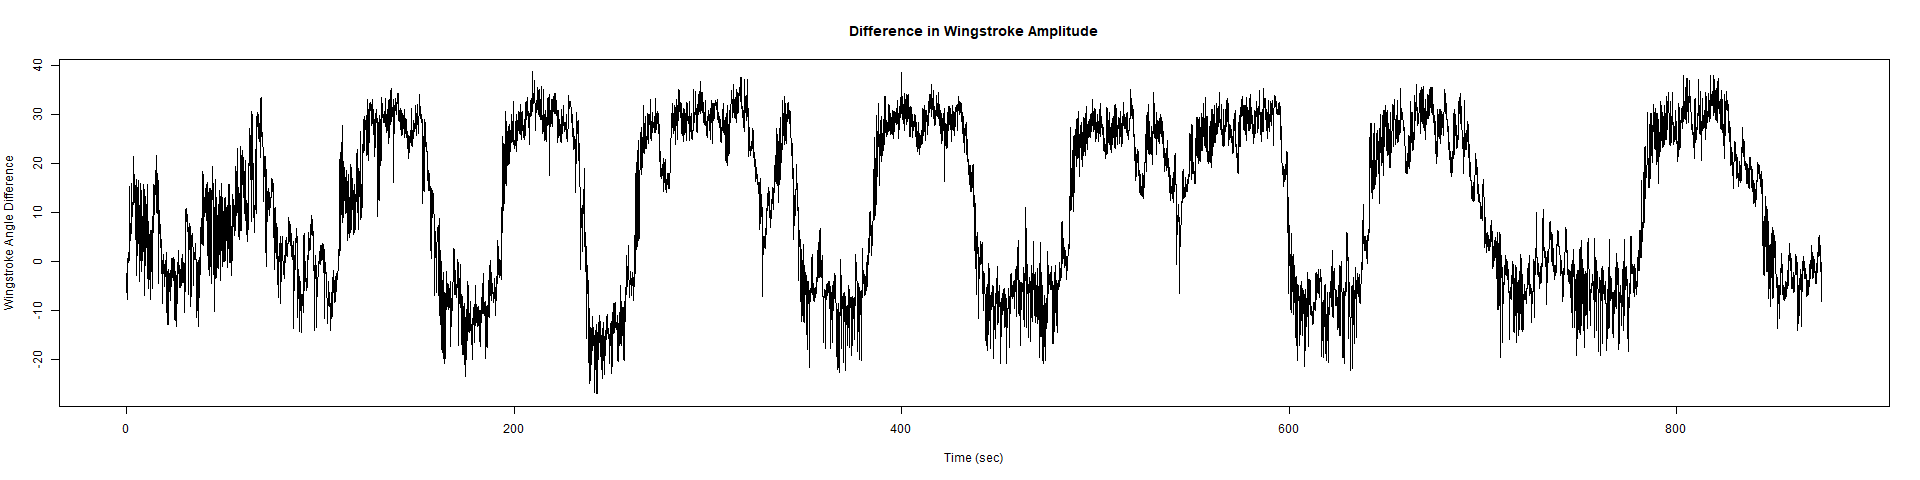
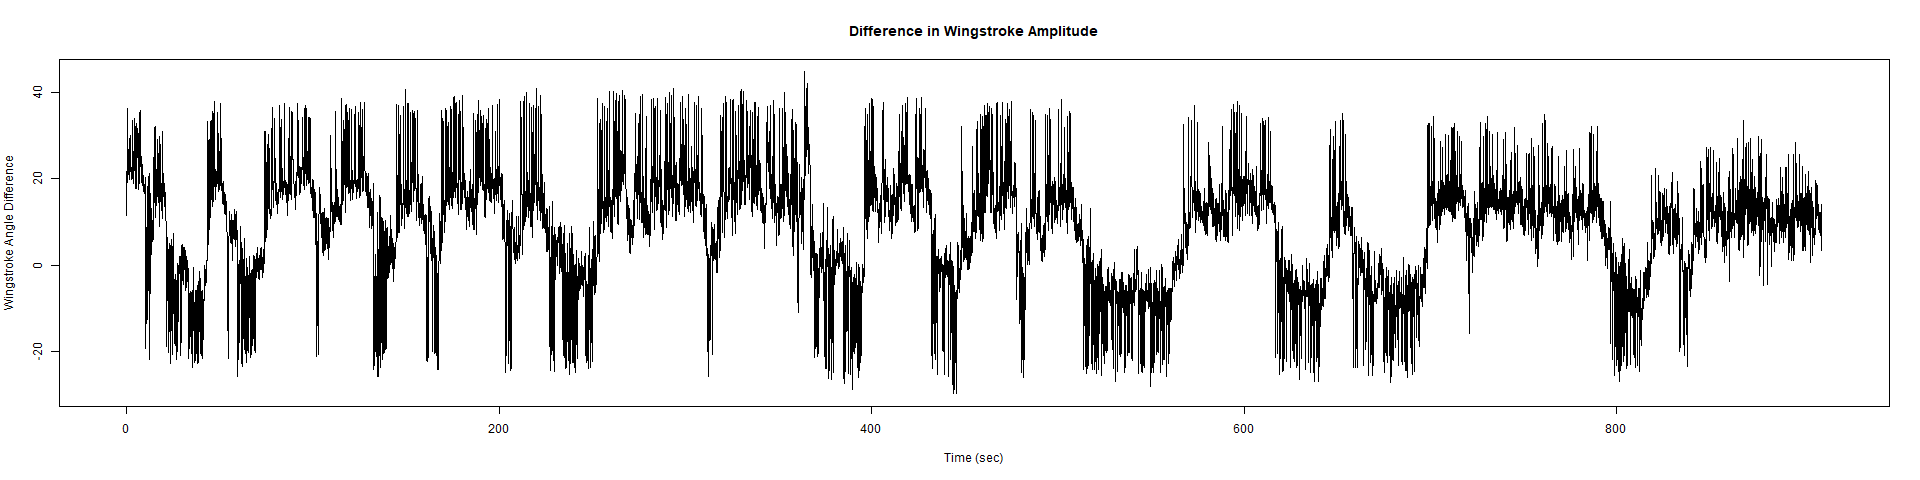
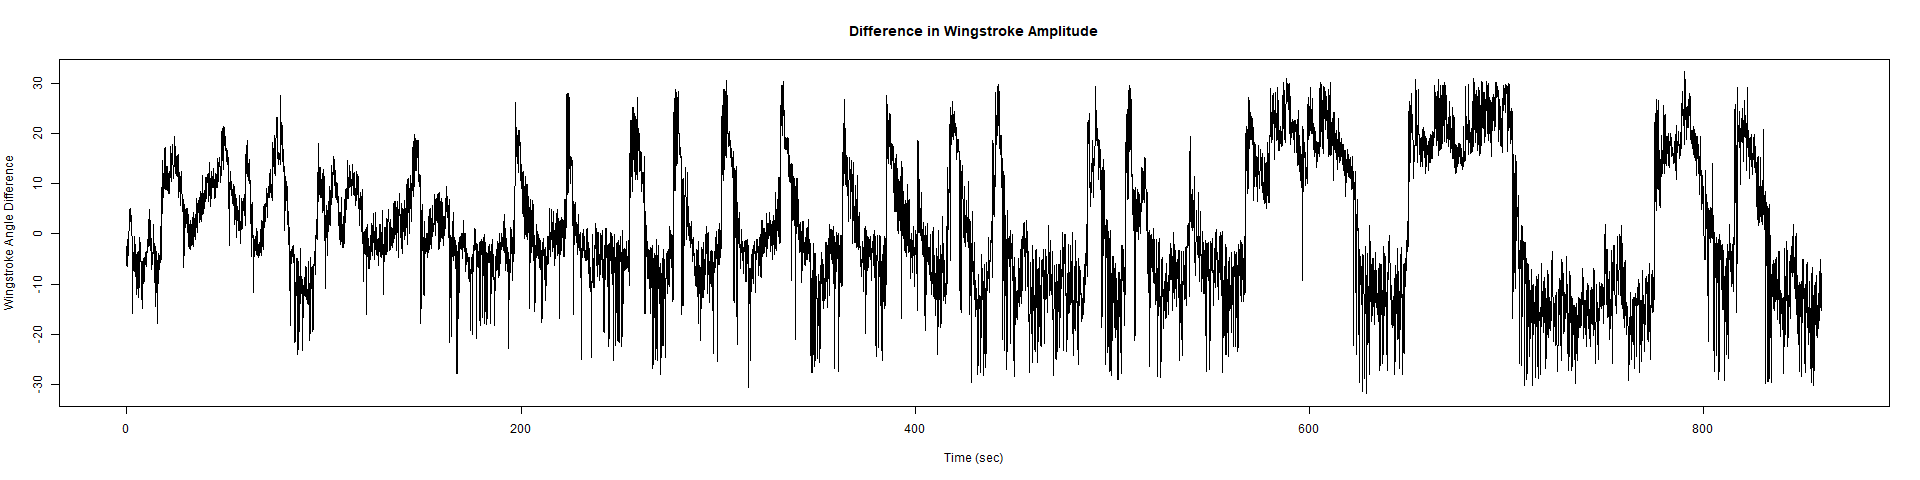
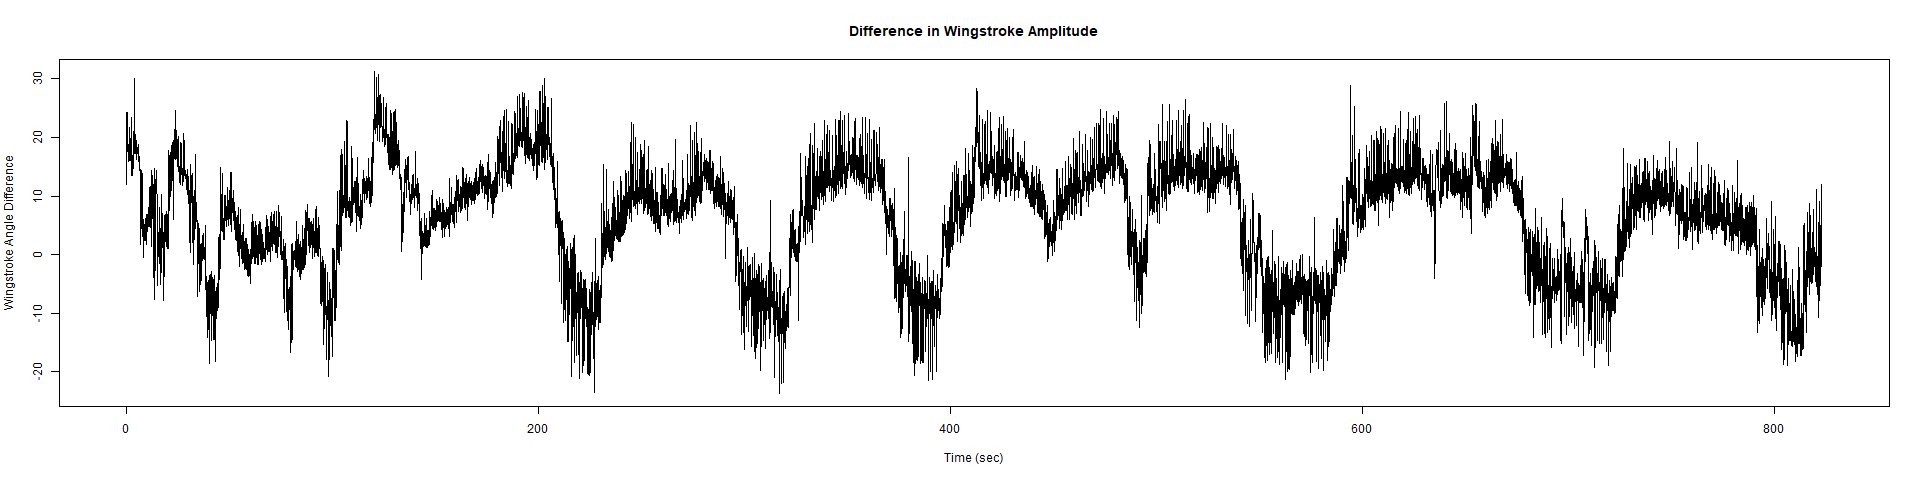
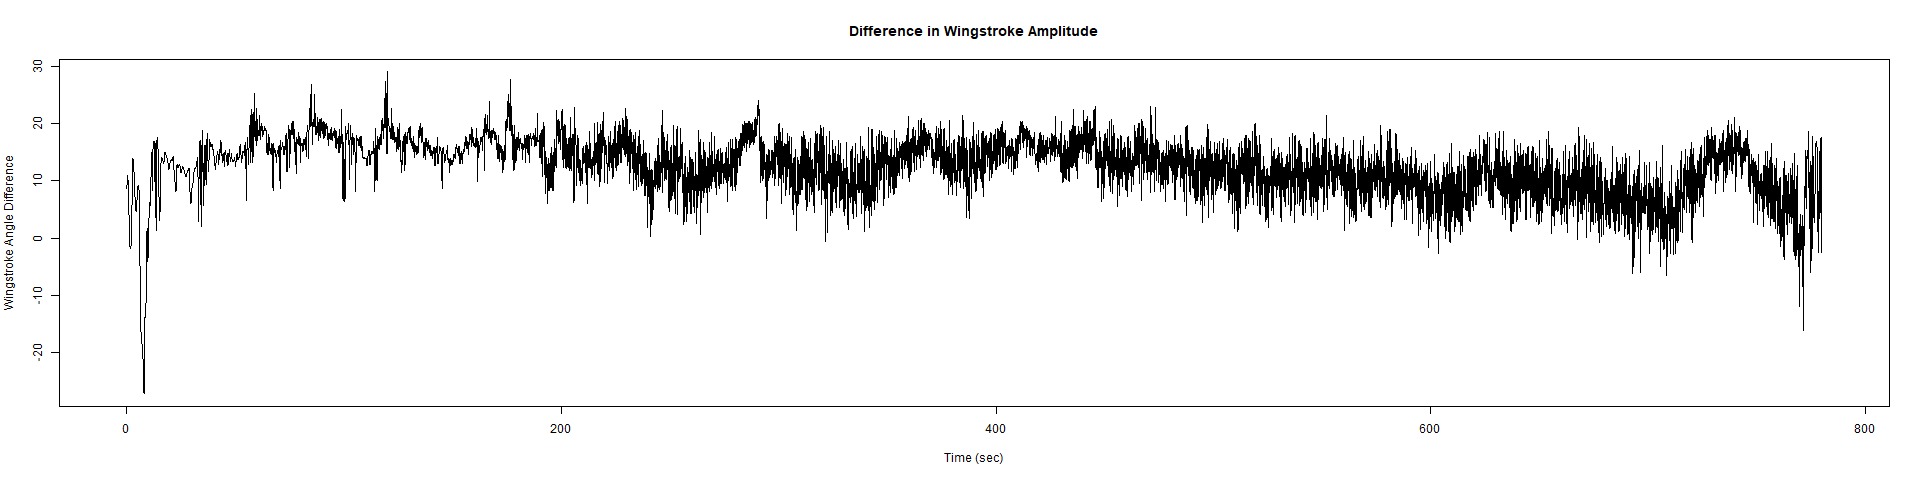
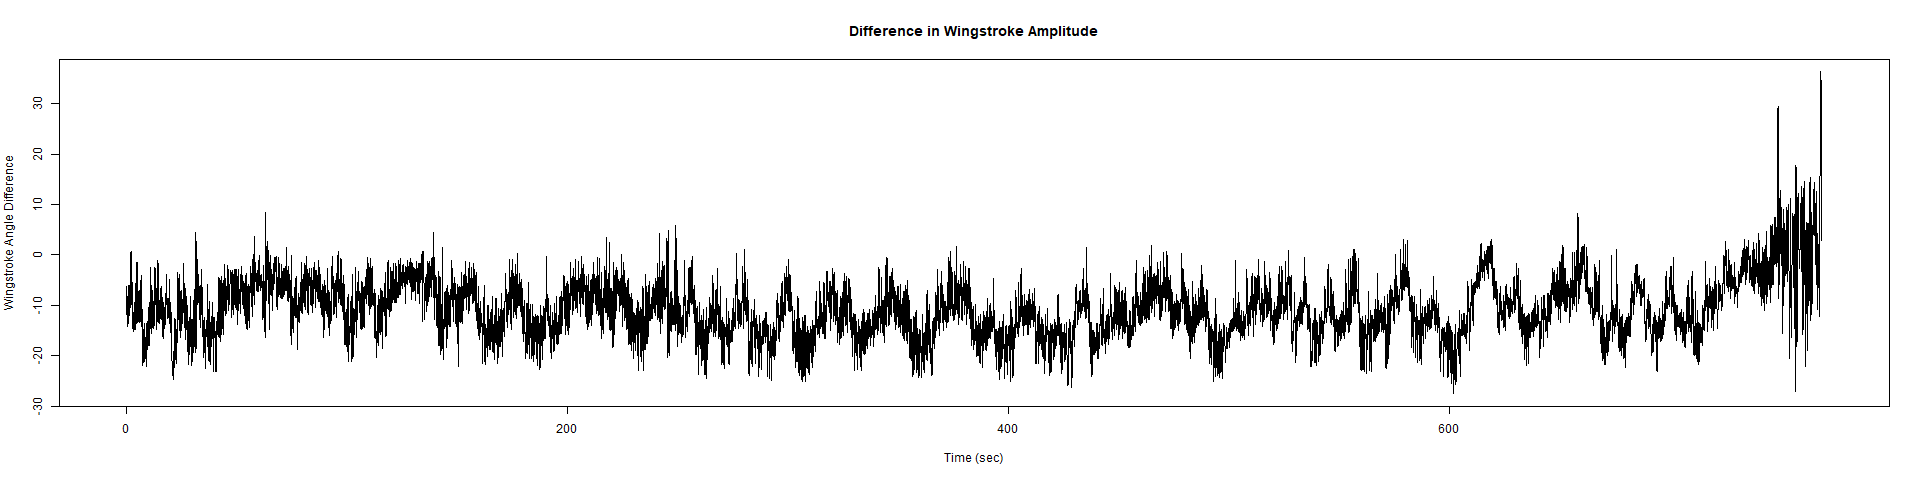
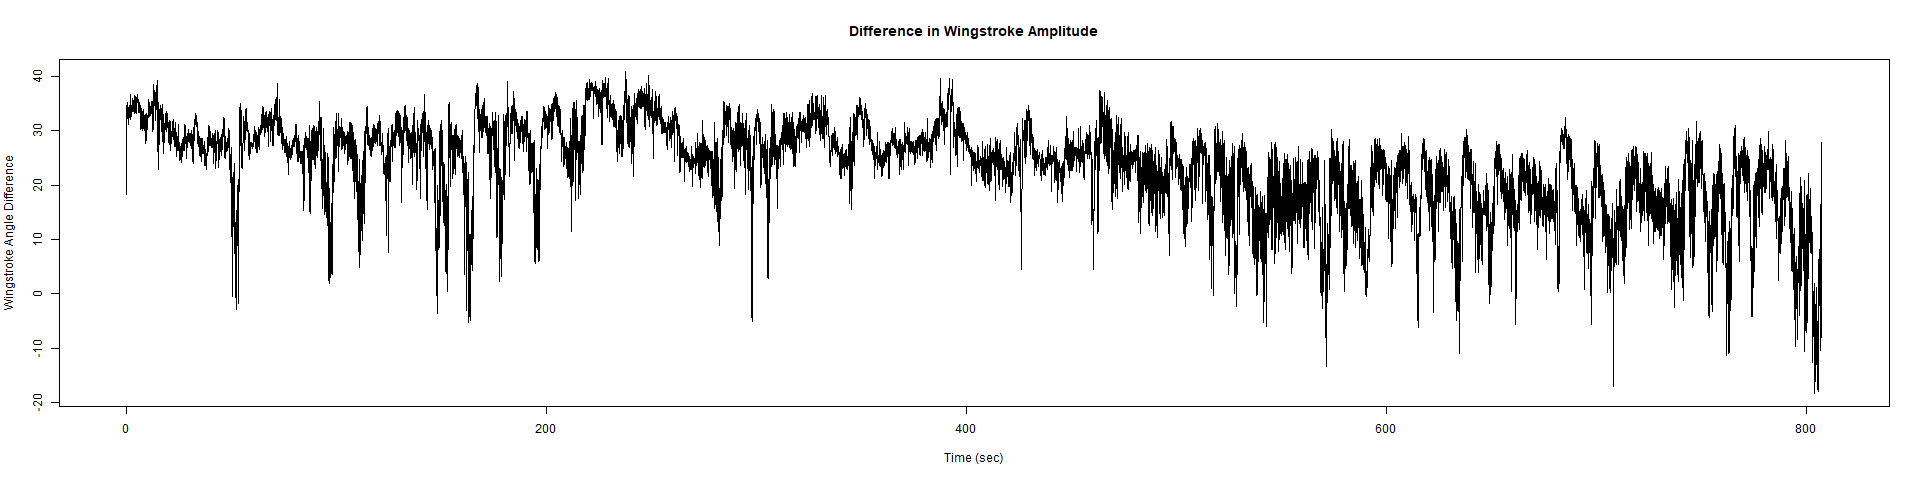
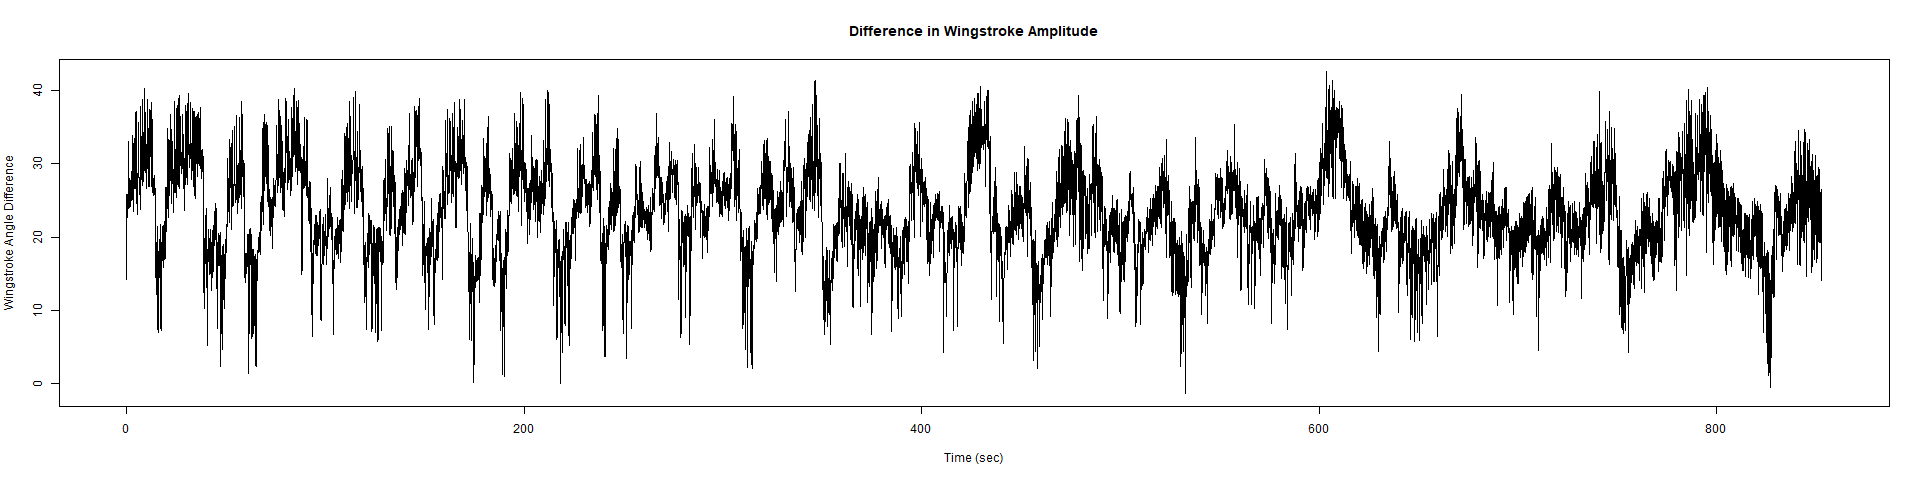
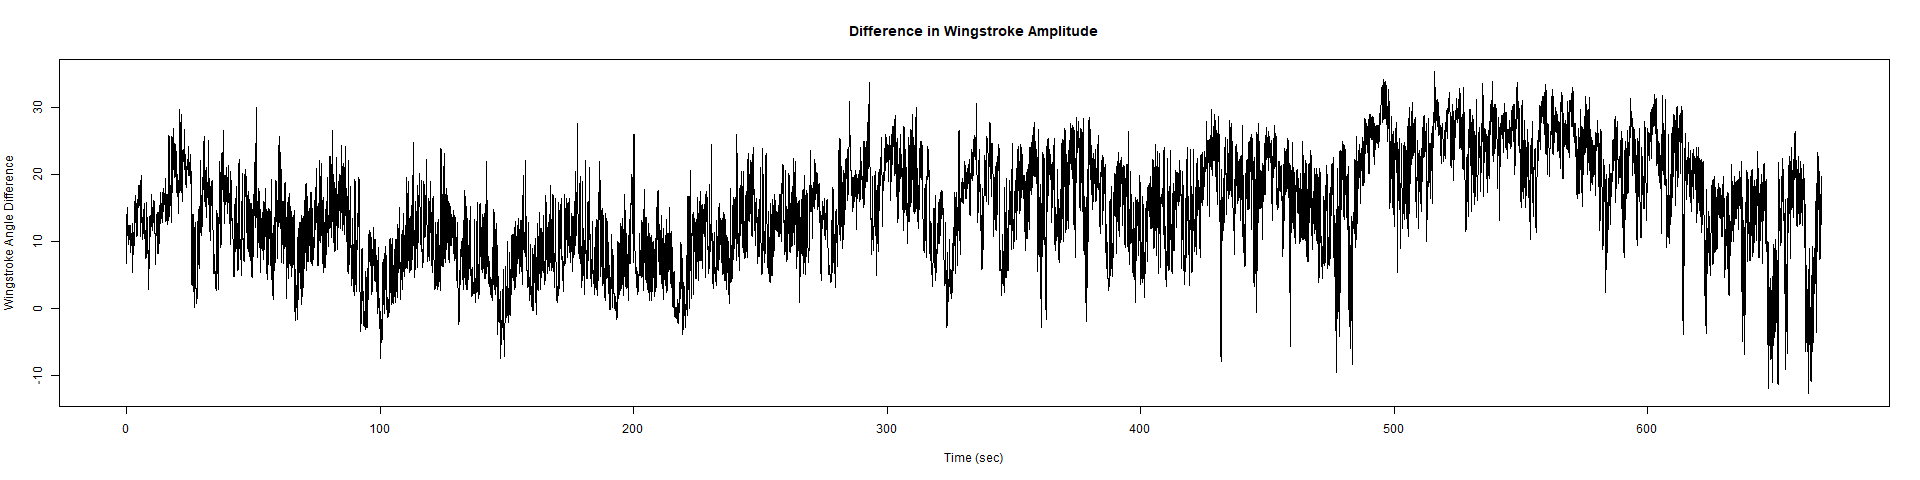
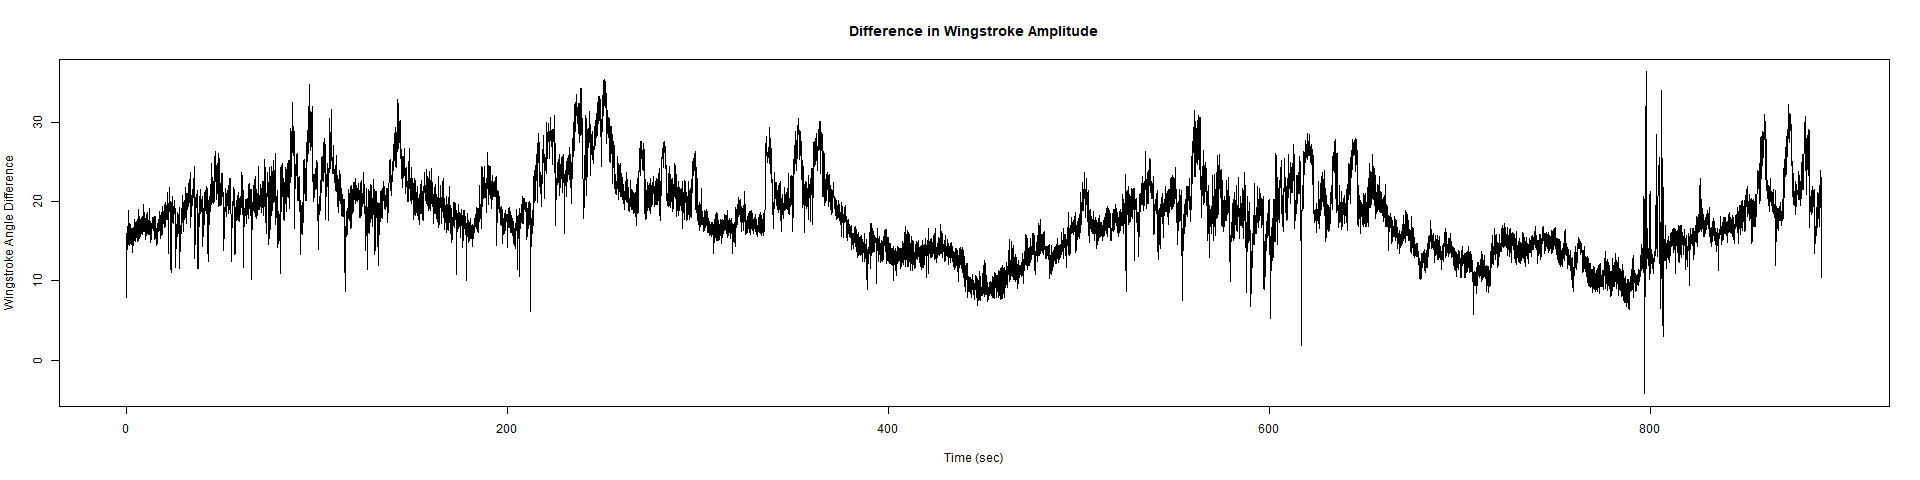
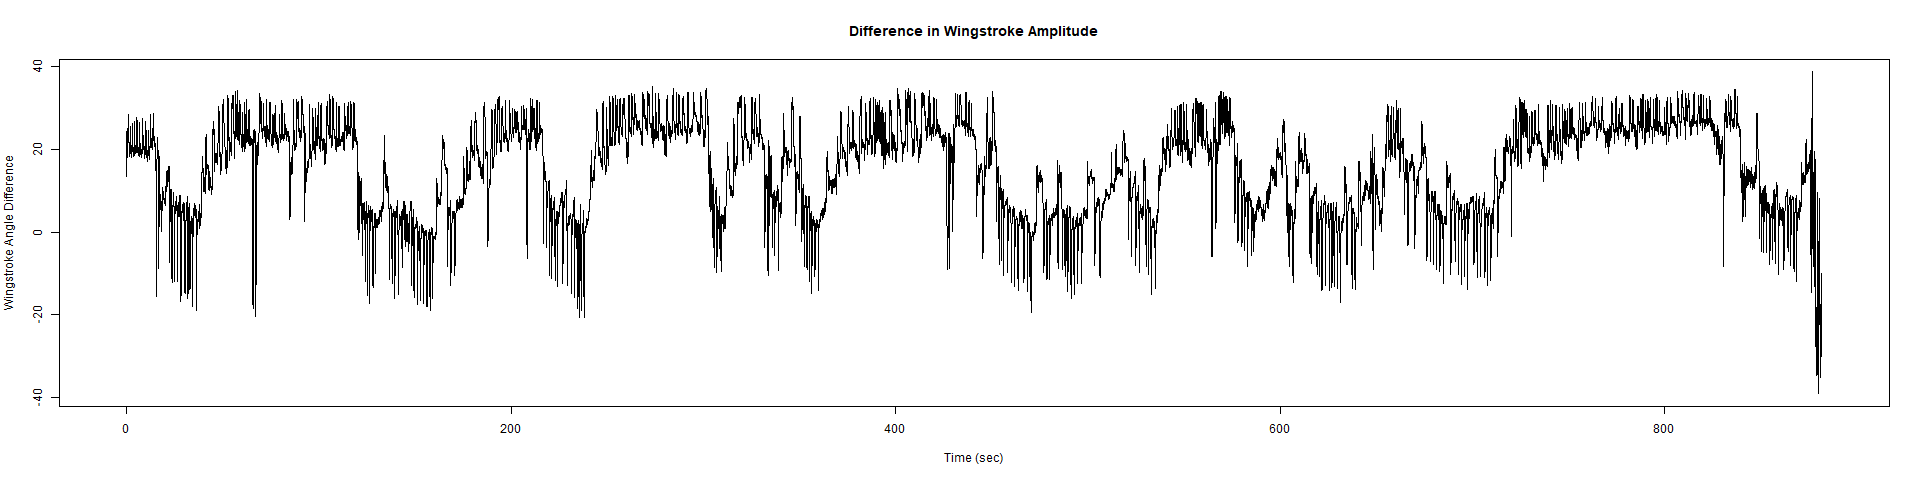
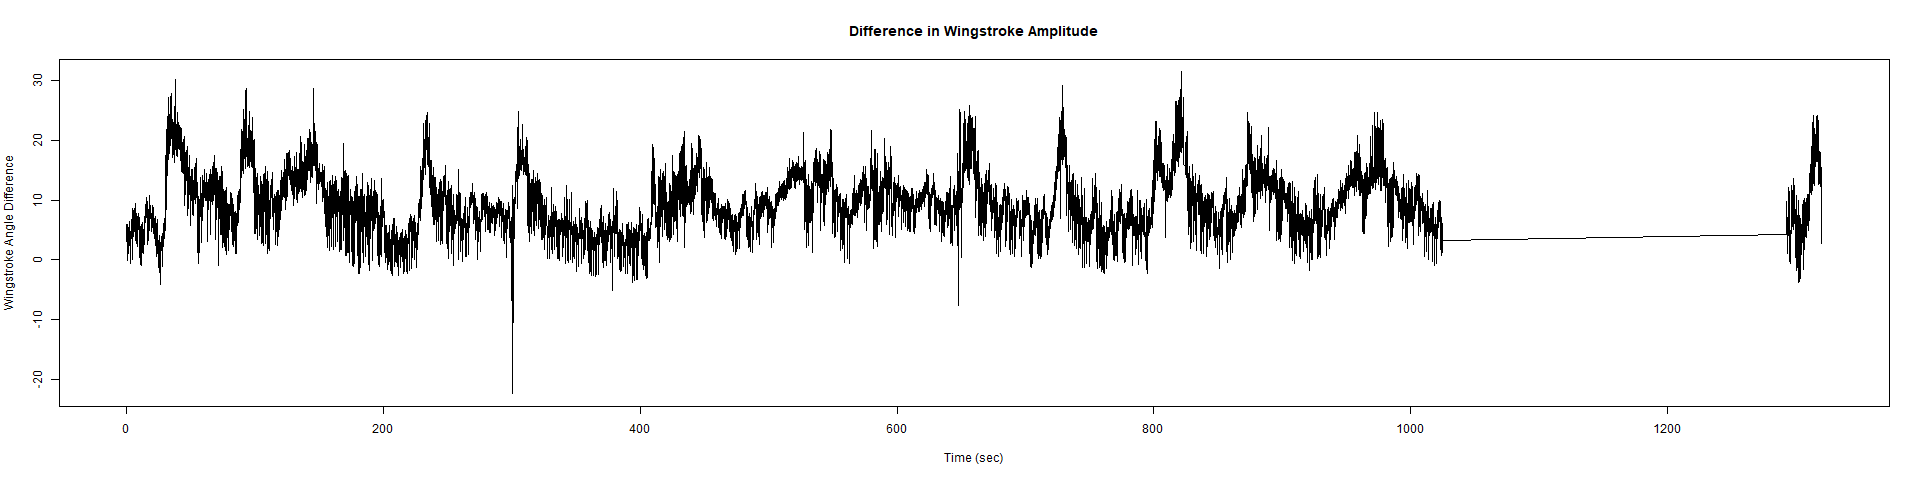
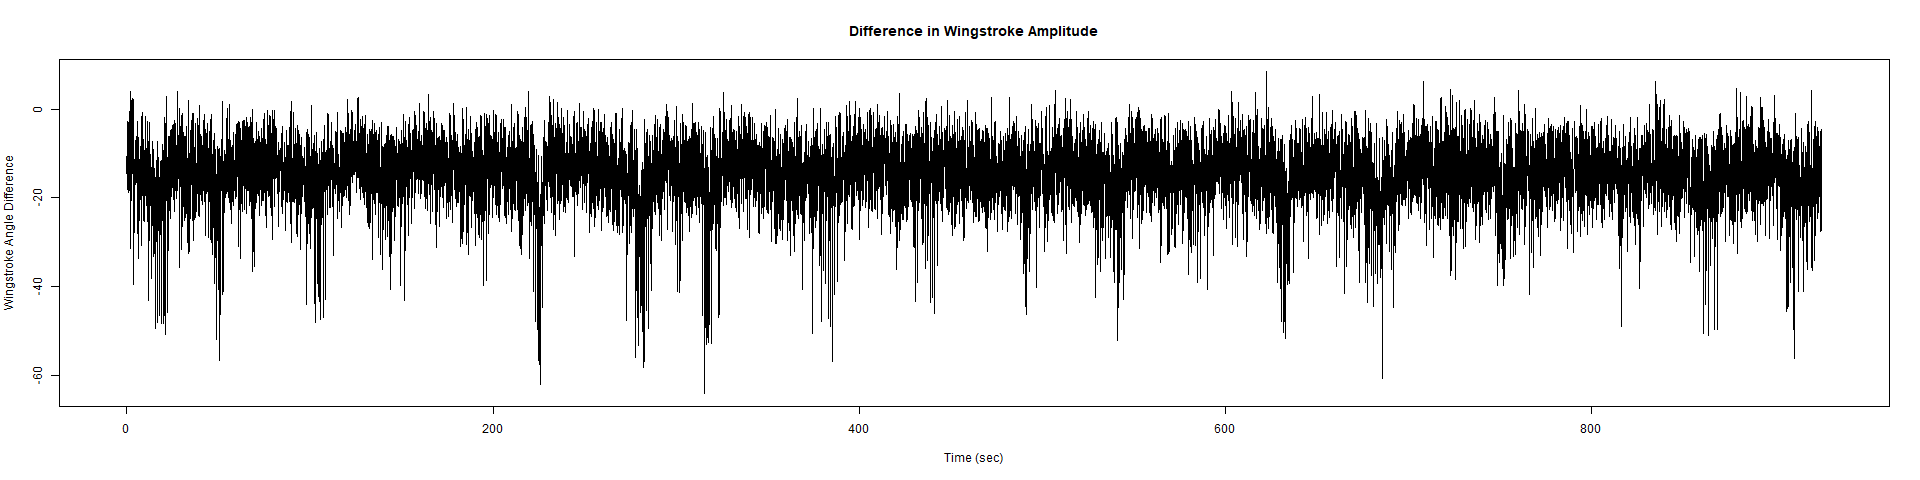
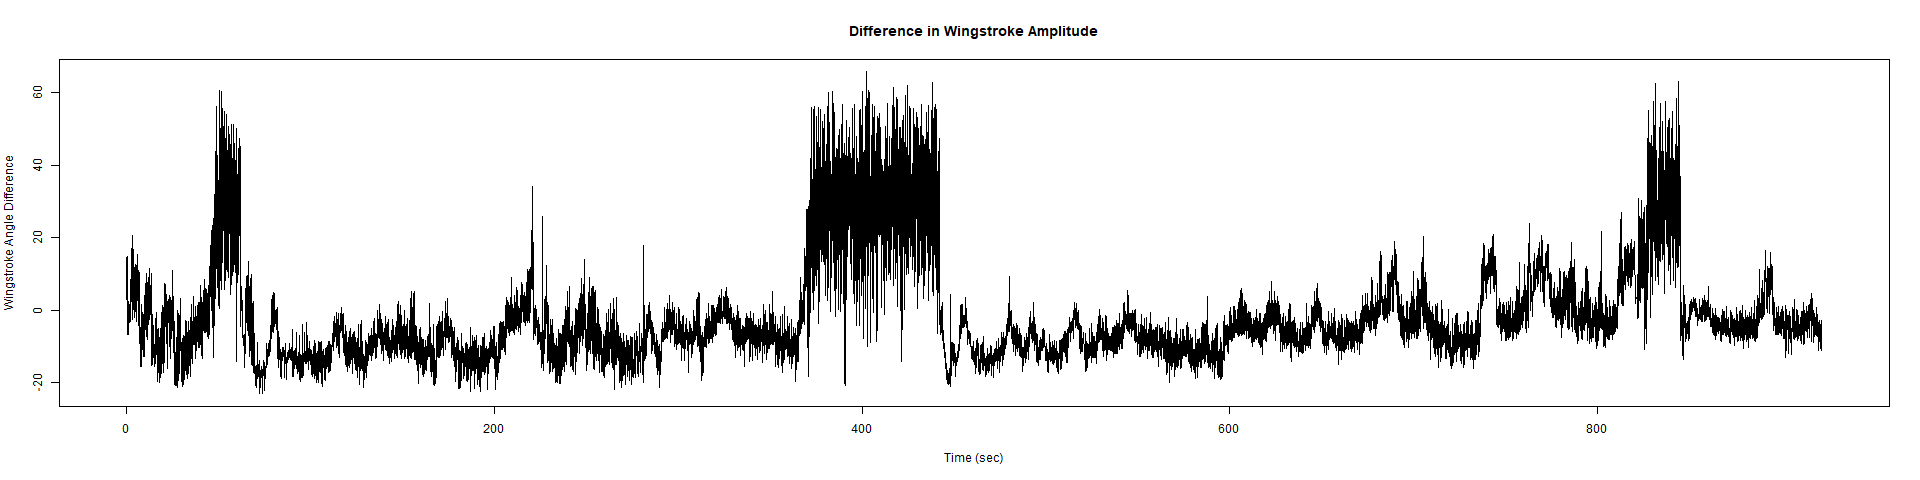
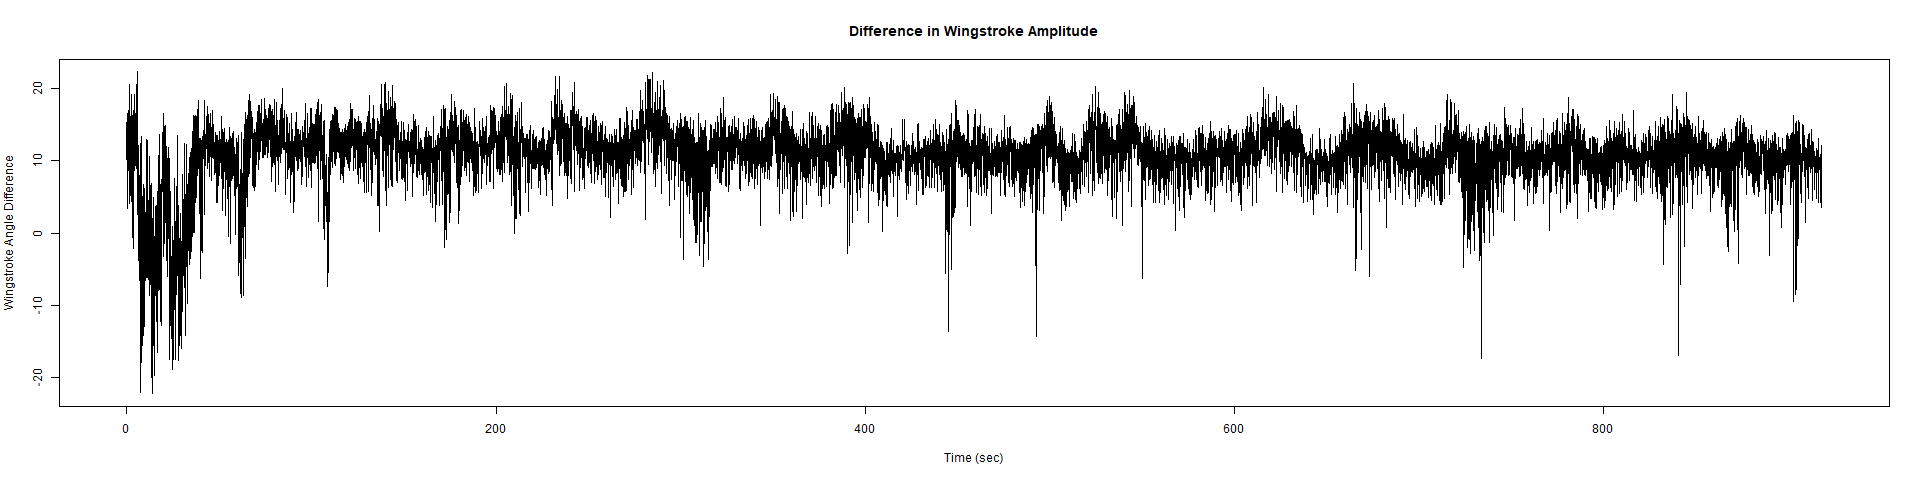
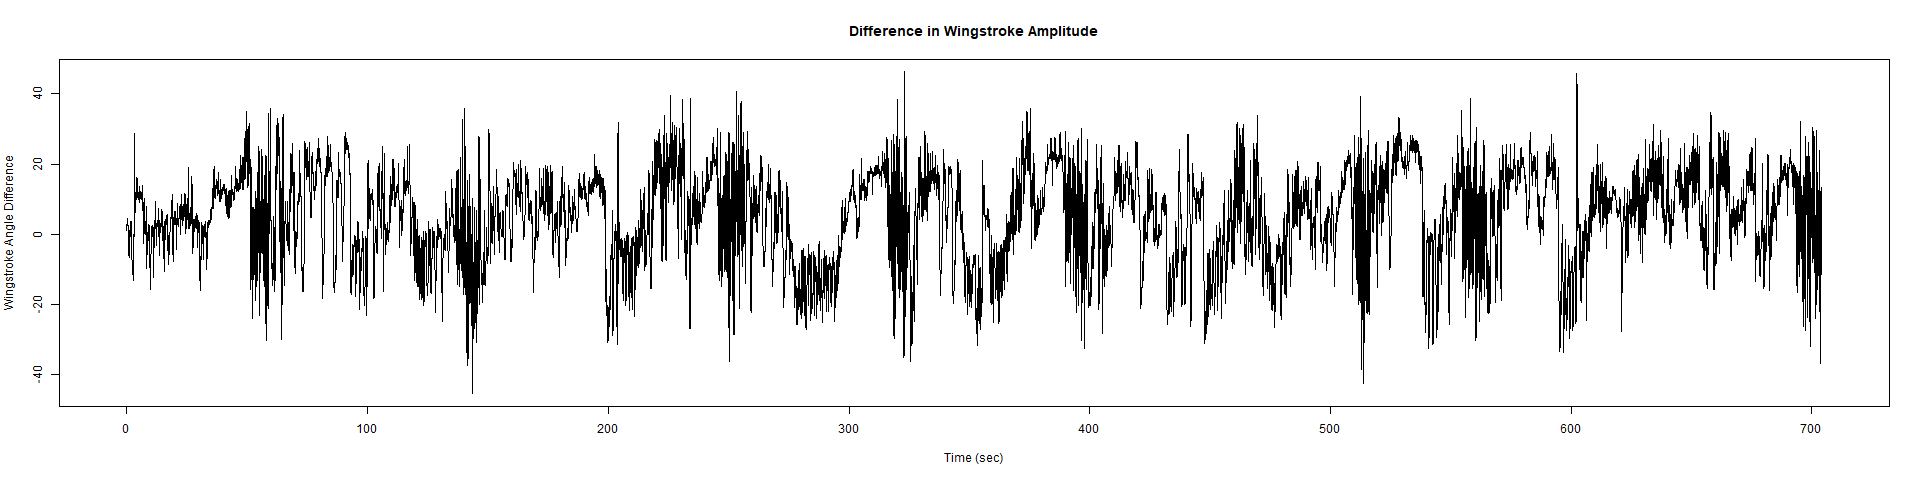
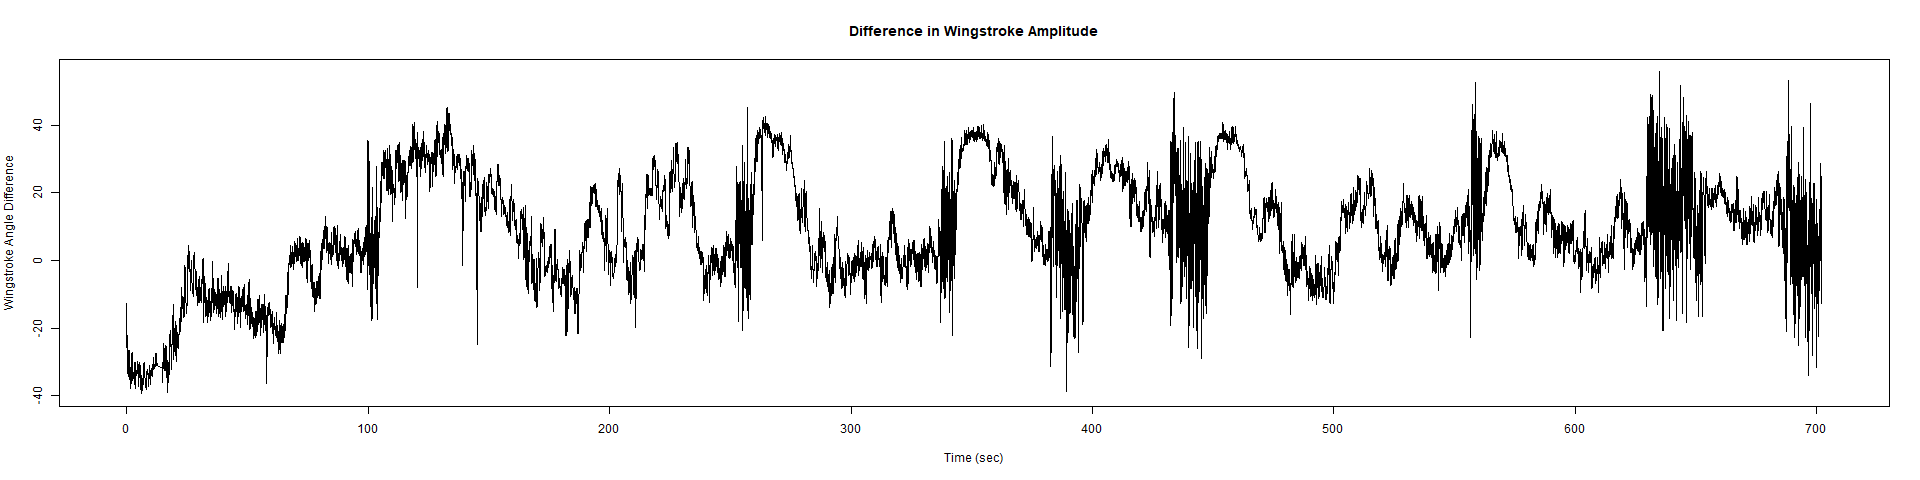
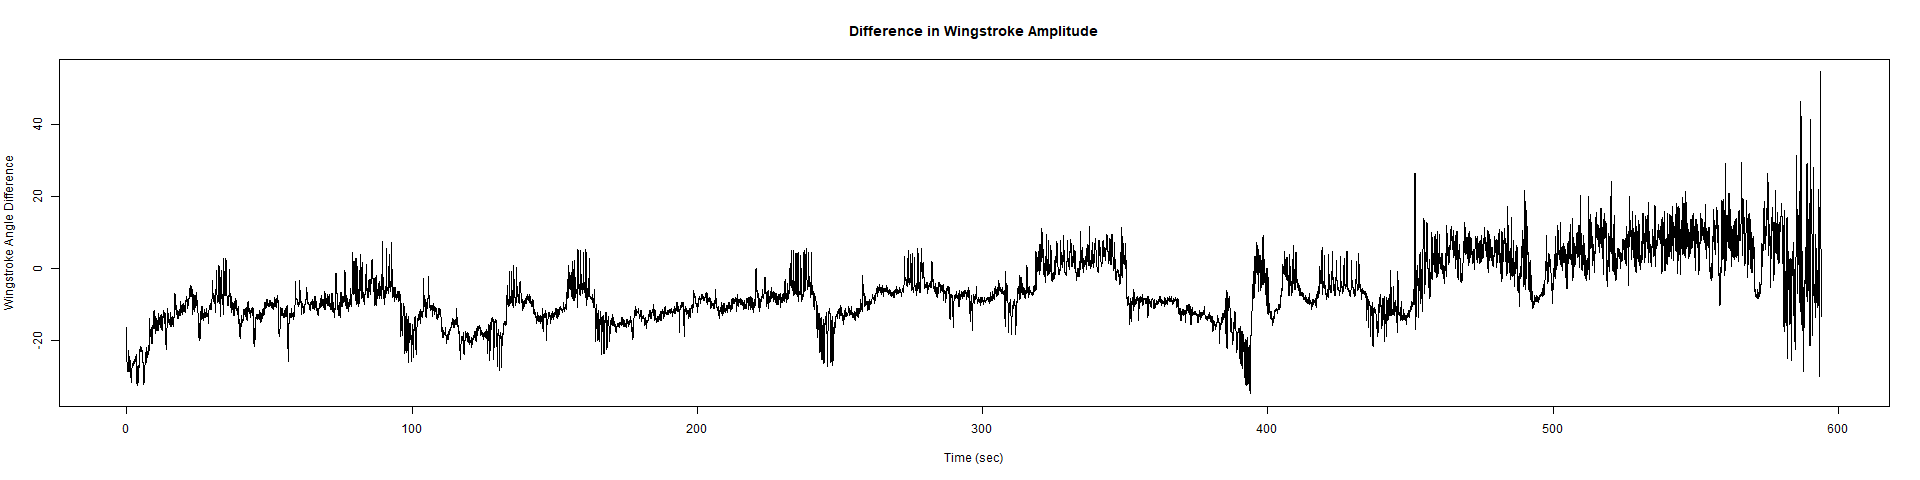
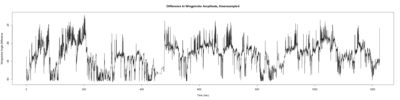
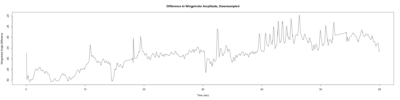
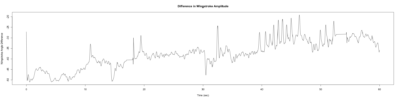
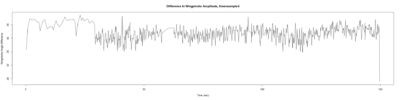
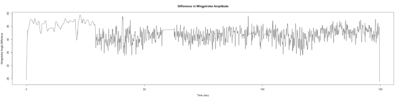
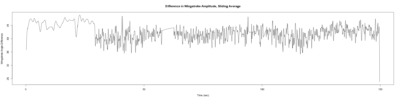
ElavGal4 x UASRyr65 “the wrong vials”
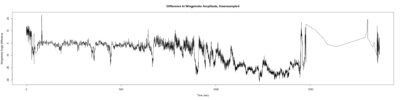
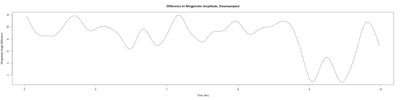
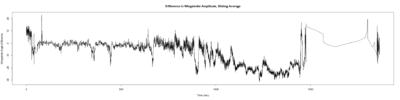
– > Graphs of the Trace.png (RightTrace – LeftTrace):

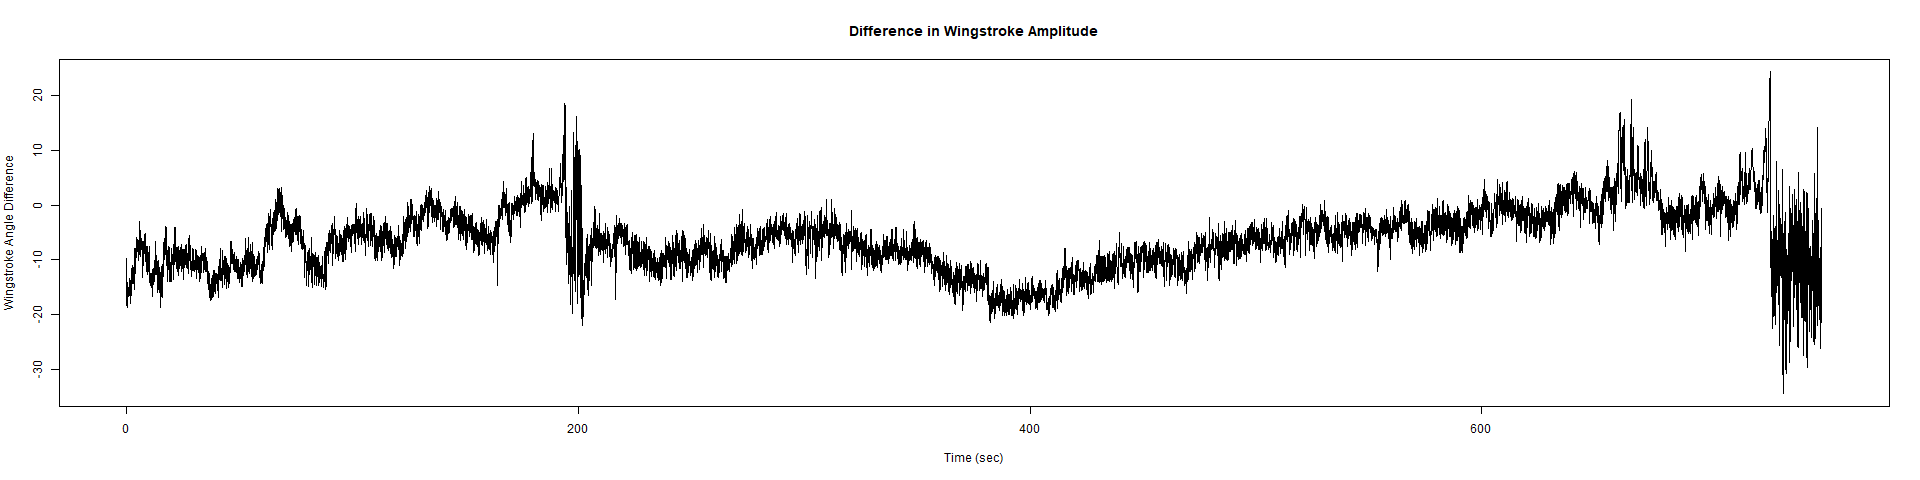
Category: Spontaneous Behavior, strokelitude, WingStroke | No Comments
Stroklitude Testing Pt. 2
on Monday, July 30th, 2018 1:52 | by Anokhi Kashiparekh


Monica:


Anokhi:


Category: open science, Spontaneous Behavior, strokelitude, WingStroke | No Comments
Stroklitude Data
on Monday, July 23rd, 2018 1:55 | by Anokhi Kashiparekh


Category: lab.brembs.net, R code, Spontaneous Behavior, strokelitude, WingStroke | No Comments
Sathish scripts in my hands are reproducing results
on Friday, May 18th, 2018 3:34 | by Christian Rohrsen
This is a picture of the supplemental figure from Maye et al. 2007
Below the results from the sathish scripts running on the data from Maye et al. 2007. It matches, so Sathish scripts in my hands work fine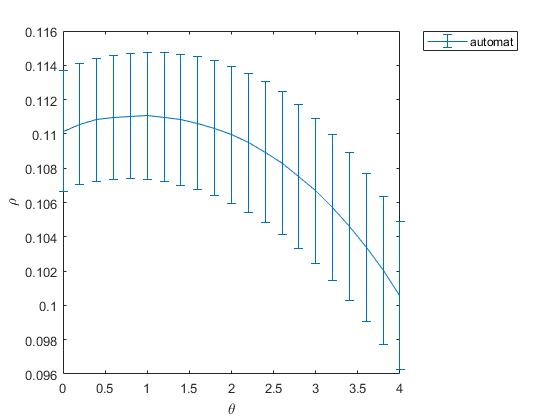
Category: flight, Spontaneous Behavior, strokelitude | No Comments
Confocal images and boxplots from my results in strokelitude
on Tuesday, May 15th, 2018 12:26 | by Christian Rohrsen
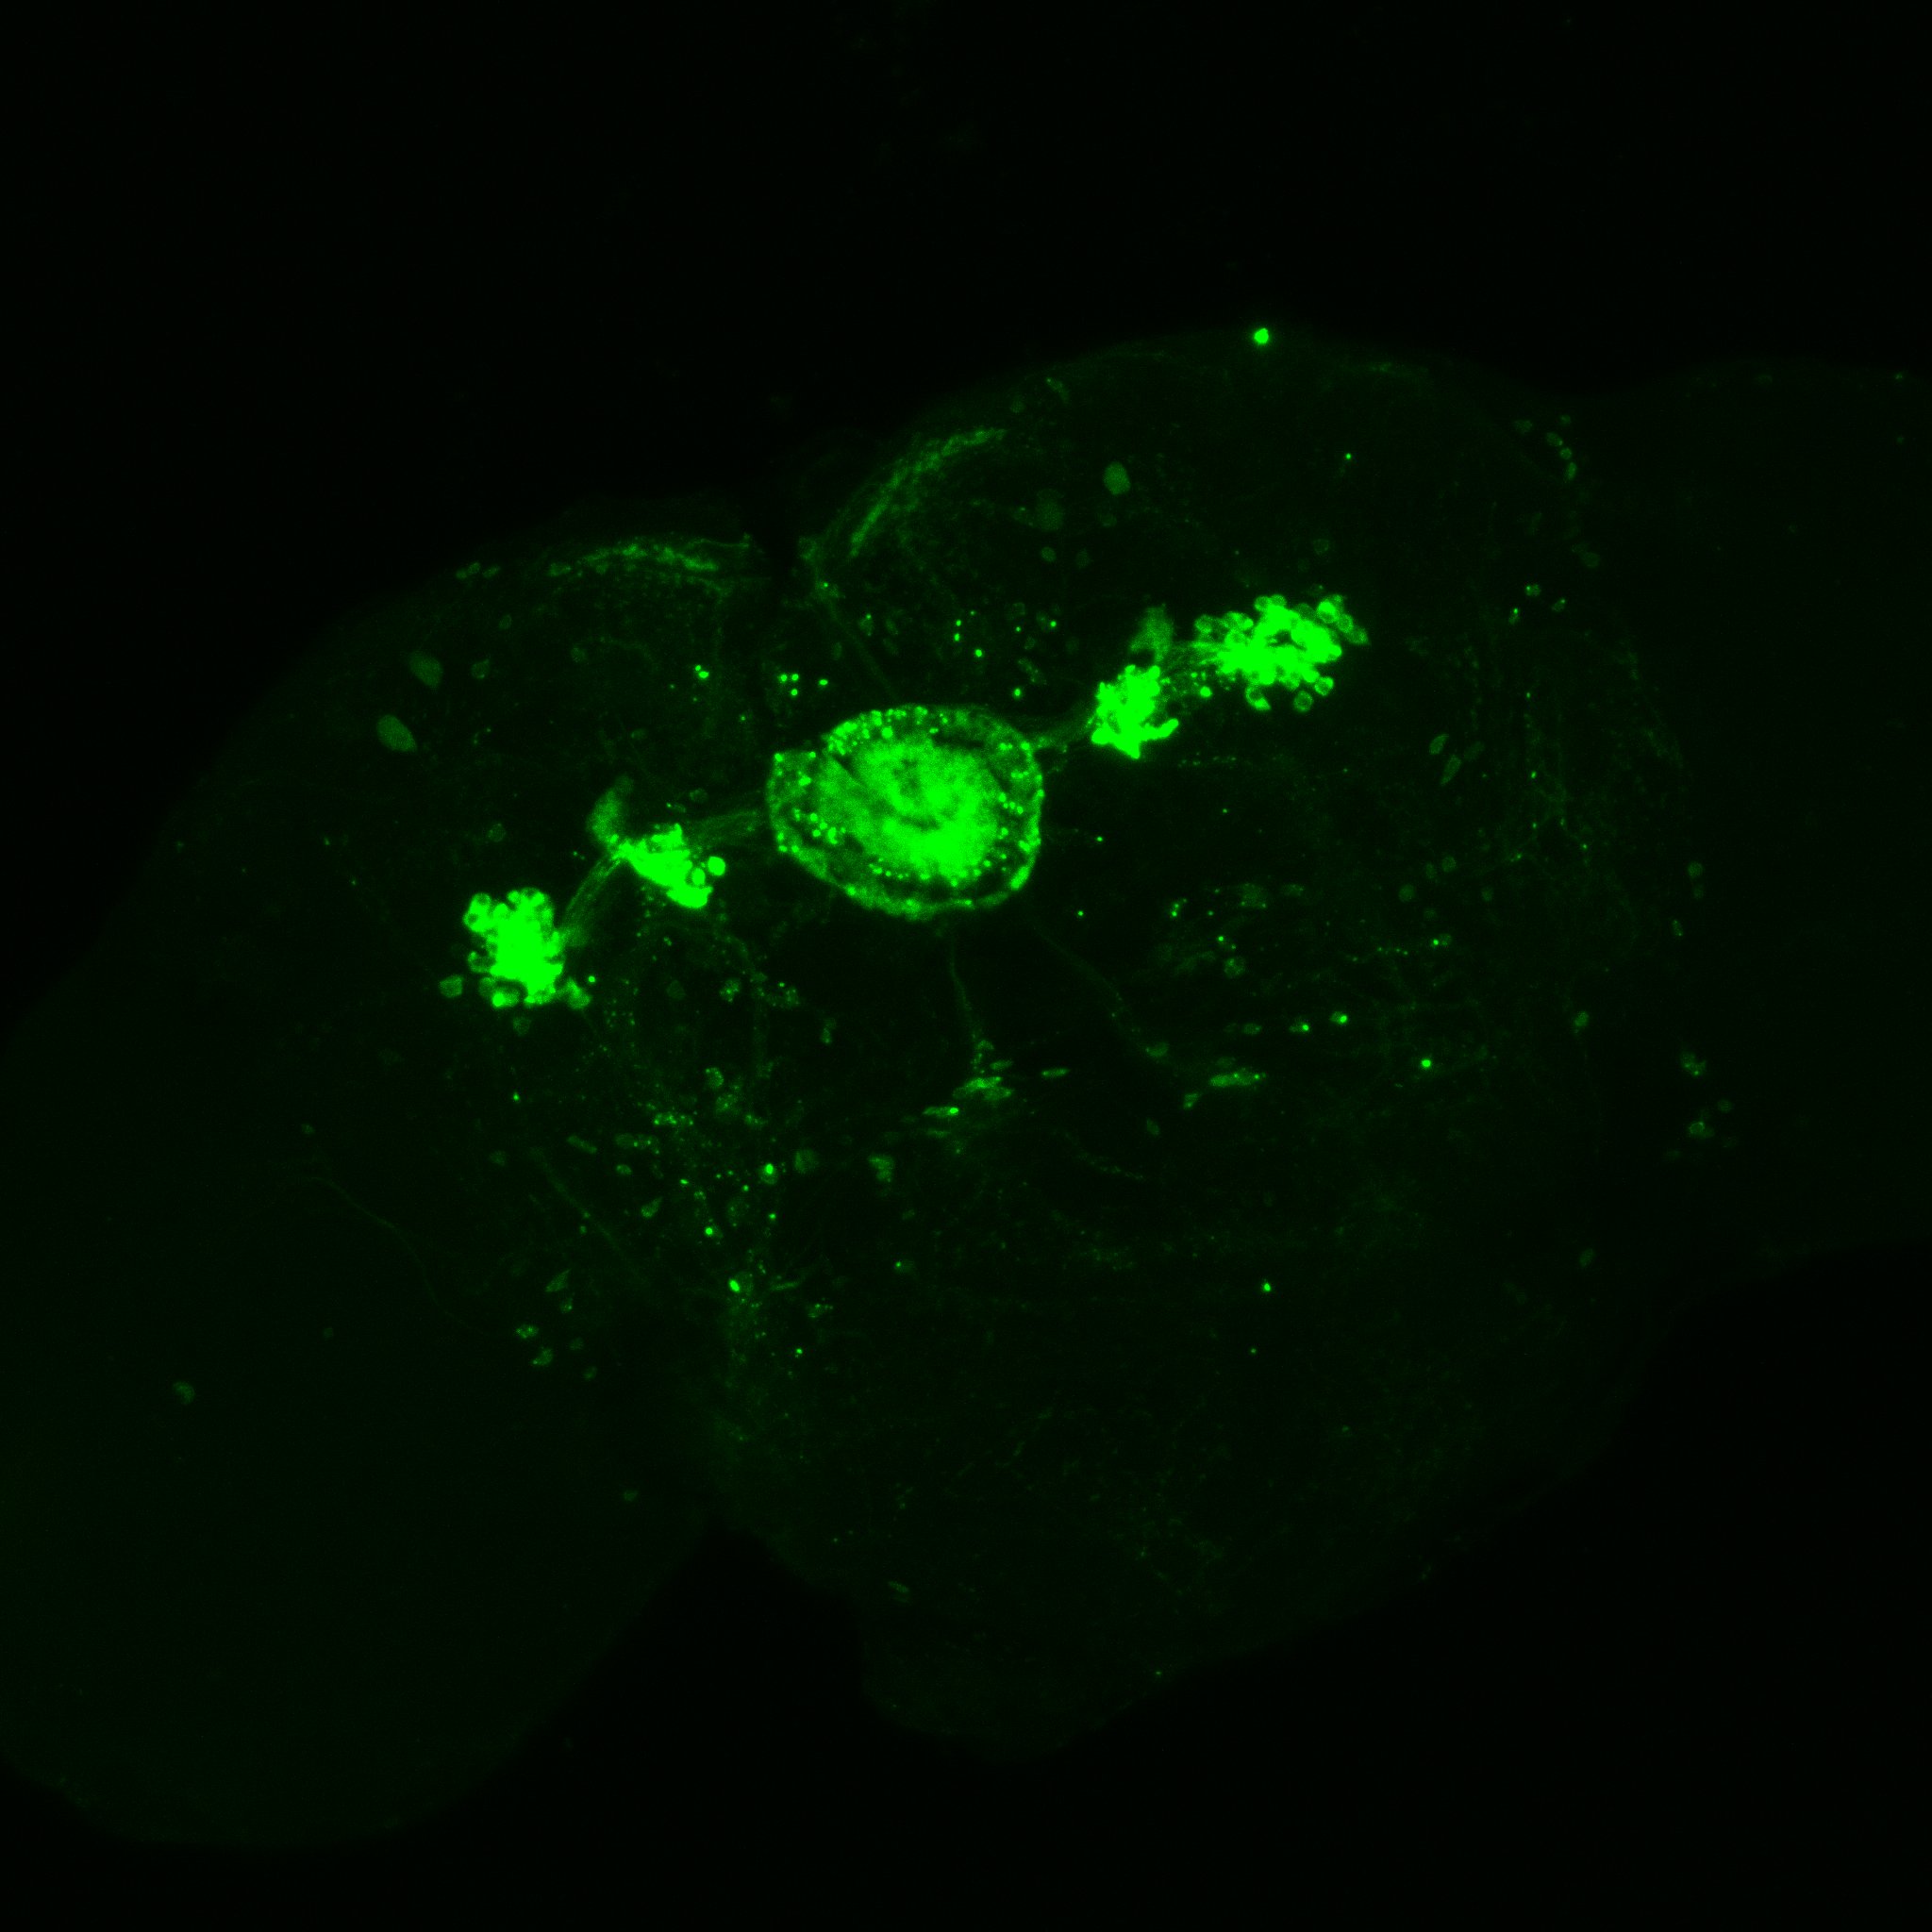
and at 40x
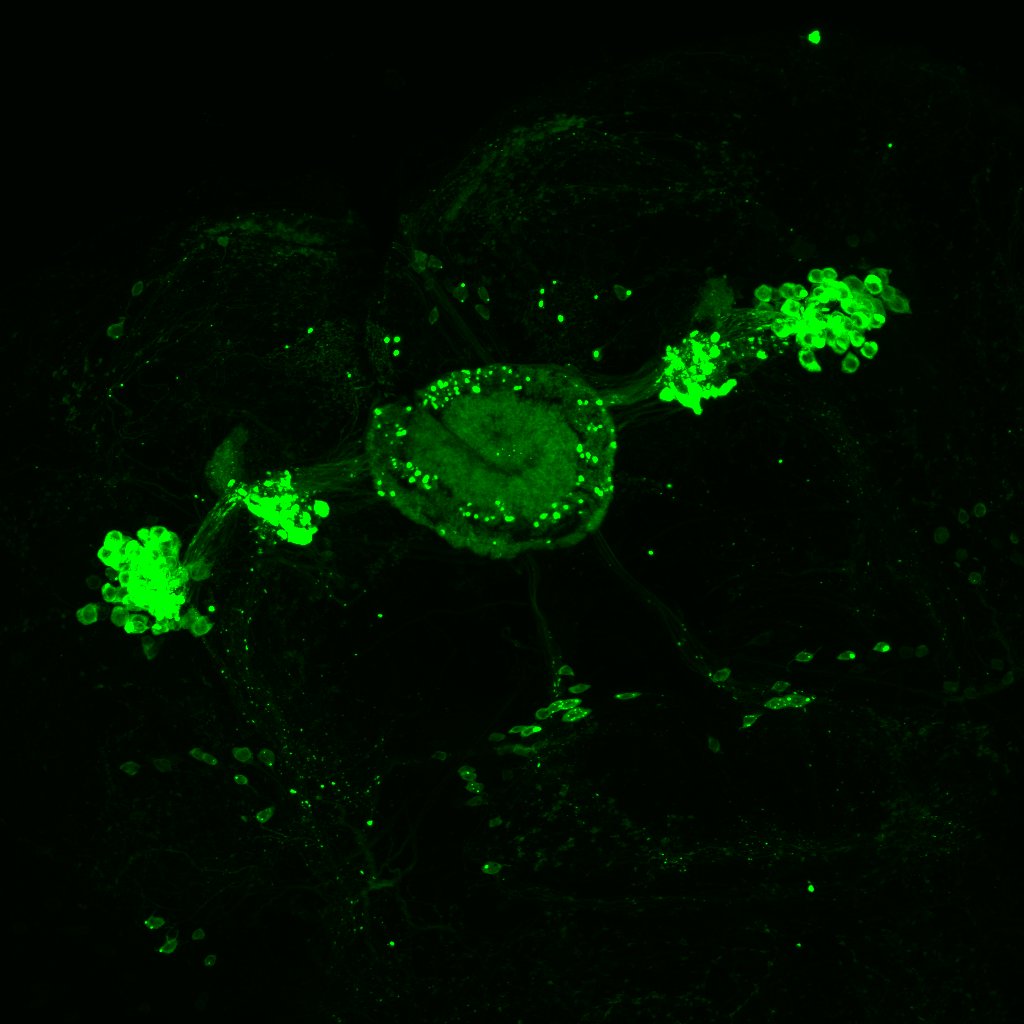
In this link we have a video of a 3D stainning pattern zoomed_CC
In addition I add here teh boxplots from the final results of the Ping Pong ball setup with these experiments 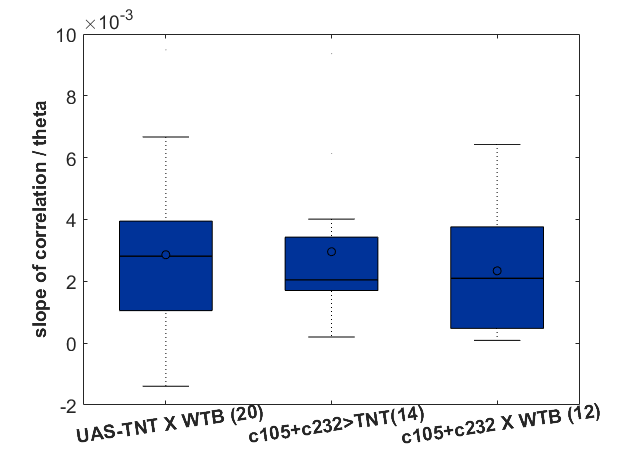
Category: Anatomy, flight, Spontaneous Behavior, strokelitude, WingStroke | No Comments
Nonlinearity is present the fast timescales
on Wednesday, April 4th, 2018 3:38 | by Christian Rohrsen
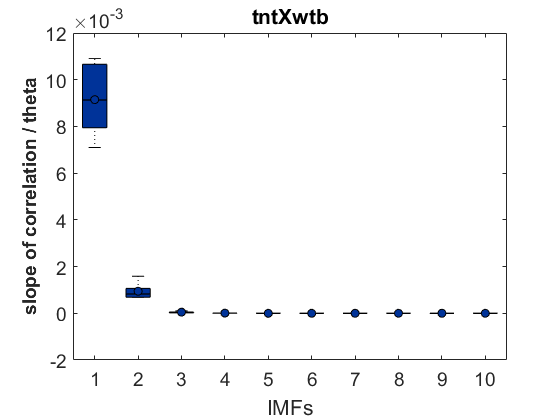
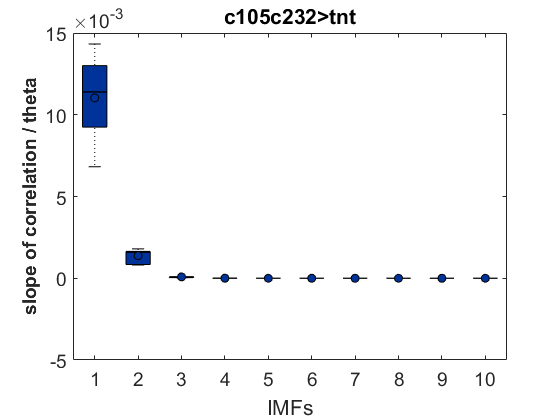
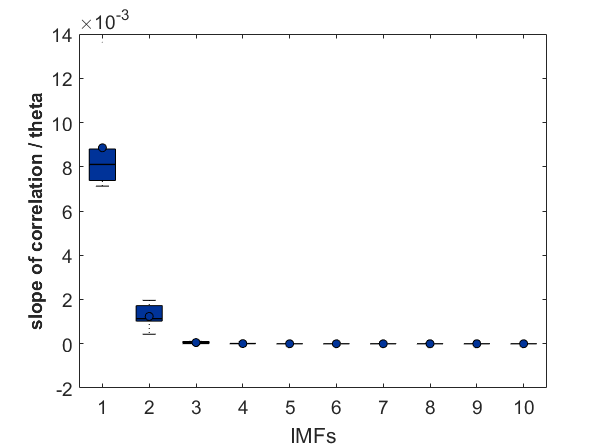
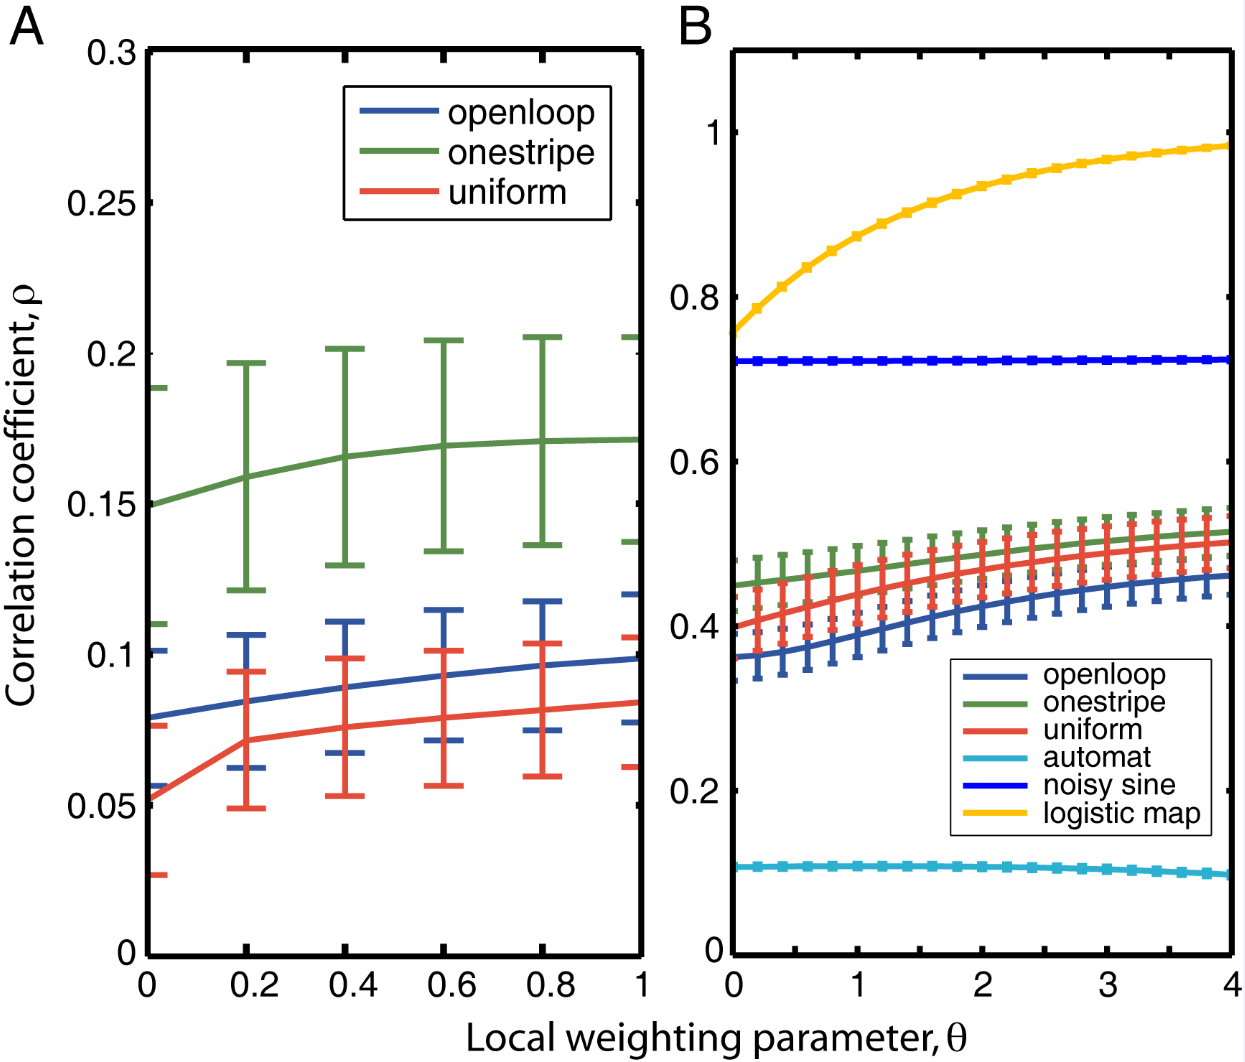
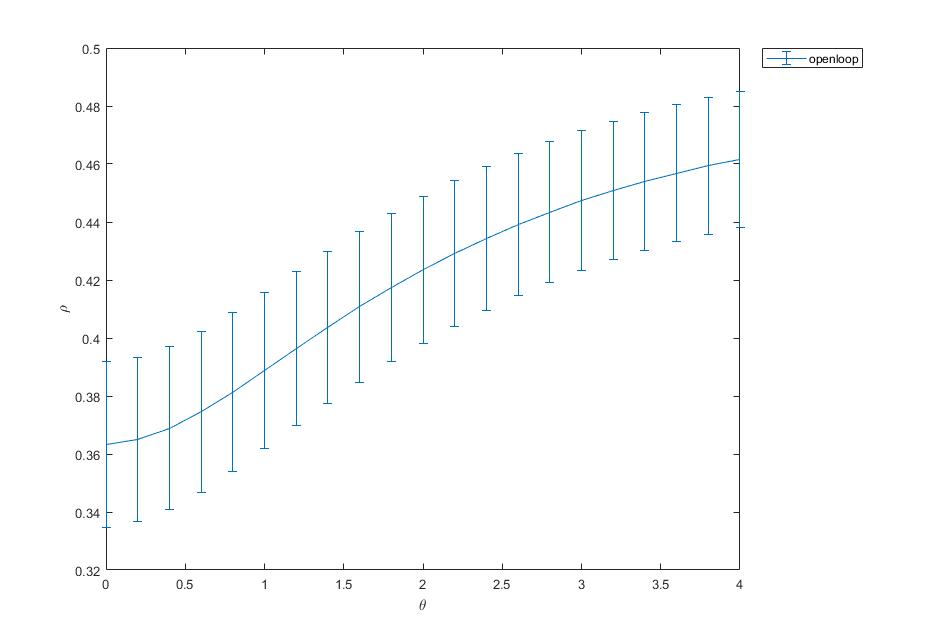
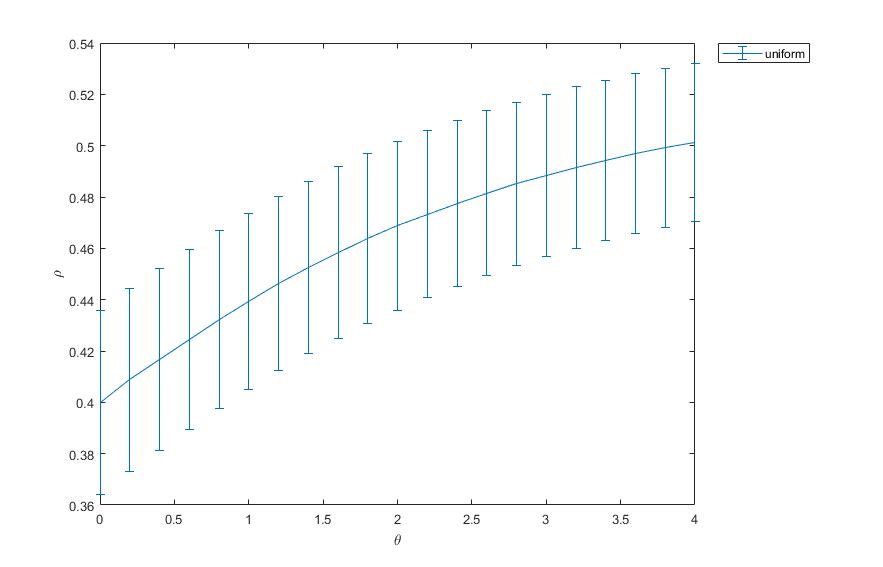
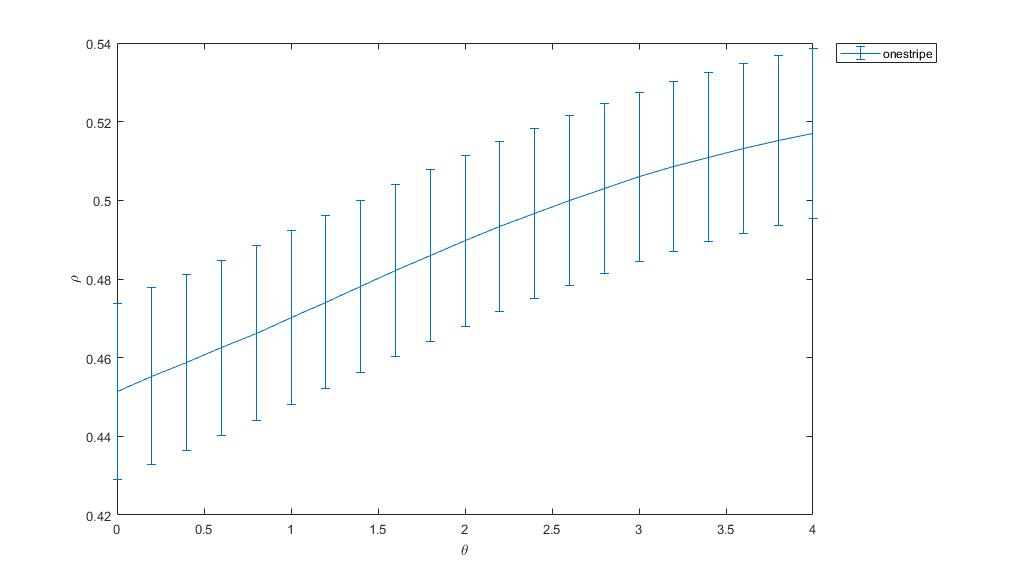
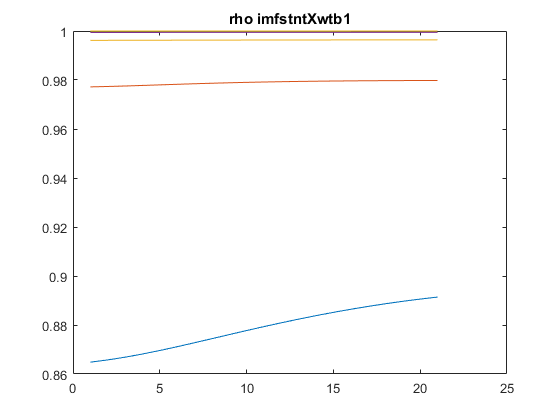
As a groundtruth I have used the same analysis pipeline for the traces in the uniform arena from Maye et al. 2007. Here the effect is even more pronounced at the fastest time scales. So I will conclude that this is real fly behavior and not noise that is shared among both setups: the Ping pong ball machine and the torquemeter. In order to gain more insights into the underlying flight structure I took one random flight trace to explain a few observations. The x-axis is the theta (that actually goes from 0-4 in steps of 0.2 and therefore we see the 21 points), in the y-axis is the correlation of the prediction to groundtruth. We see that IMF has a bigger slope, but not only that, also that its prediction correlation is around 0.88, whereas lower timescales prediction is basically perfect. That is, fast time scales are not only more nonlinear but also less unpredictable. This pattern is repeated in every fly measured
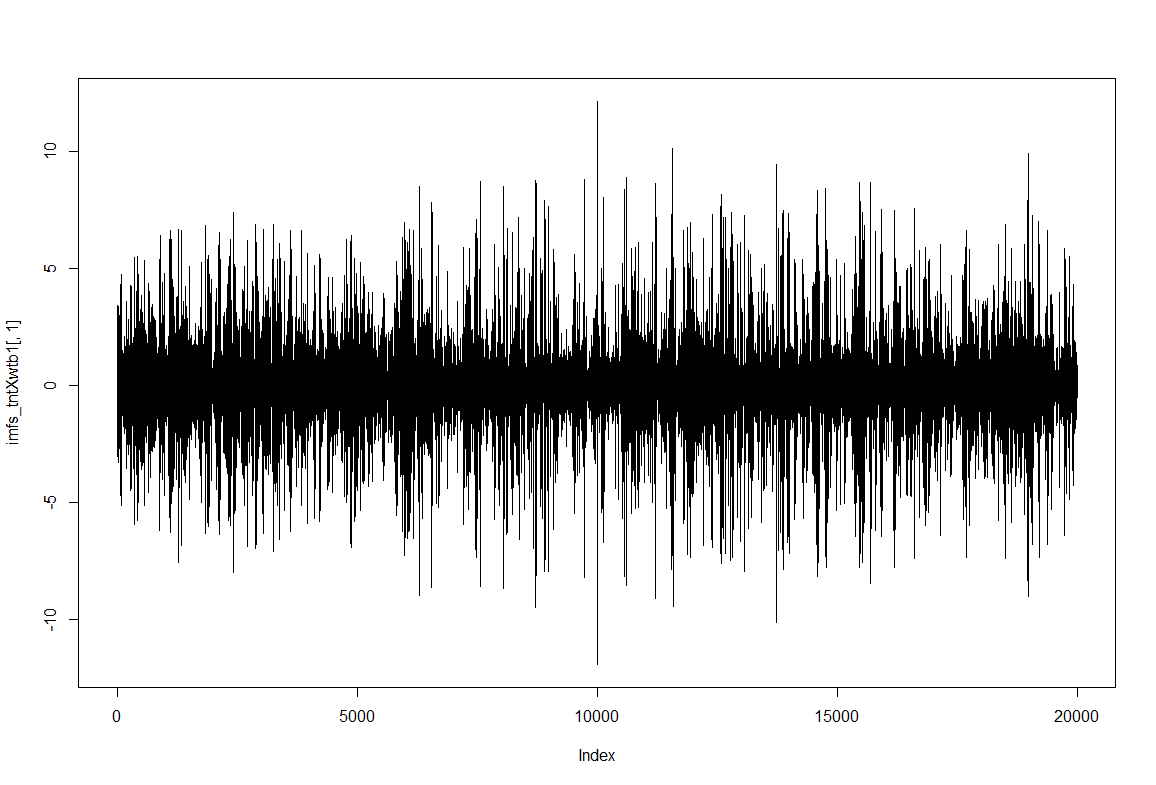
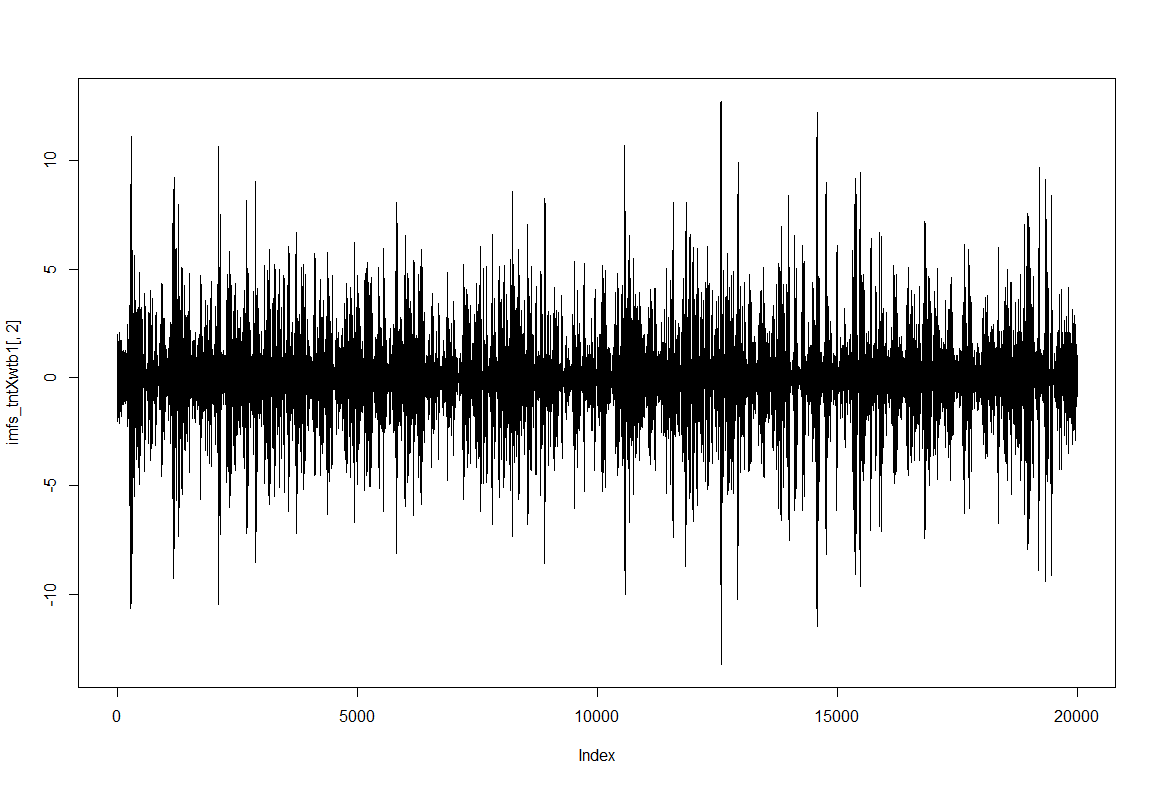
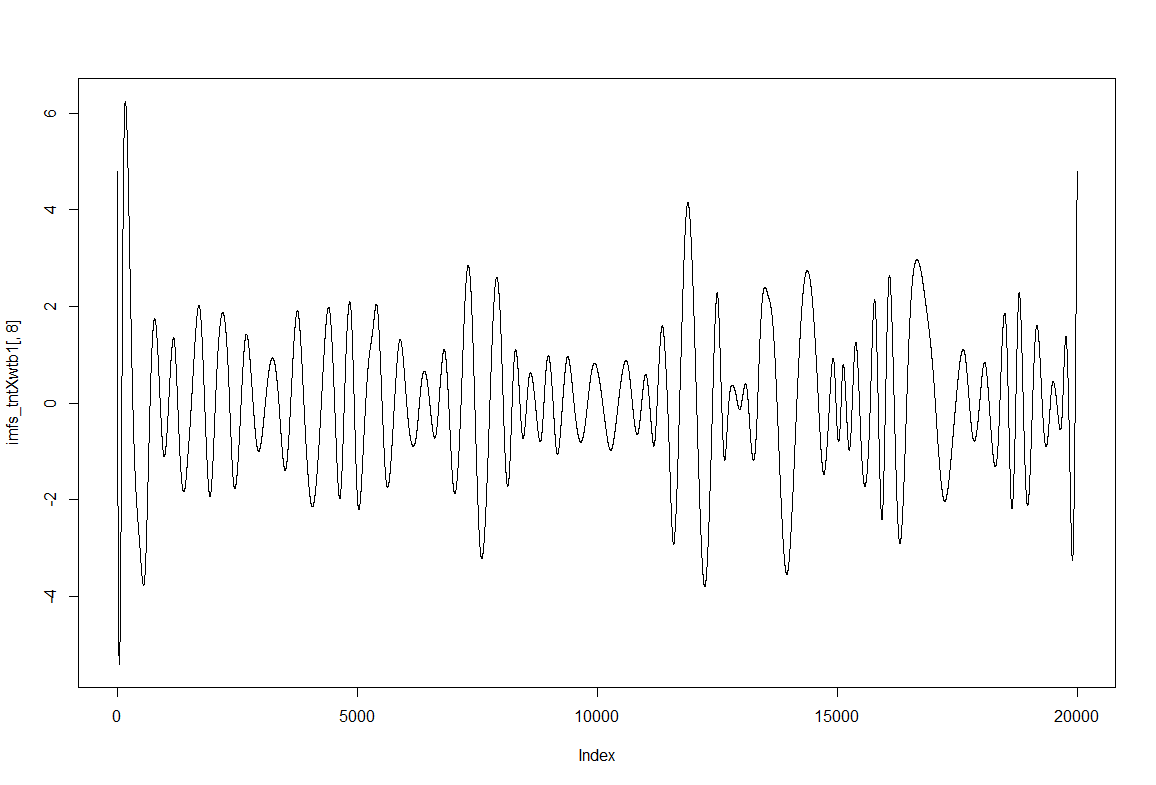
 To have an impression of how these IMF resultant traces look like: IMF1, IMF2 and IMF8
Category: Spontaneous Behavior, strokelitude, WingStroke | No Comments
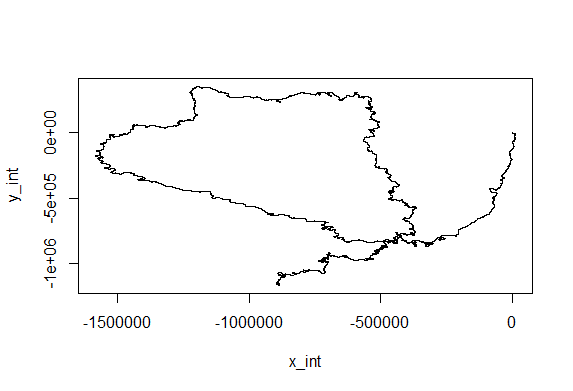
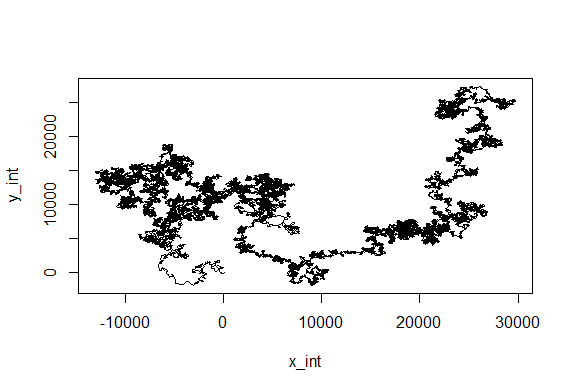
Just creating cartesian traces from polar coordinates
on Tuesday, March 27th, 2018 5:10 | by Christian Rohrsen
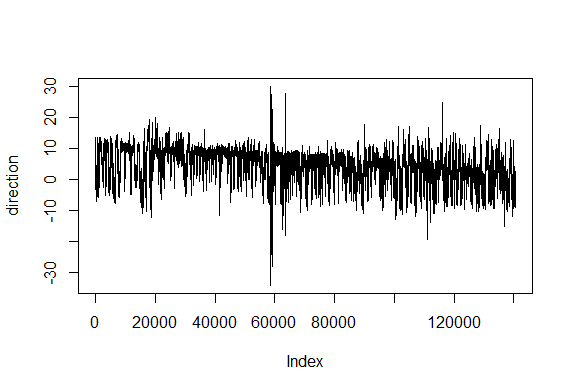
This is for the sake of playing and curiosity. I made out of these two traces a modelling of their flying trace in a 2D world. Direction is right wing amplitude – left wing amplitude and distance flown is dependent on the sum of both (more amplitude of both, more forward thrust). Funny enough, the second one looks kind of fractal, which is characteristic of chaotic behaviors. If there is any comment to add to this new visualization, all ears!
Category: Spontaneous Behavior, strokelitude, WingStroke | No Comments