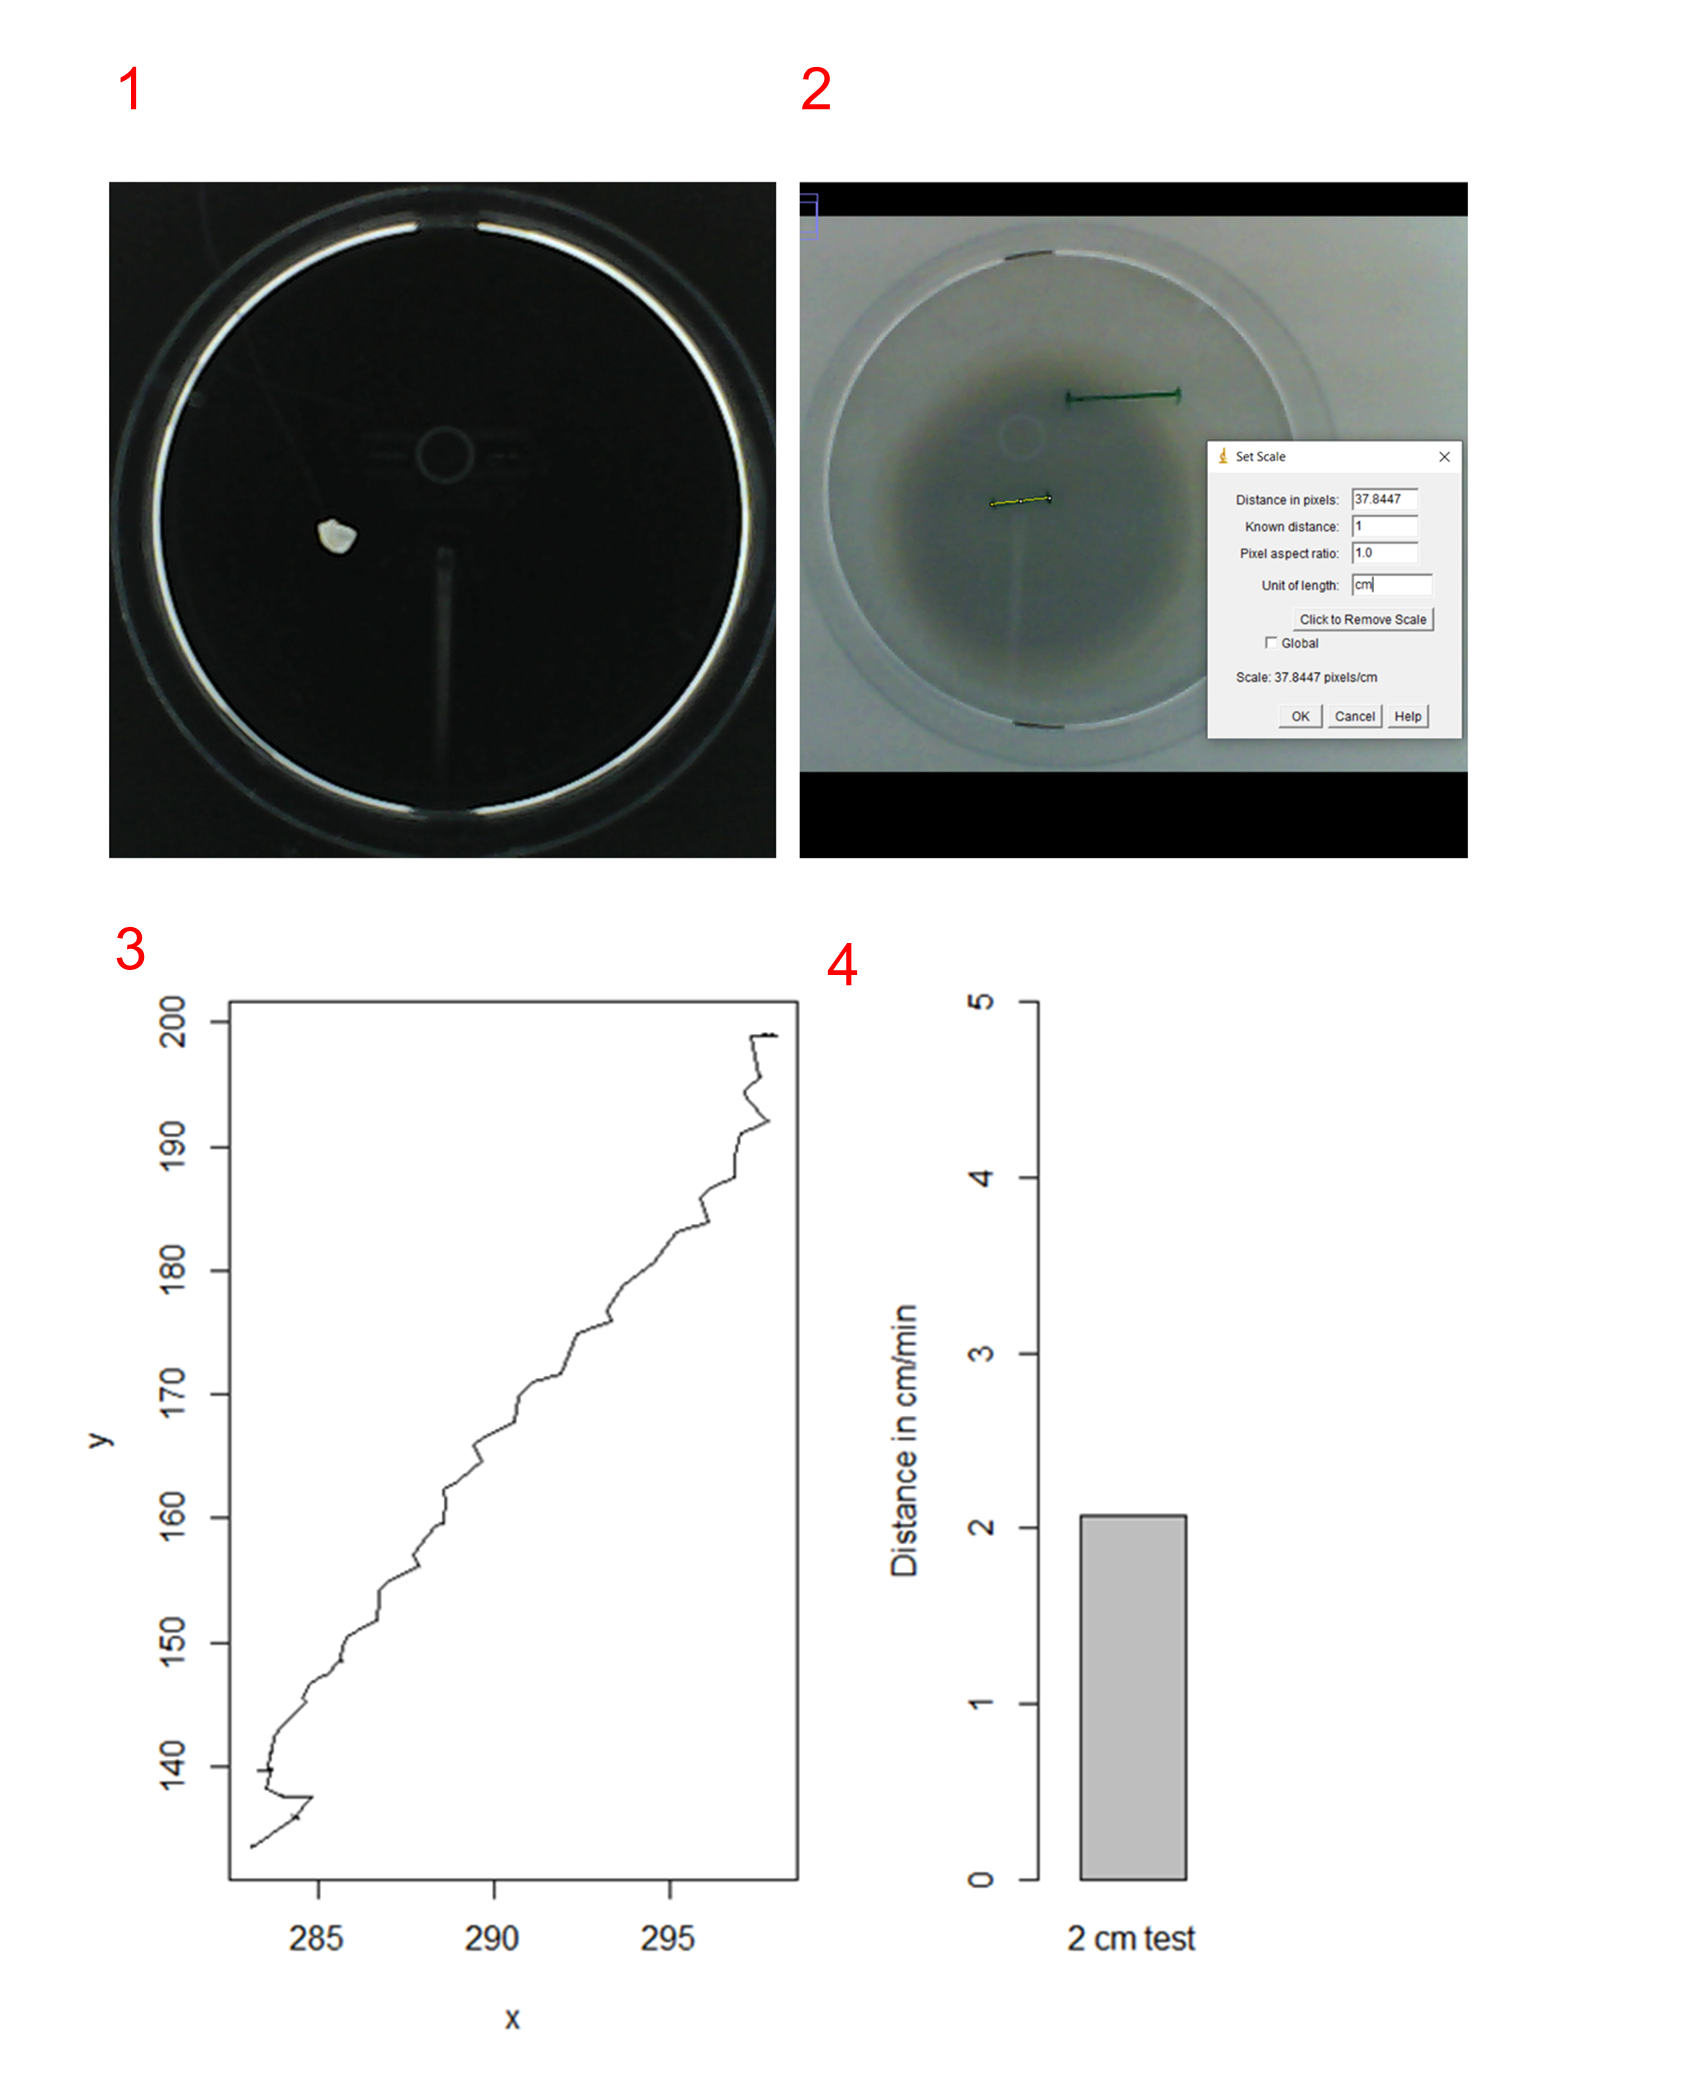
1) Small paper ball to simulate a larva, attached to a black string, and moved 2 cm by hand. 2) Measuring the pixel distance of a known real life distance (1 cm). 3) Plot of x and y coordinates shows trajectory of the object. 4) Bar plot of the real life distance shows that tracking and the R code worked .
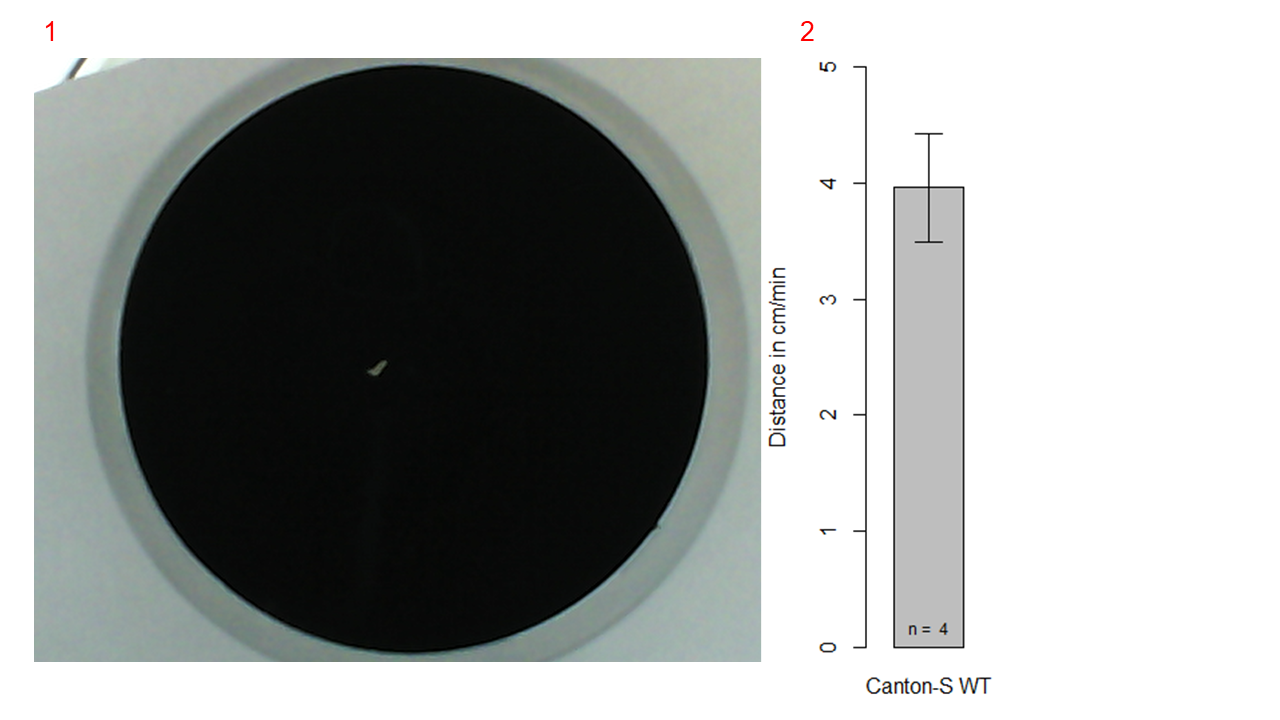
Distance tracking of Canton-S wild type larvae
1) Larva on agar plate dyed with activated charcoal 2) Barplot of the distance of the Canton-S WT larvae
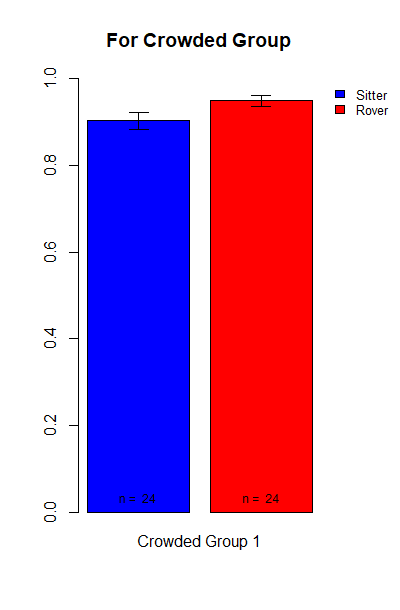
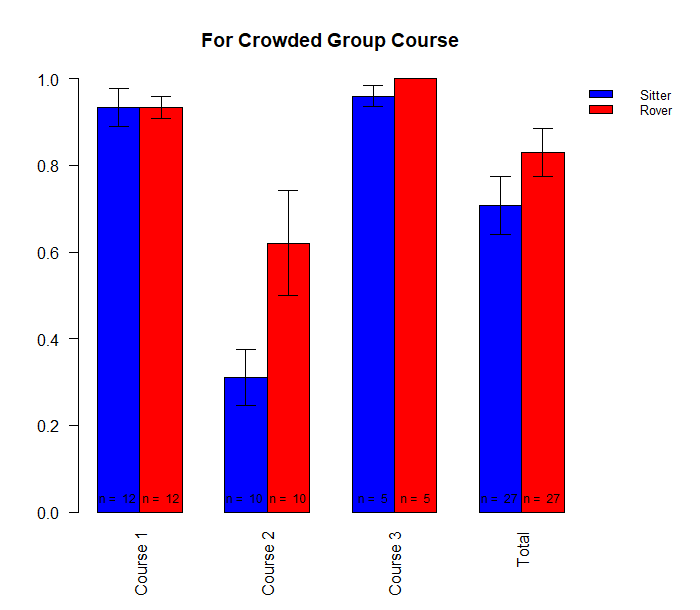
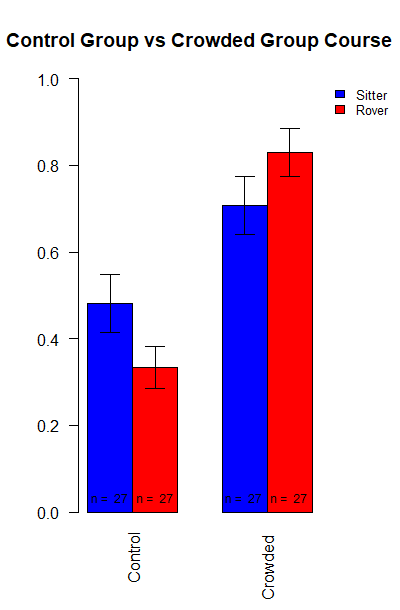
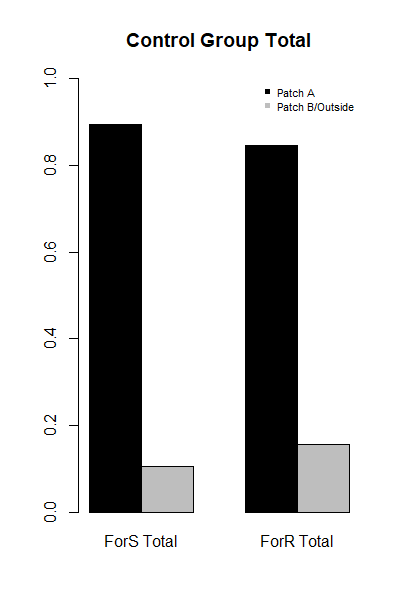
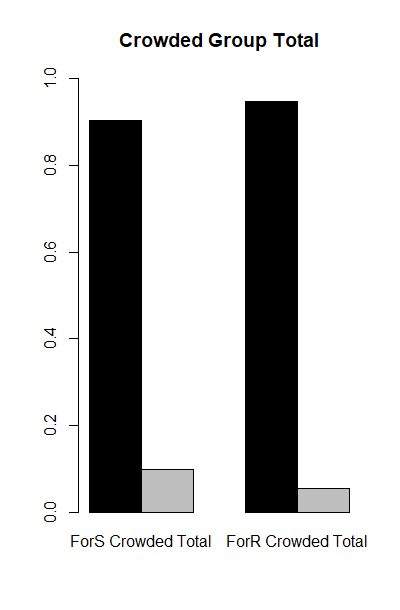
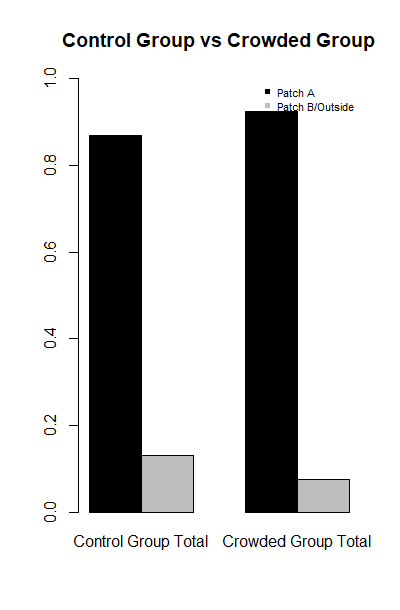
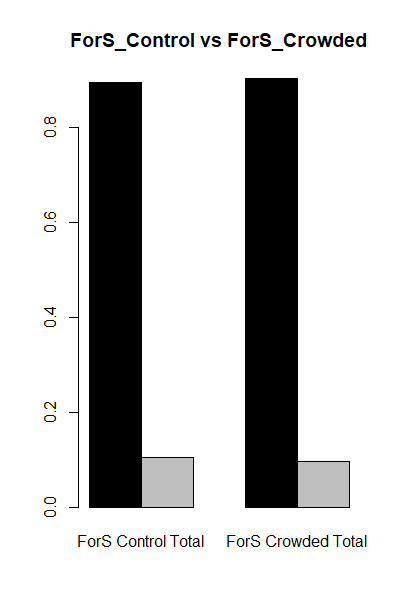
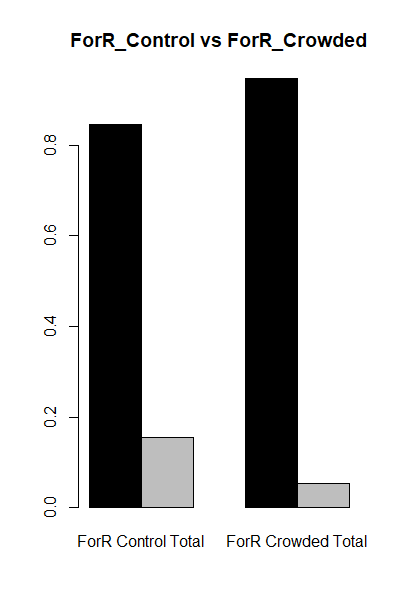
I have tested 514 larvae from the forR/forS Control Group and 480 larvae from the forR/forS Crowded Group. Here are the results:
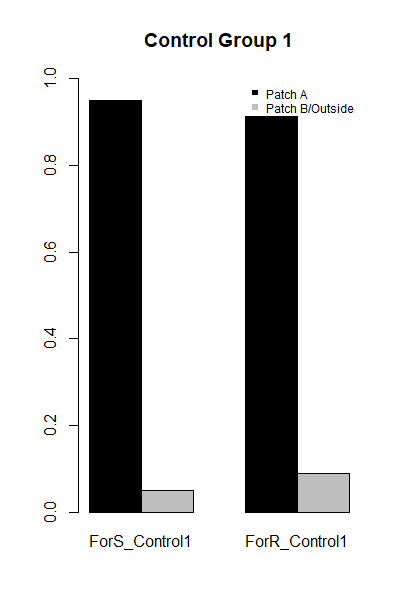
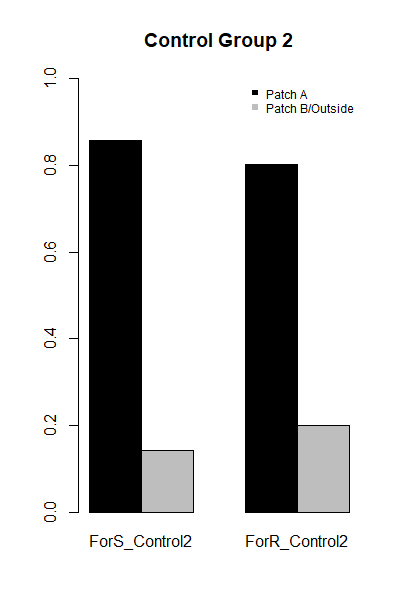
Here you can see the first Control Group I have tested 2 weeks ago. In total 203 larvae were tested (ForS: 101, ForR 102). Rover larvae left the food patch moren often, however there is only a small difference between the Groups: 4,95 percent of the sitter larvae and 8,82 percent of the rover larvae left the first food patch after 20 minutes.Here you can see the second Control Group, which had a lower density compared to the first Control Group. 311 larvae were tested (155 sitter, 156 rover). Again rover larvae left the food patch more often than sitter larvae, however there is only a small difference between the groups. 14,19 percent of the sitter larvae and 19,87 percent of the rover larvae left the first patch. Interestingly both groups seemed to leave the first food patch more often compared to the first control group with a little bit higher density.Here you can see the entire ForS/ForR Control Group (256 sitter larvae, 258 rover larvae). 10,55 percent of the sitter larvae and 15,50 percent of the rover larvae left the first food patch after 20 minutes.Here you can see the entire ForR/Fors Group under crowded conditions. 236 sitter larvae and 244 rover larvae were tested. 9,75 percent of the sitter larvae and 5,33 percent of the rover larvae left the food patch A after 20 minutes.Here the entire rover/sitter Control Group and Crowded Group were compared. 13,04 percent of the rover and sitter larvae from the Control Group left the first food patch whereas only 7,50 percent of the entire larvae from the Crowded Group left the first patch. So at least there seems to be an effect of the forage competition/food quality on the foraging behaviour.This effect seems to come nearly exclusively from the forR Group.