Making sense of dwelling data
on Tuesday, March 24th, 2020 12:54 | by Anders Eriksson
Mean or median?
| Unpunished | Punished | |
| 100 | 1 | |
| 1 | 3 | |
| 1,2 | 1 | |
| 0,5 | 2 | |
| 0,3 | 5 | |
| 5 | ||
| Mean | 18 | 2,4 |
| Median | 1,1 | 2 |
A highly hypothetical scenario of how the distribution of dwelling times could be. Even if unrealistic, it still illustrates the problem of using median instead of mean.
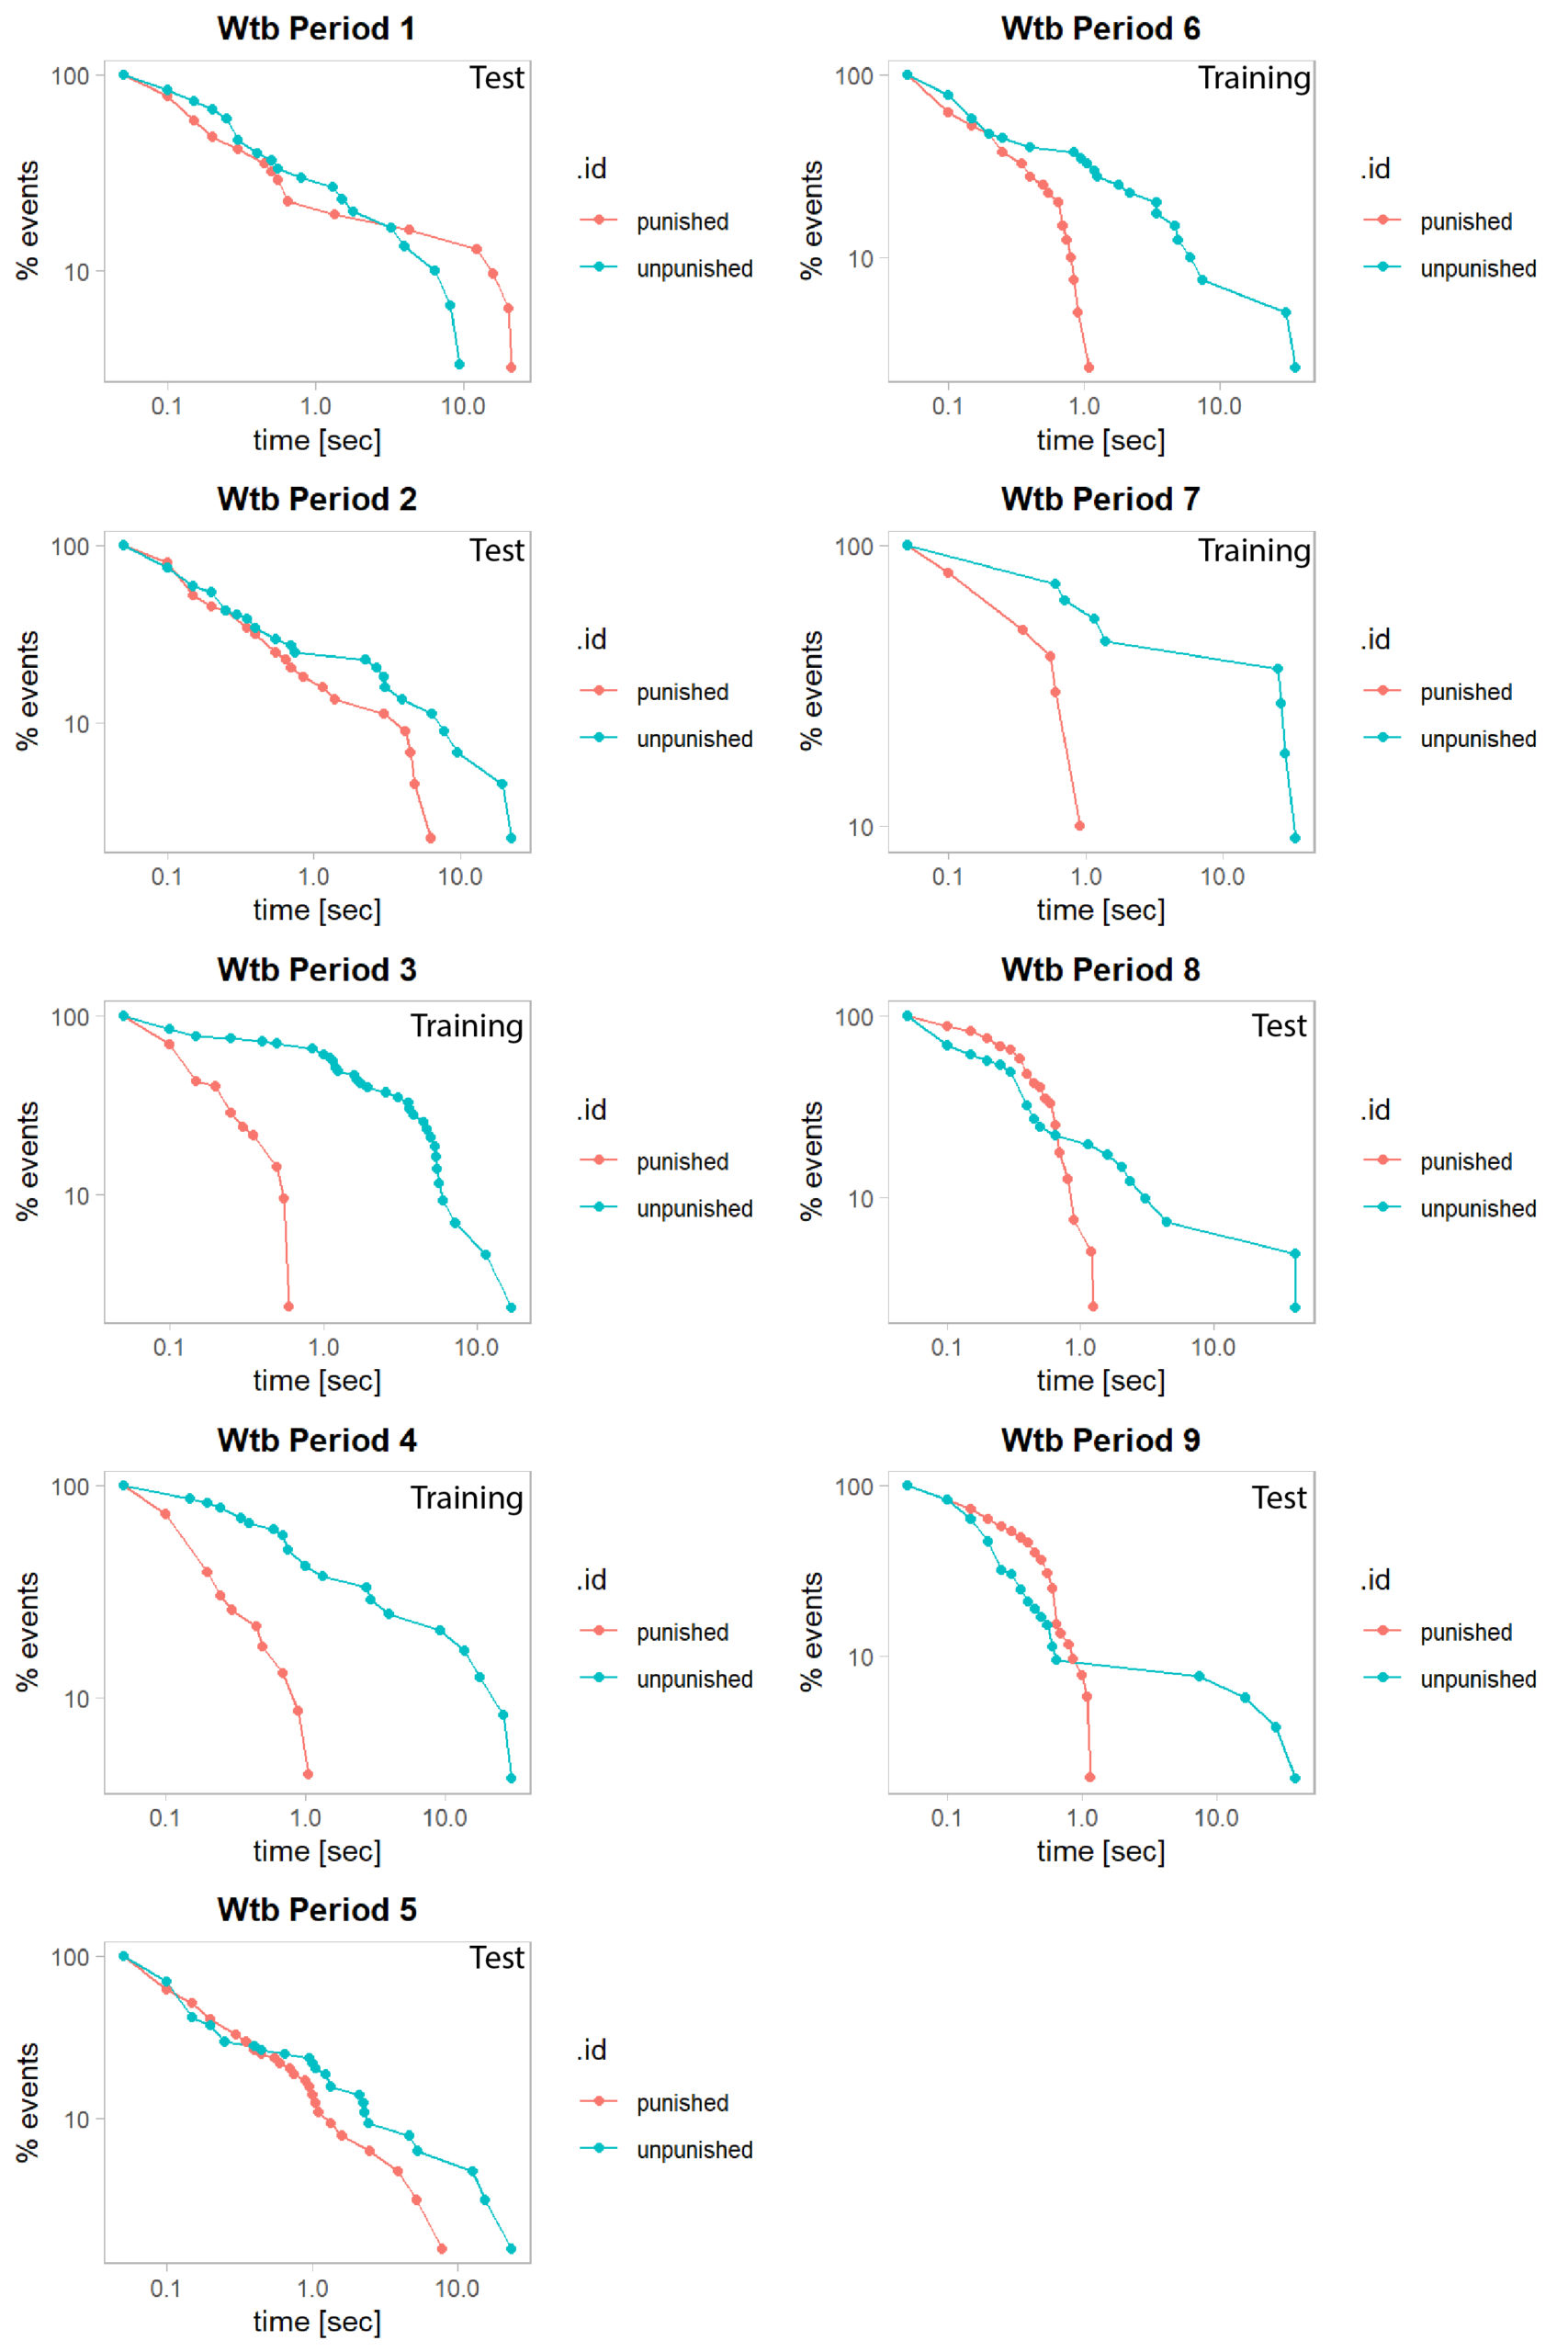
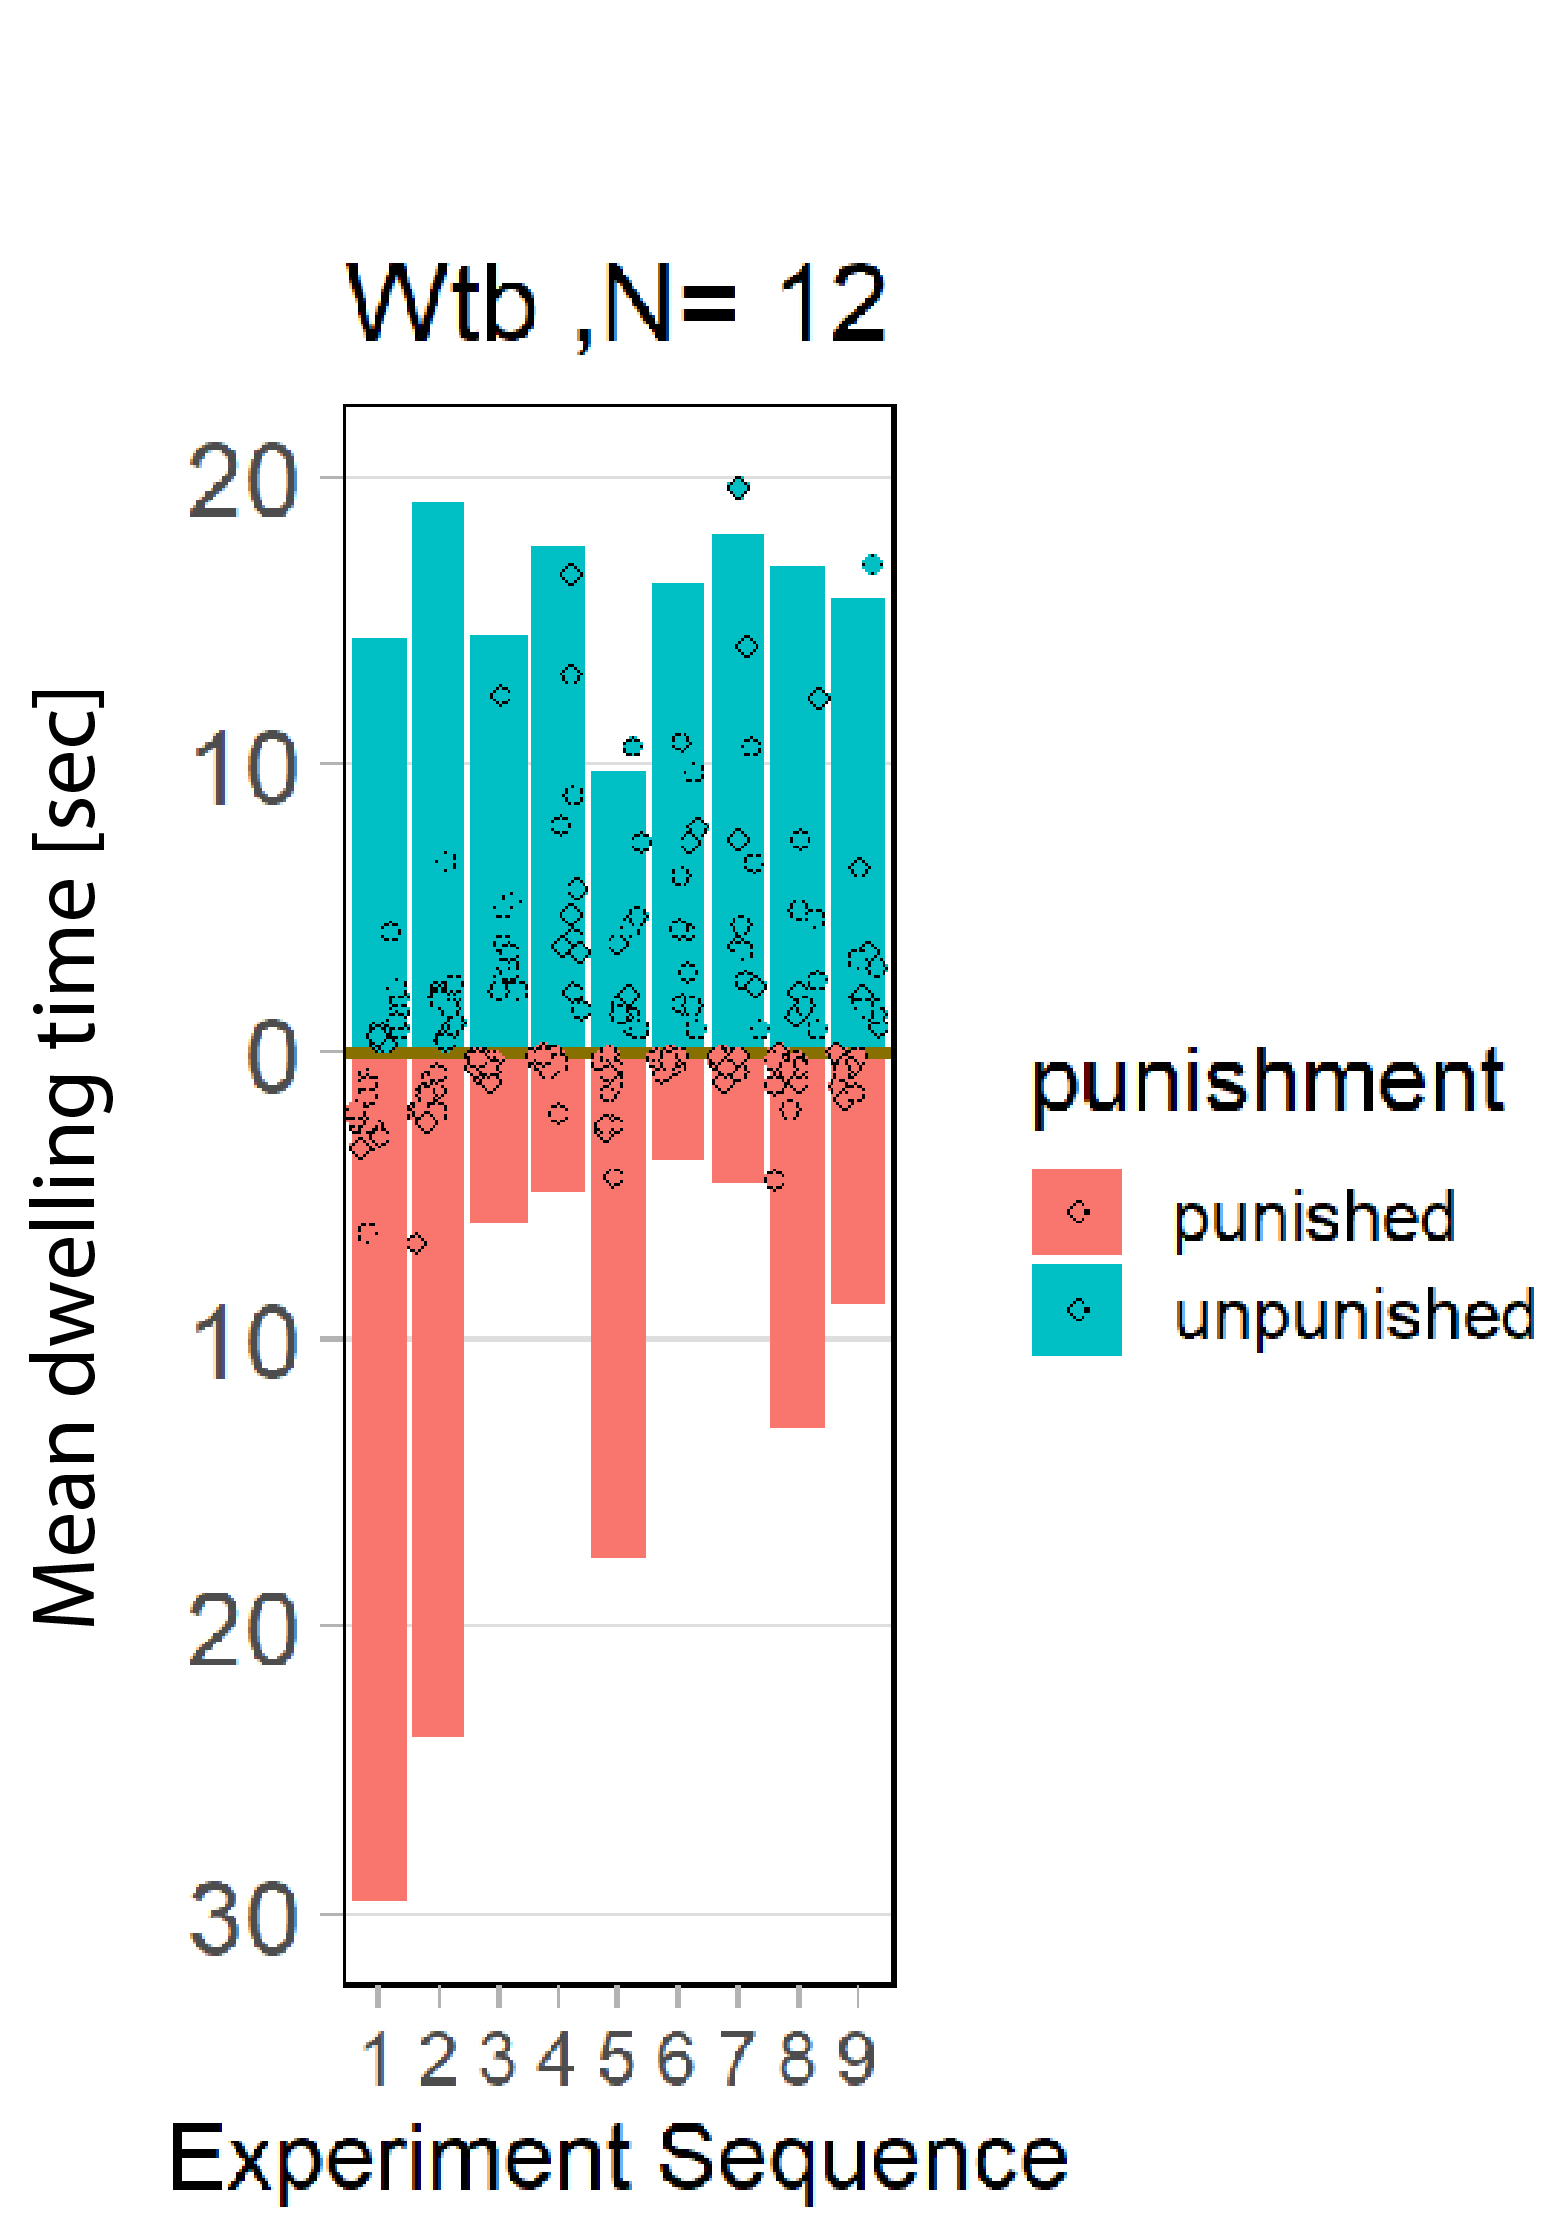
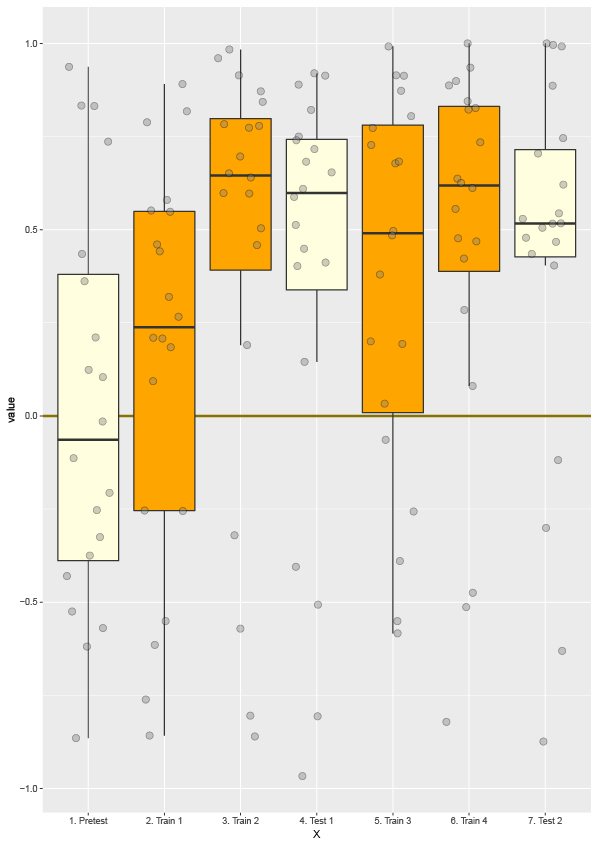
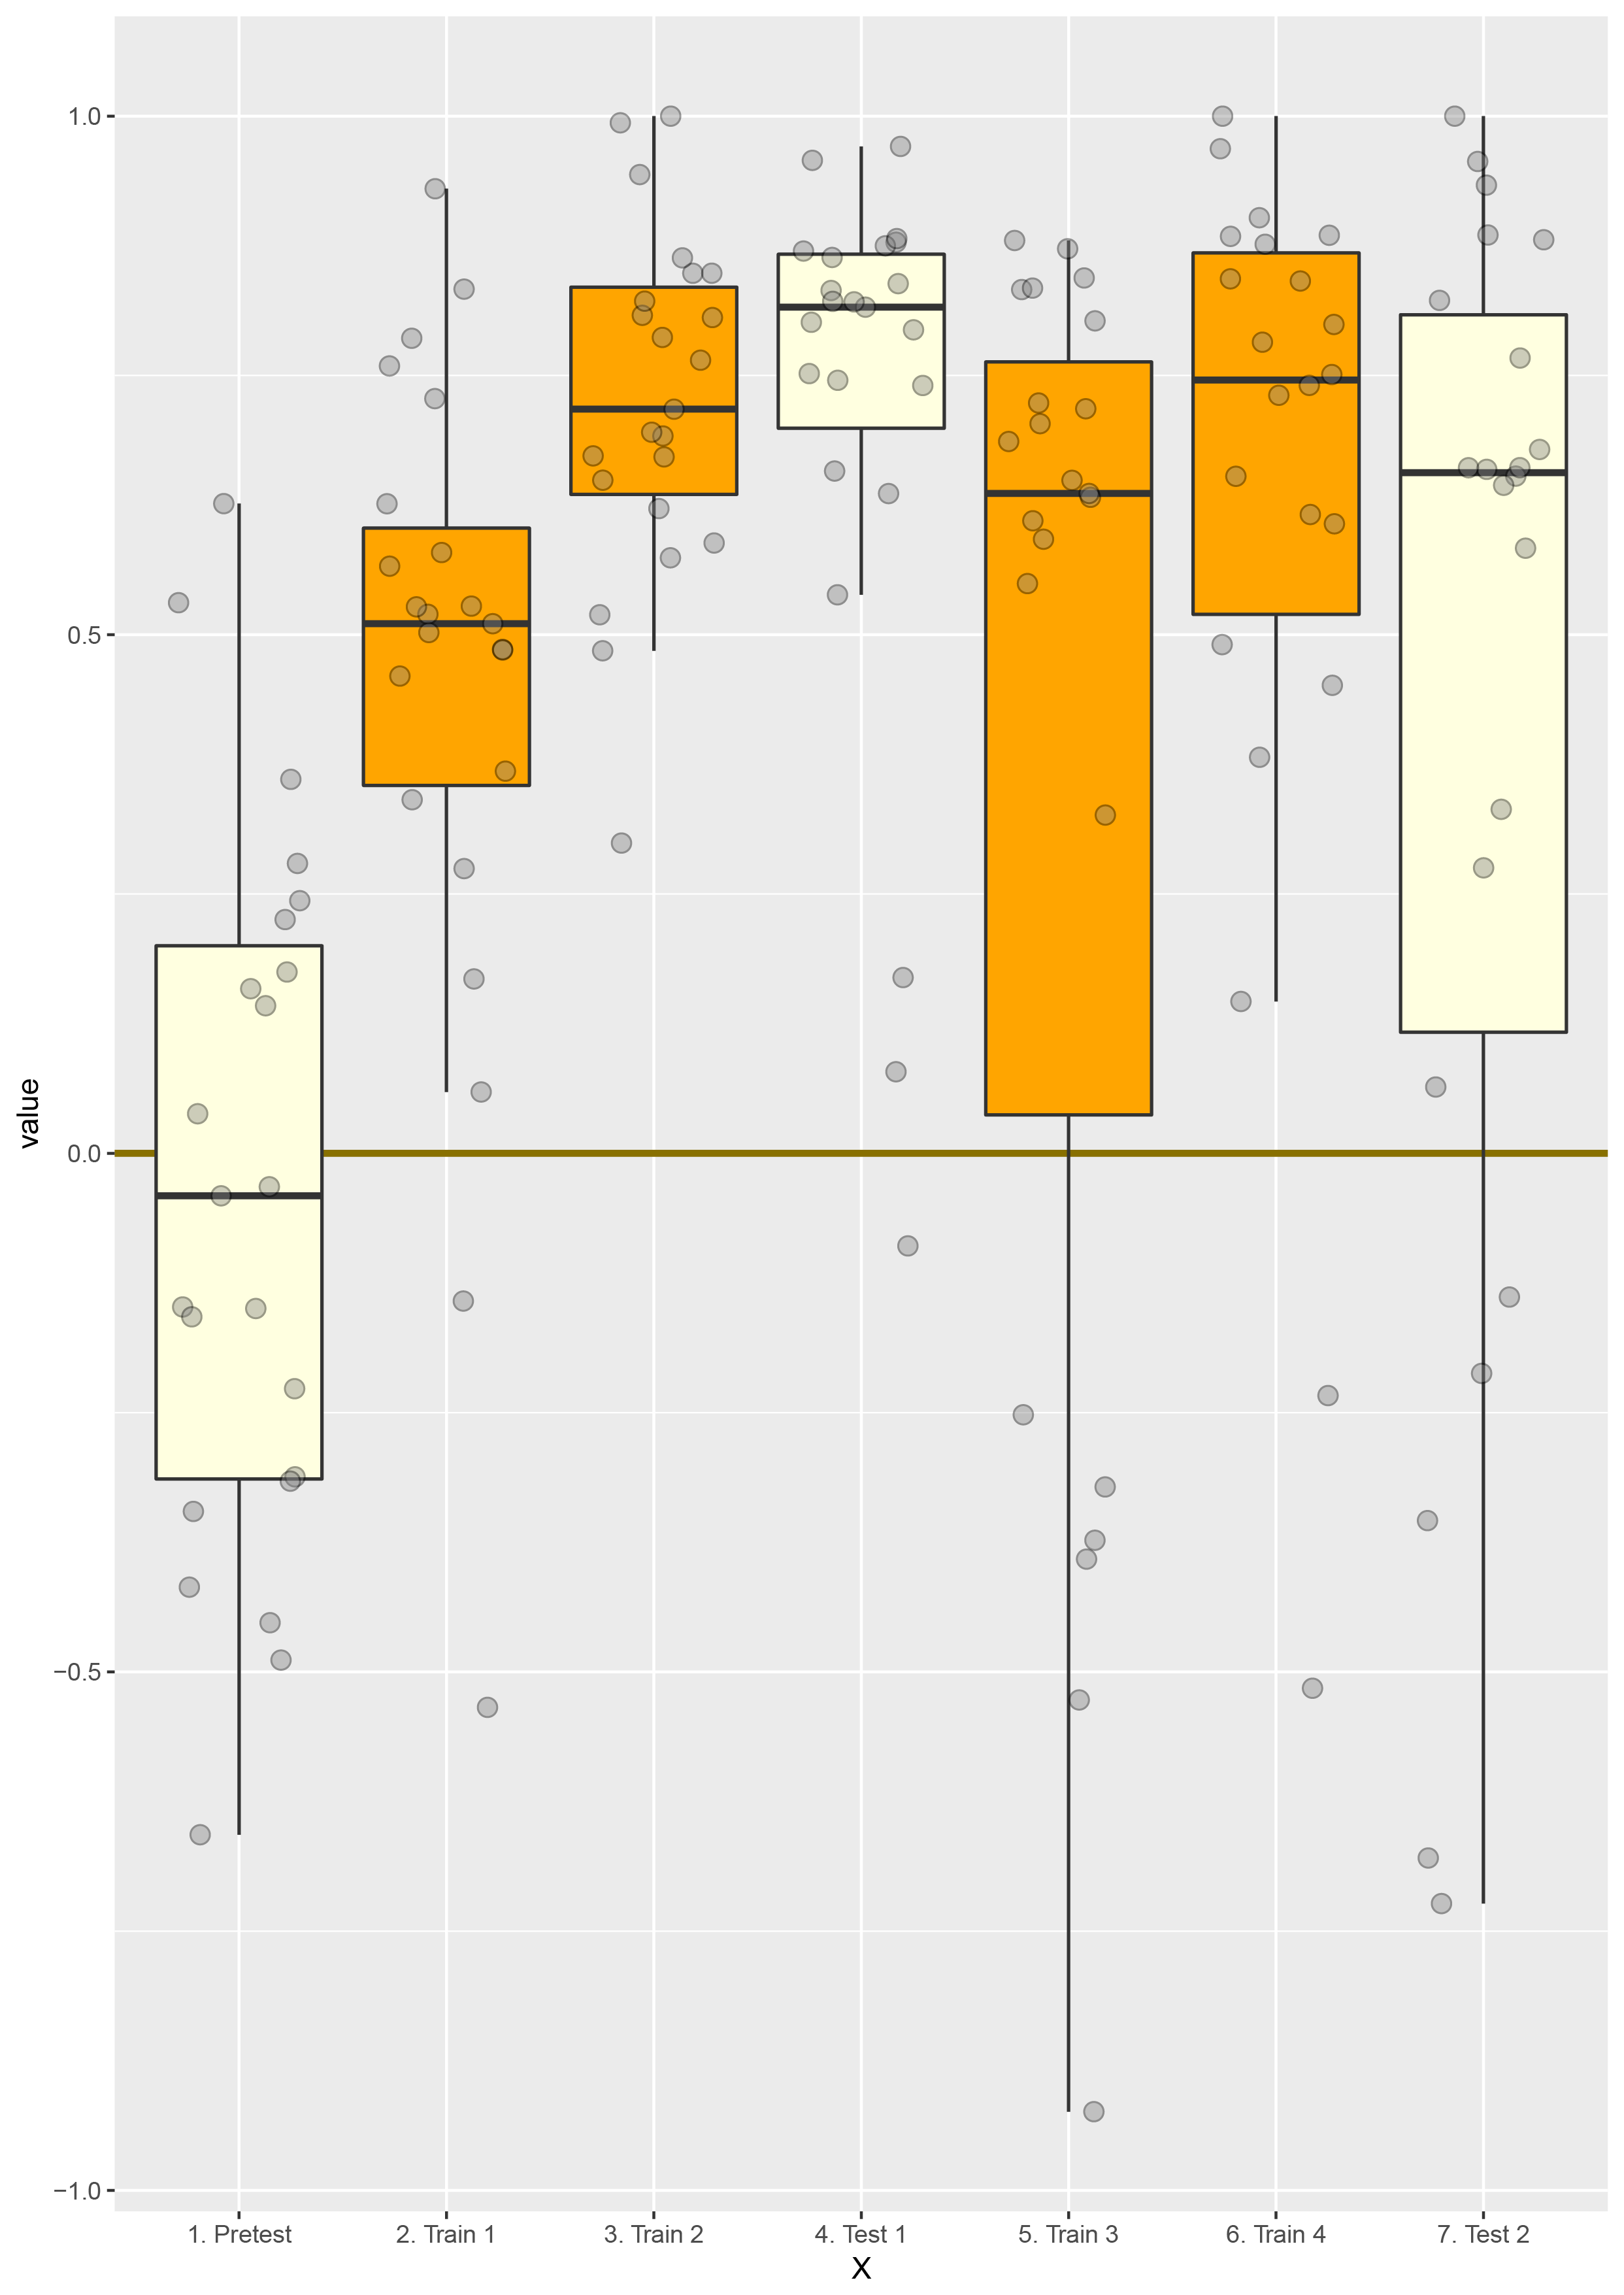
Plotting the dwelling times as means
Grouped analysis of dwelling times
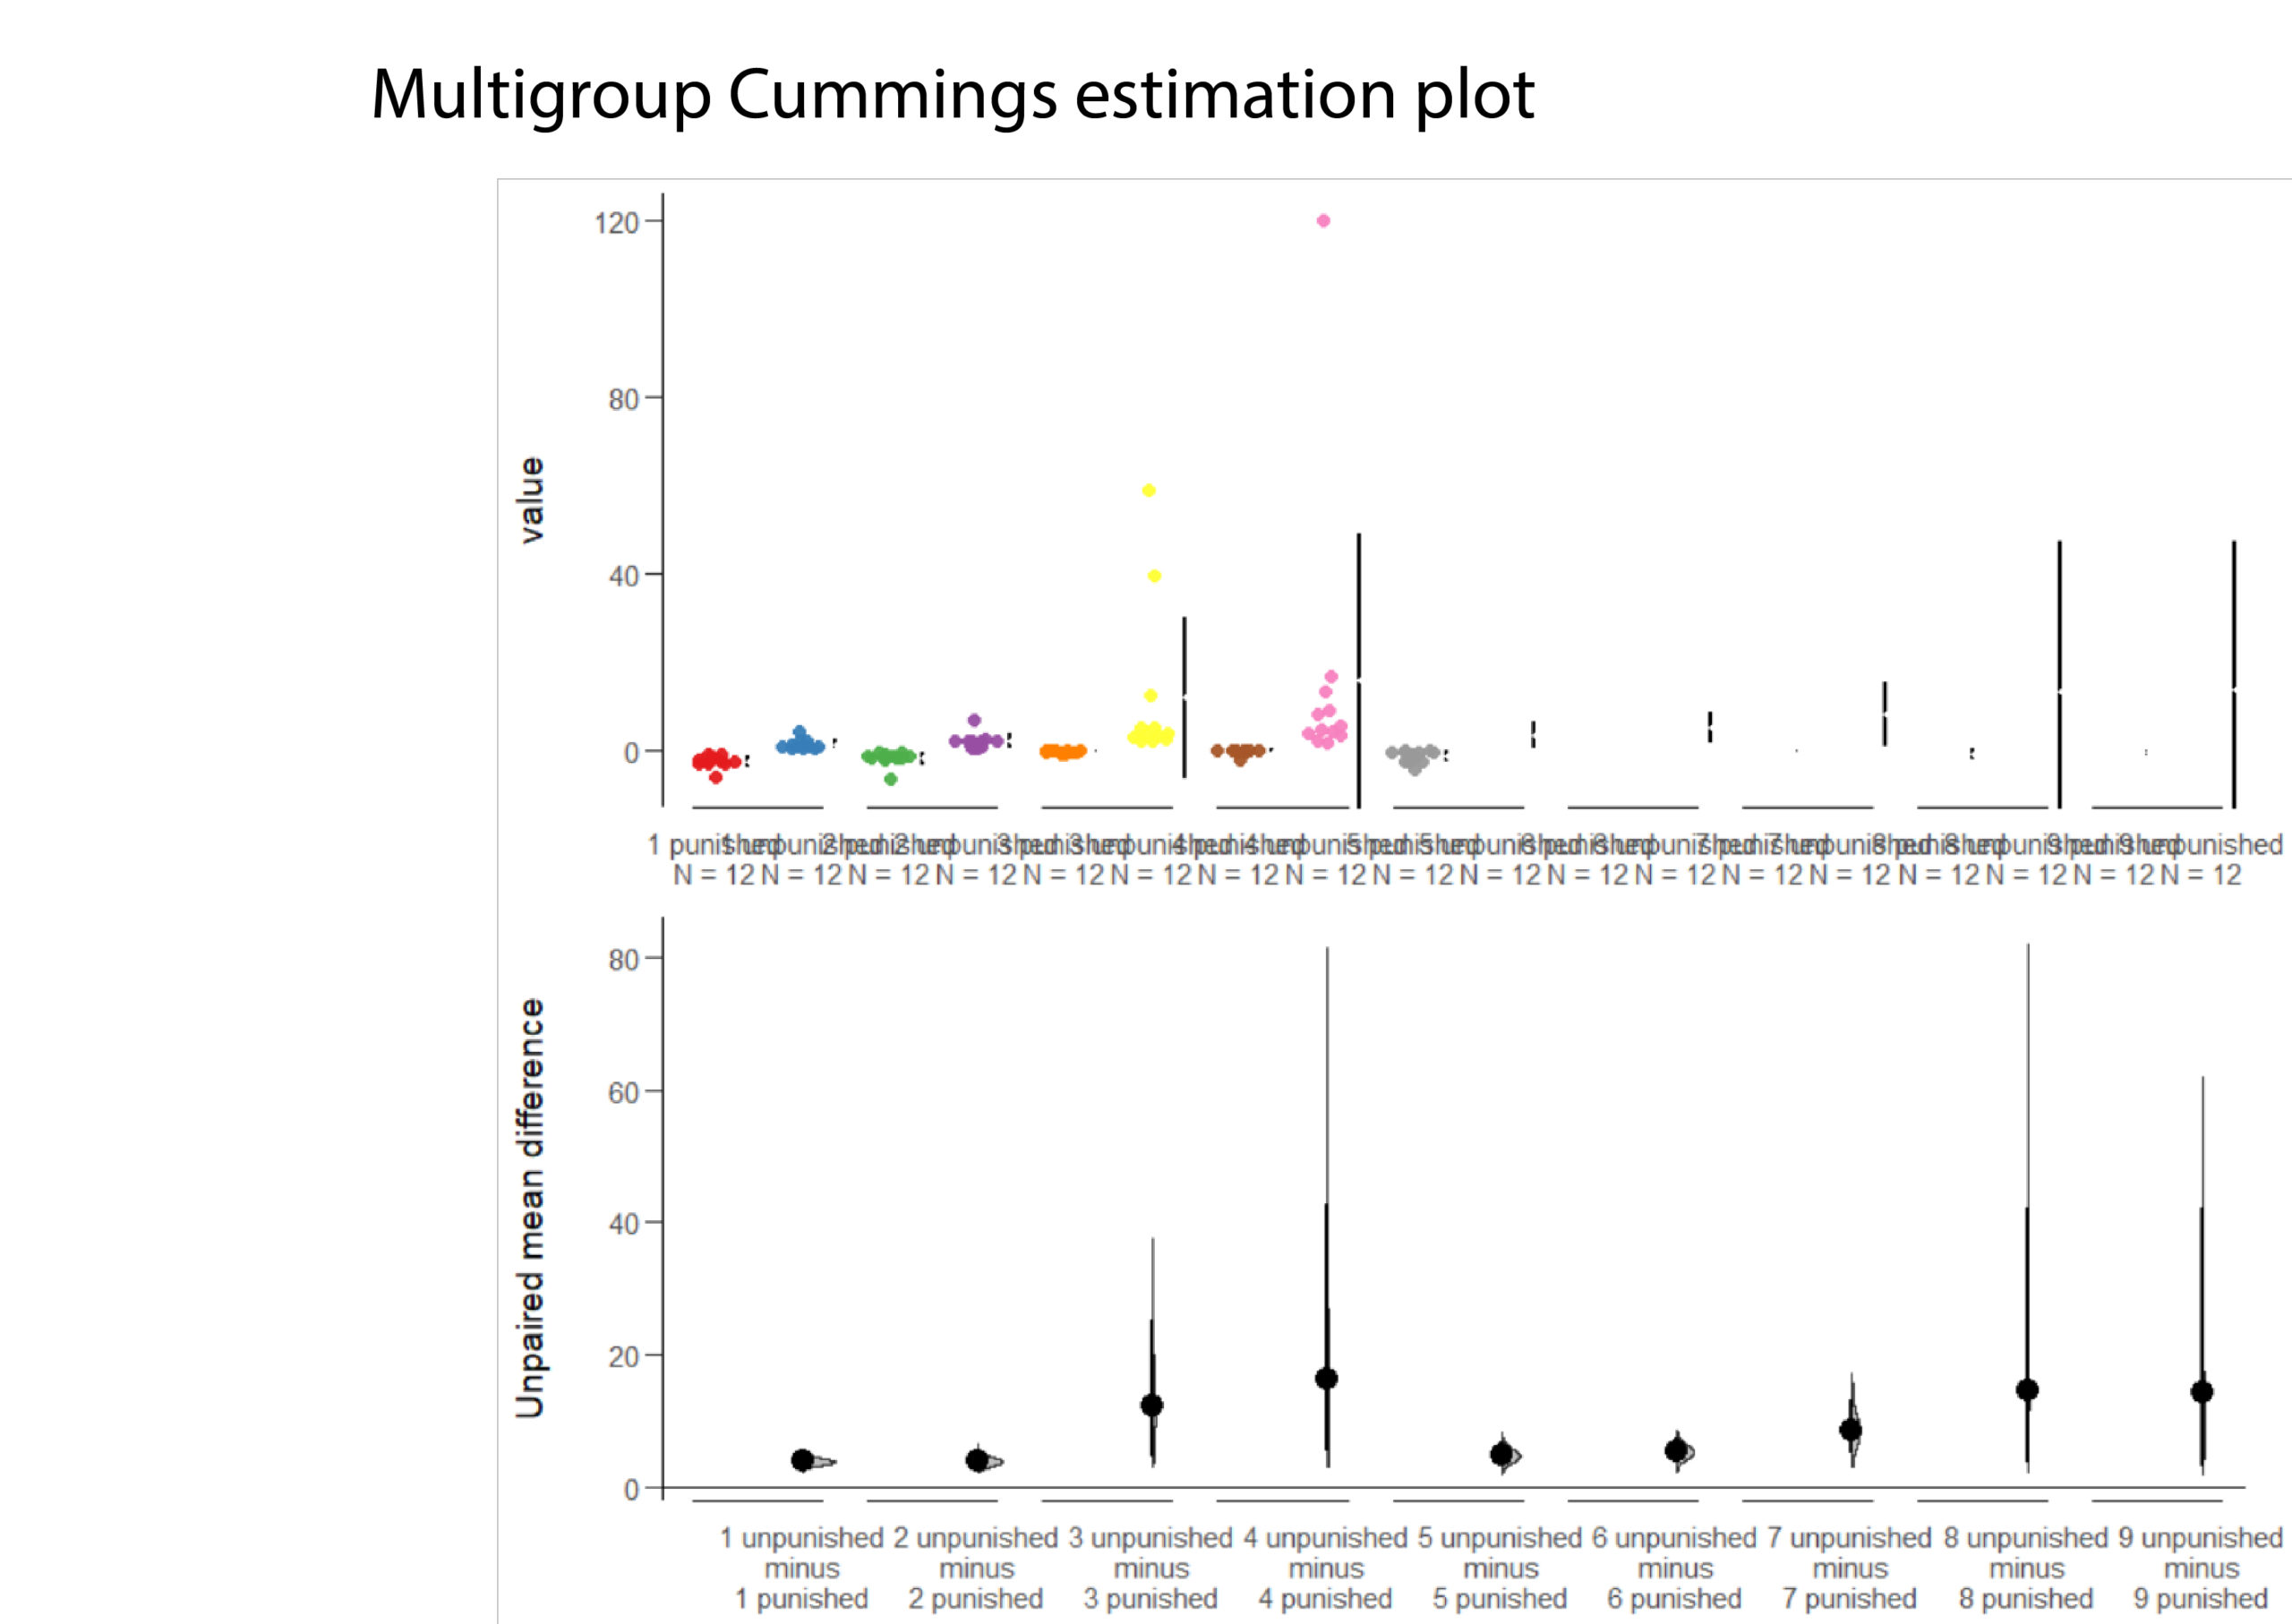
Cumming estimation plot

Category: flight, Memory, Operant learning, operant self-learning, R code | No Comments
Updates on optomotor response software
on Friday, March 20th, 2020 3:19 | by Anders Eriksson
- Added a timer
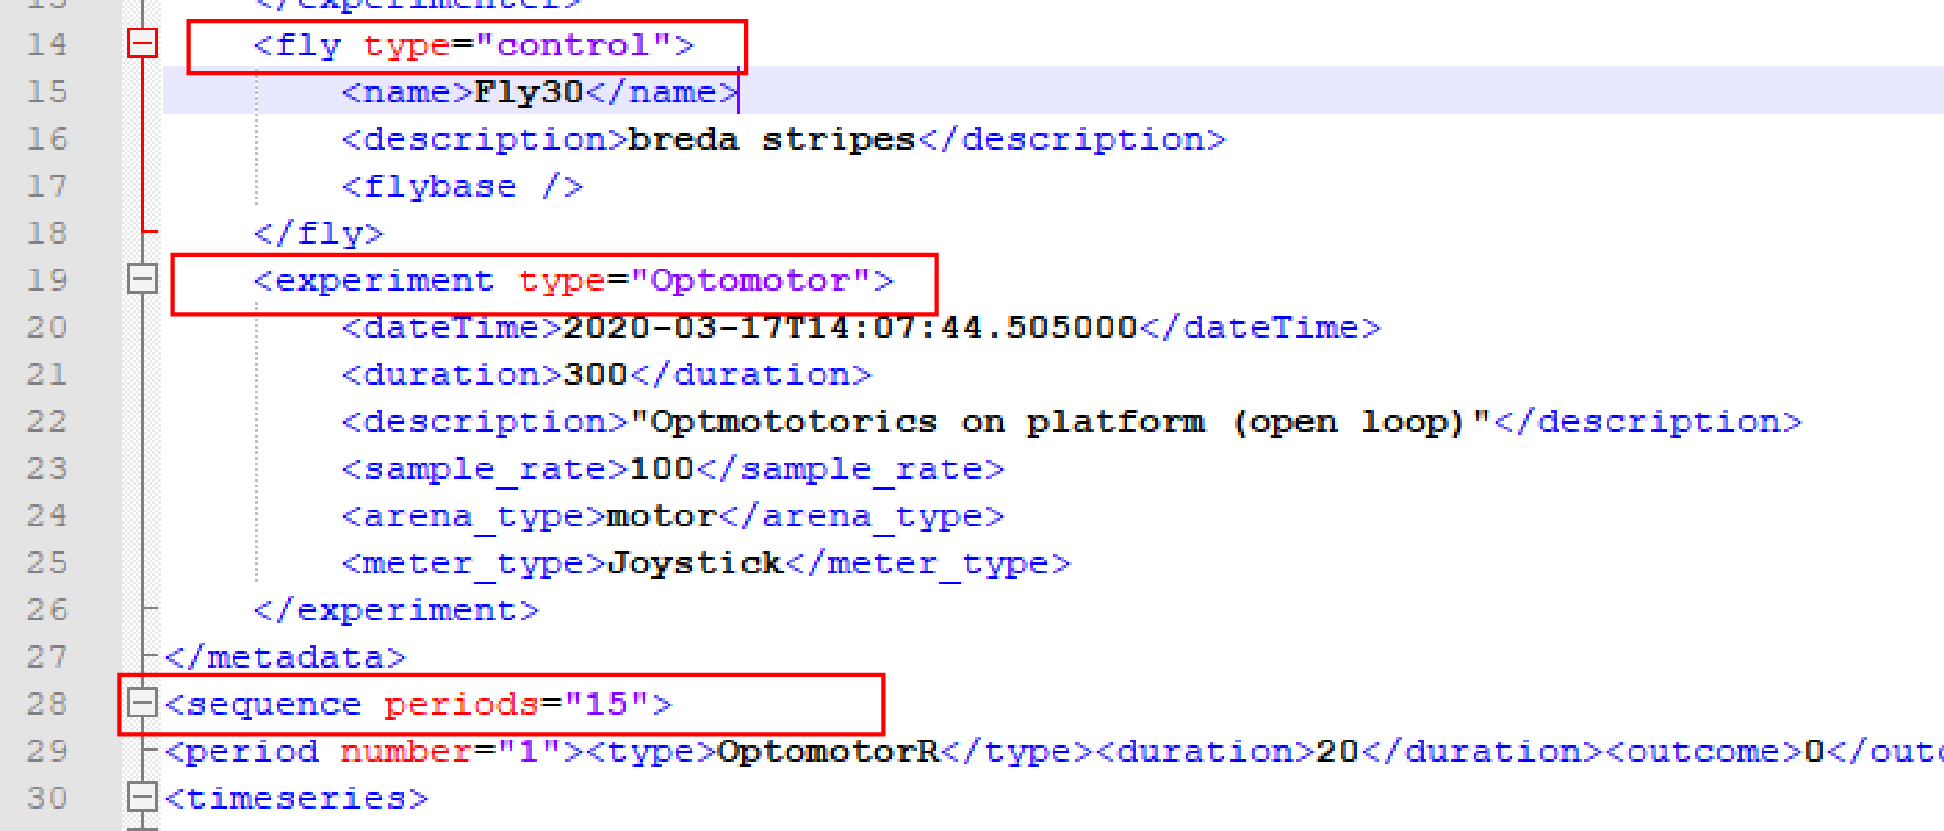
- Previous version generated faulty xml files. This bug has been squashed (see image below)
- Display window of the software now also prints which direction the striped arena turns
Category: Optomotor response, R code, Uncategorized | No Comments
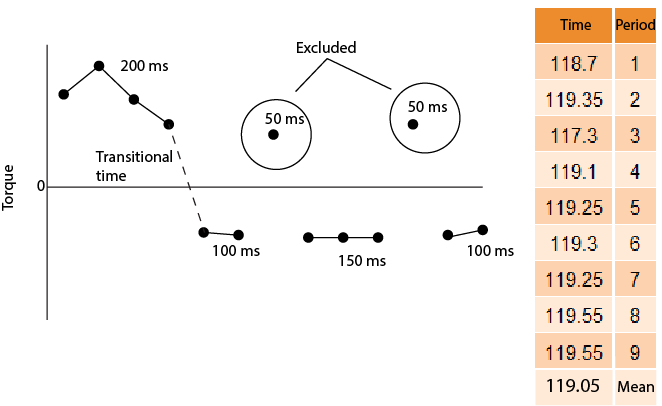
Dwelling time
on Monday, February 3rd, 2020 1:41 | by Anders Eriksson
The schematic drawing is an example. The method that is currently used to calculate the dwelling time is excluding times that are 50 ms. Each dwelling time is getting an additional 50ms to compensate for the transitional time loss (dashed line in schematic drawing). The chart on the right side is the total time for each period when adding negative and positive dwelling times.
Category: R code | No Comments
Pushing software updates
on Wednesday, March 20th, 2019 9:21 | by Anders Eriksson
Johann Schmid and I have been working on getting updates to the torque meter software. Small changes but with significant increase in user friendliness.
● Inability to overwrite the data
● Progress bar and a time bar implemented
● It resets the pattern from one period to another. This is of critical importance as this enables one to do basically any kind of experiment on the machine
I have also gotten hold of a free version of LabView. I thought it could be a good idea that we could to small changes ourself to the software. However, my version is 2017 and Mr Schmid mentioned that he will be transferring to LabView 2019, and thereby retiring the 2017 version. A student version of labview is affordable, less than 50 Euros. It could be worth getting a legal licence of this software.
● The A/D converter now connects directly to the PCB. Only problem is that it is inverted, meaning that the signal from the torque machine gives a positive signal it is registered as a negative signal in the software. Mr Schmid is aware of this and will invert the signal in the software, rather than resoldering the PCB connection.
Updates to the DTS
● DTS is now also better compatible wit the new kind of data we are getting. A conflict occurred because of differences in pattern. An easy fix by just ignoring this parameter.
Category: flight, Lab, Operant learning, operant self-learning, R code | No Comments
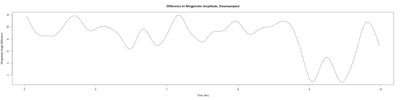
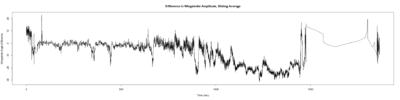
Stroklitude Data
on Monday, July 23rd, 2018 1:55 | by Anokhi Kashiparekh
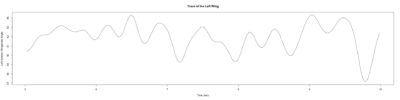
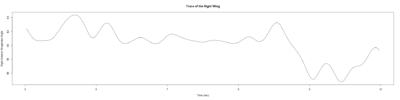
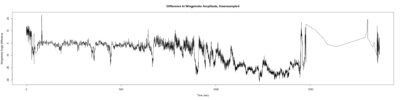
Category: lab.brembs.net, R code, Spontaneous Behavior, strokelitude, WingStroke | No Comments
The T-Maze experiments : Middle analysis and Correlation plot
on Saturday, July 14th, 2018 12:06 | by Naman Agrawal
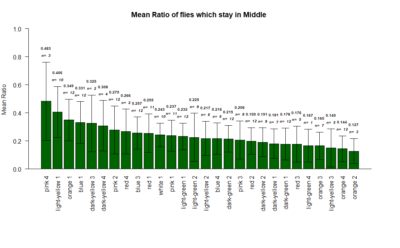
Correlation plot between the mean ratio of the flies that stay in the middle versus the Weighted PIs
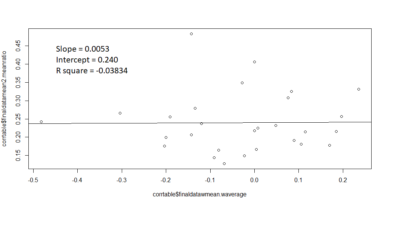
Slope = 0.0053
Intercept = 0.240
R square value = -0.03834
contrary to the expectations, there seems to be no correlation .
Category: lab.brembs.net, neuronal activation, operant self-learning, Optogenetics, R code | No Comments
Running the flight simulator analysis script
on Monday, July 2nd, 2018 1:55 | by Anders Eriksson
Category: flight, Lab, Memory, R code | No Comments
Wildtype flies and flight simulator Part 2
on Monday, June 11th, 2018 1:29 | by Anders Eriksson
Category: flight, Memory, R code, Uncategorized | No Comments
Wildtype flies and flight simulator
on Monday, June 4th, 2018 9:18 | by Anders Eriksson
The results from wiltype Berlin flies in the flight simulator.
Category: flight, Memory, R code | No Comments
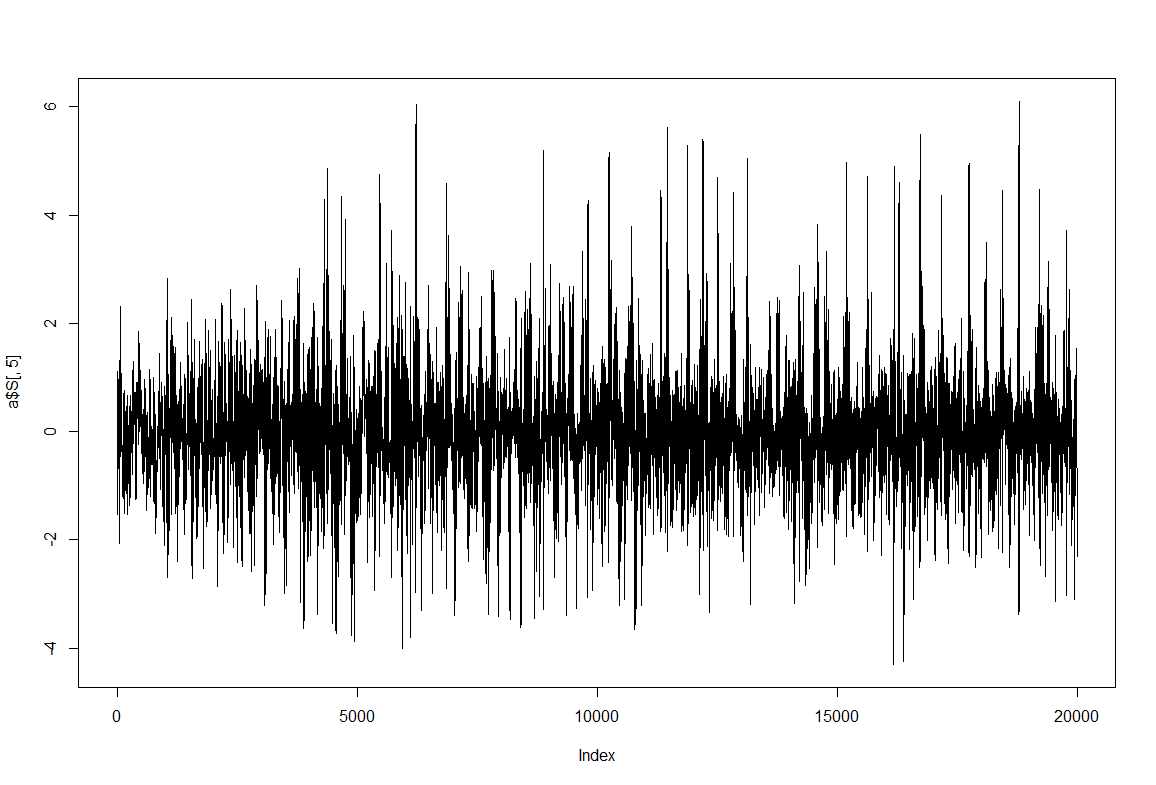
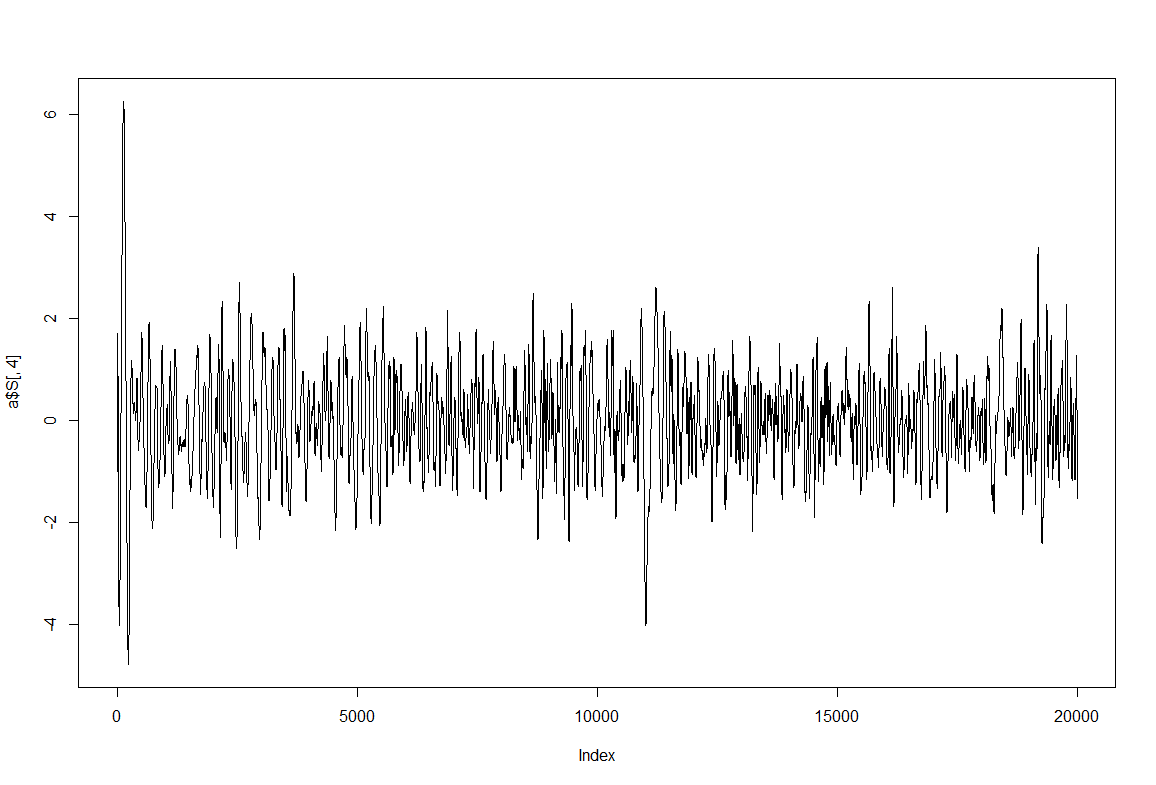
EMD with ICA to one sample of torque trace
on Monday, March 19th, 2018 2:35 | by Christian Rohrsen
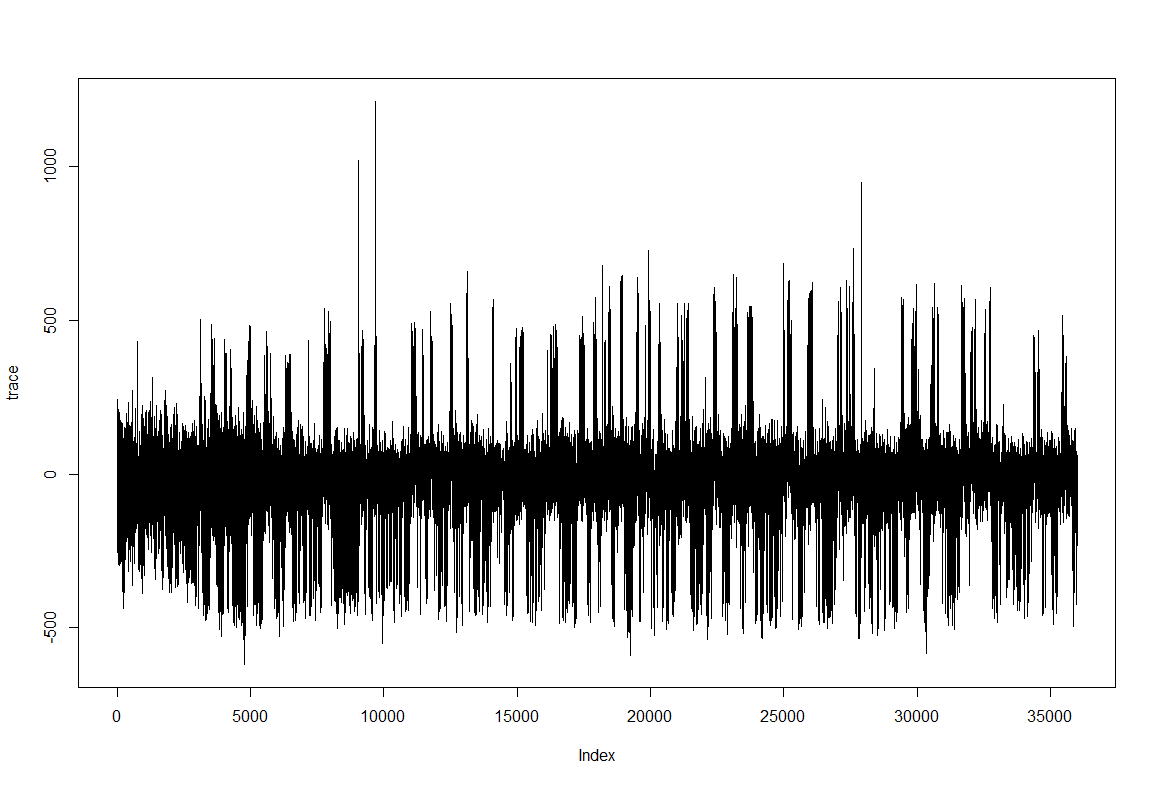
Trace after filtering by selecting the first 8 IMFs (intrinsic mode functions) from EMD (empirical mode decomposition). Since the signal should be quite clean I do not take out the first IMFs. The last IMFs, however, are too slow and change the baseline to much
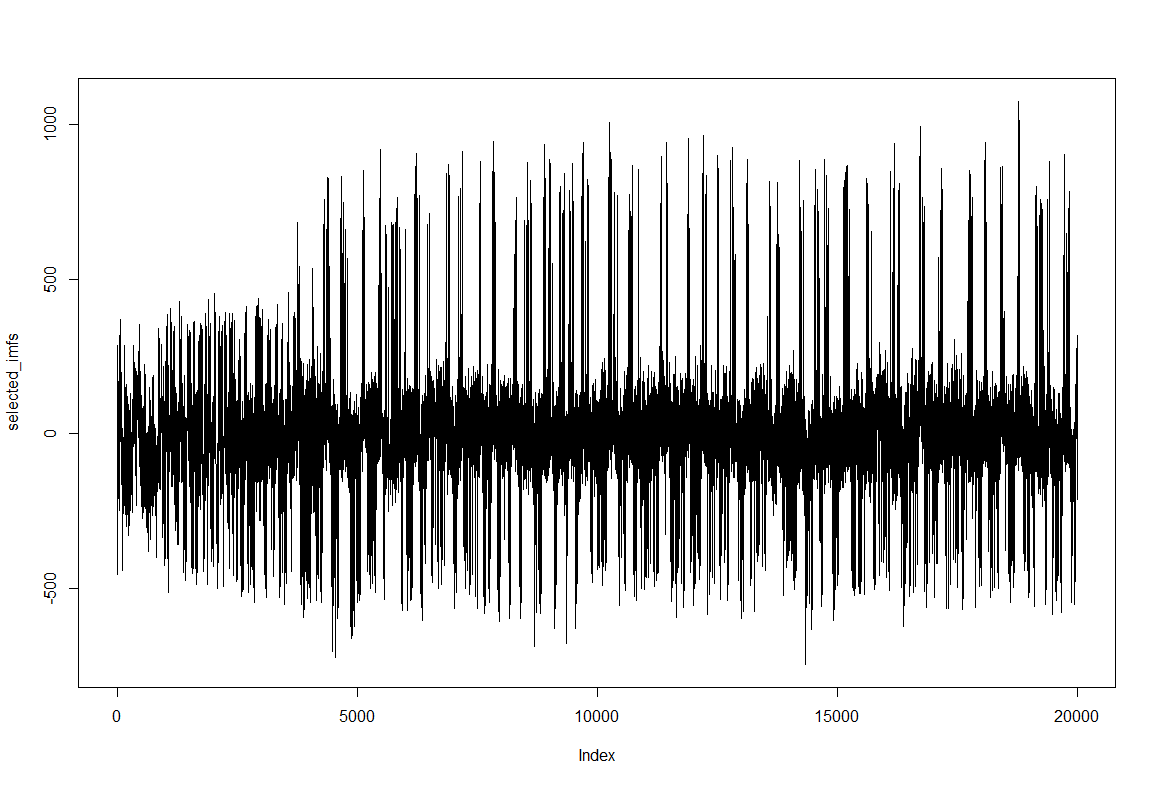
Some examples of the IMFs obtained from EMD: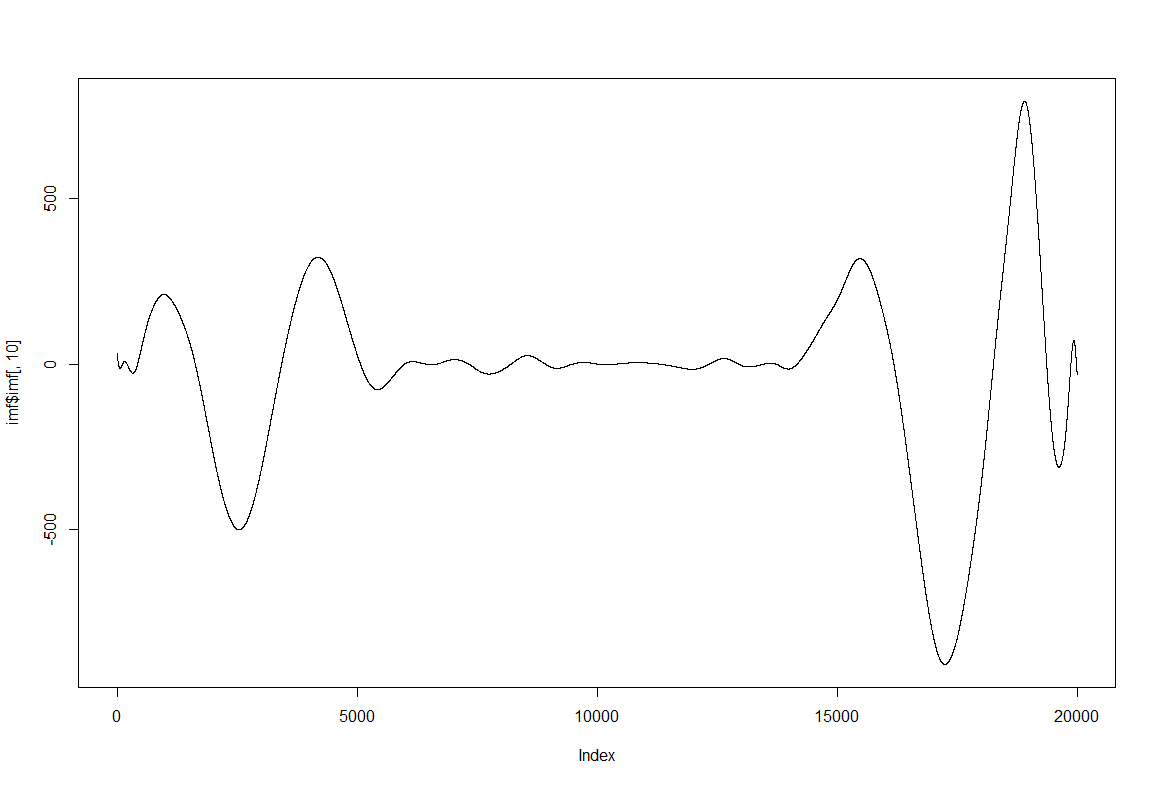
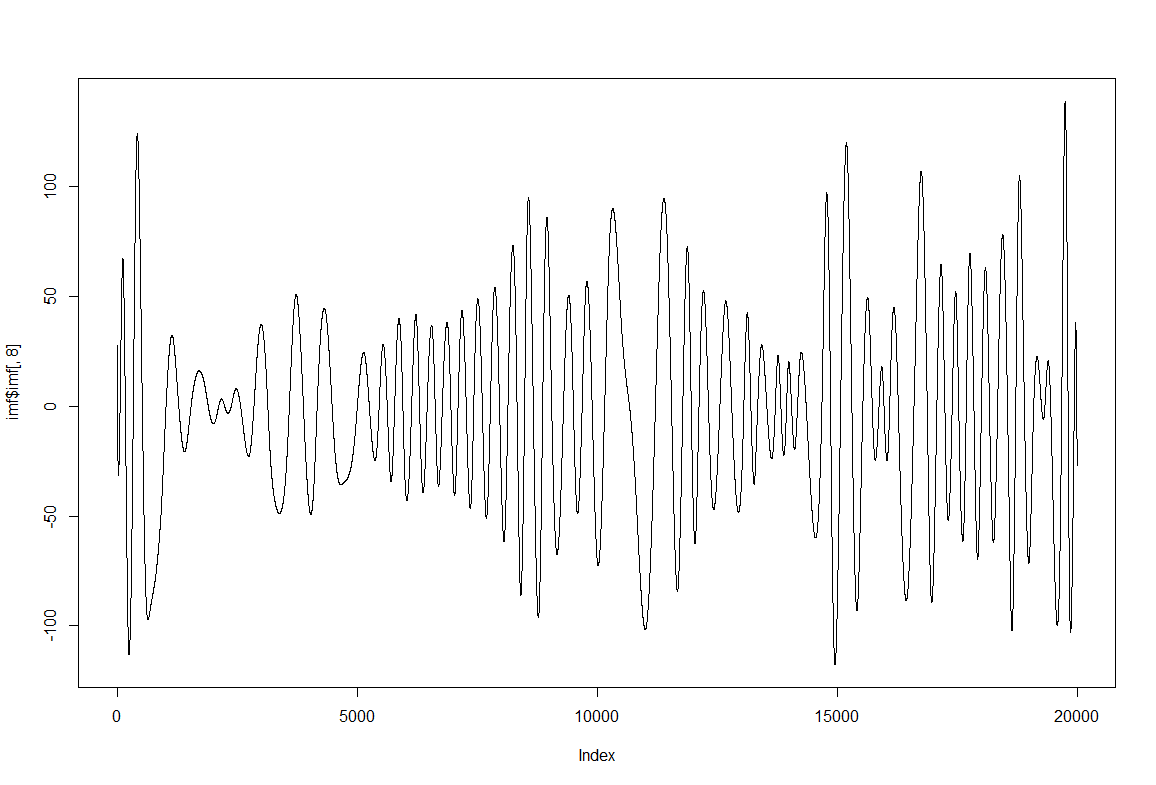
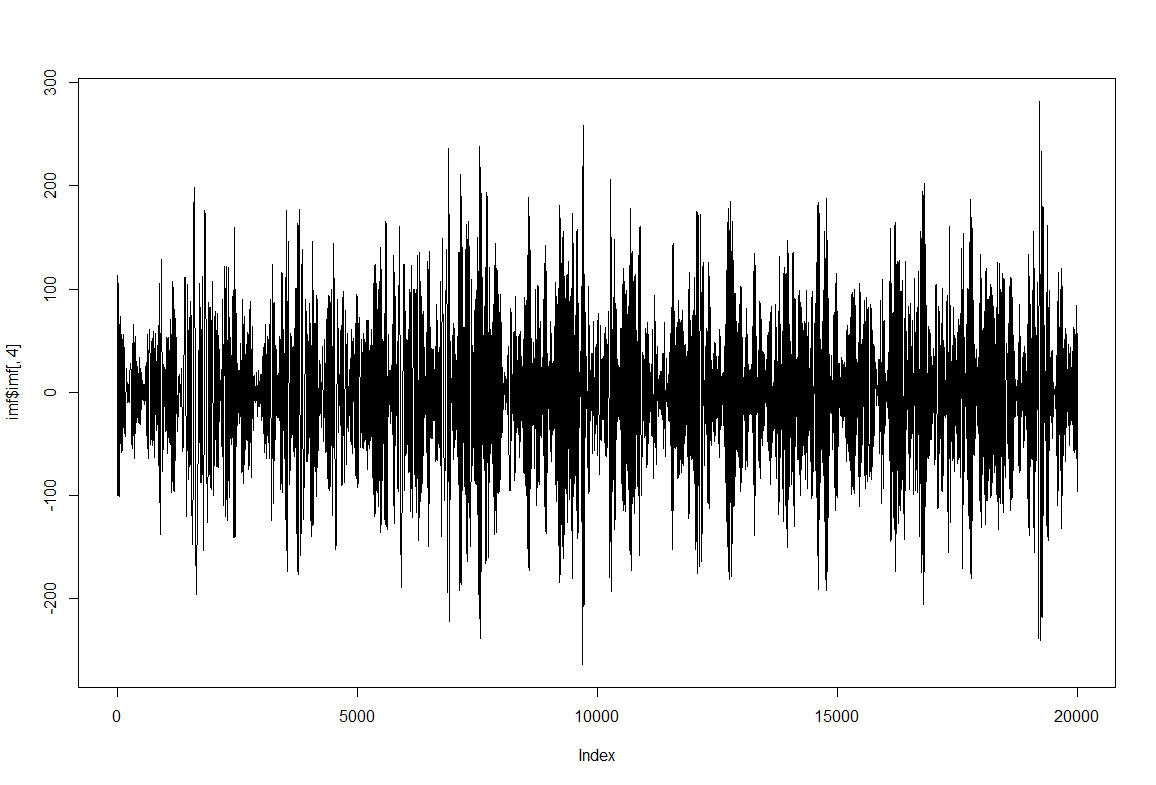
Since this is separating behavior adapting to the data intrinsic time scales I am now thinking of analysing with the SMAP algorithm to see if the behavior is more or less nonlinear at certain time scales.
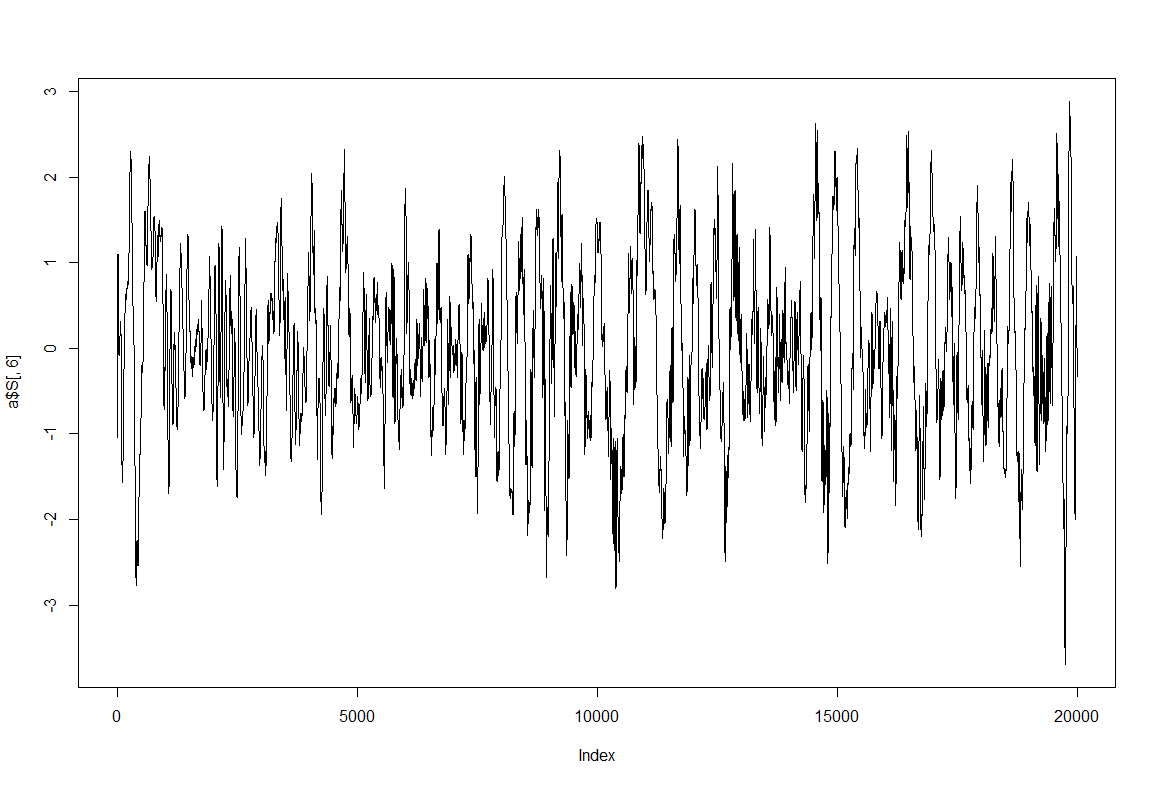
In addition, I have thought of using ICA (Independent component analysis), that is an algorithm famous for the blind source separation problem by extracting the most independent signals from the input signals (in this case the IMFs which are different time scales of the behavior). So the ICs should consist of mixes of different time scales that are correlated together and thus belong (but not necessarily) to the same action/movement module/… Here a few ICs (from 10). My idea is that muscles might coordinate independently between ICs but coordinated within ICs. However to prove that is not that easy I guess
Category: flight, R code, Spontaneous Behavior | No Comments