Optomotor graph coded
on Wednesday, February 21st, 2024 10:15 | by Björn Brembs
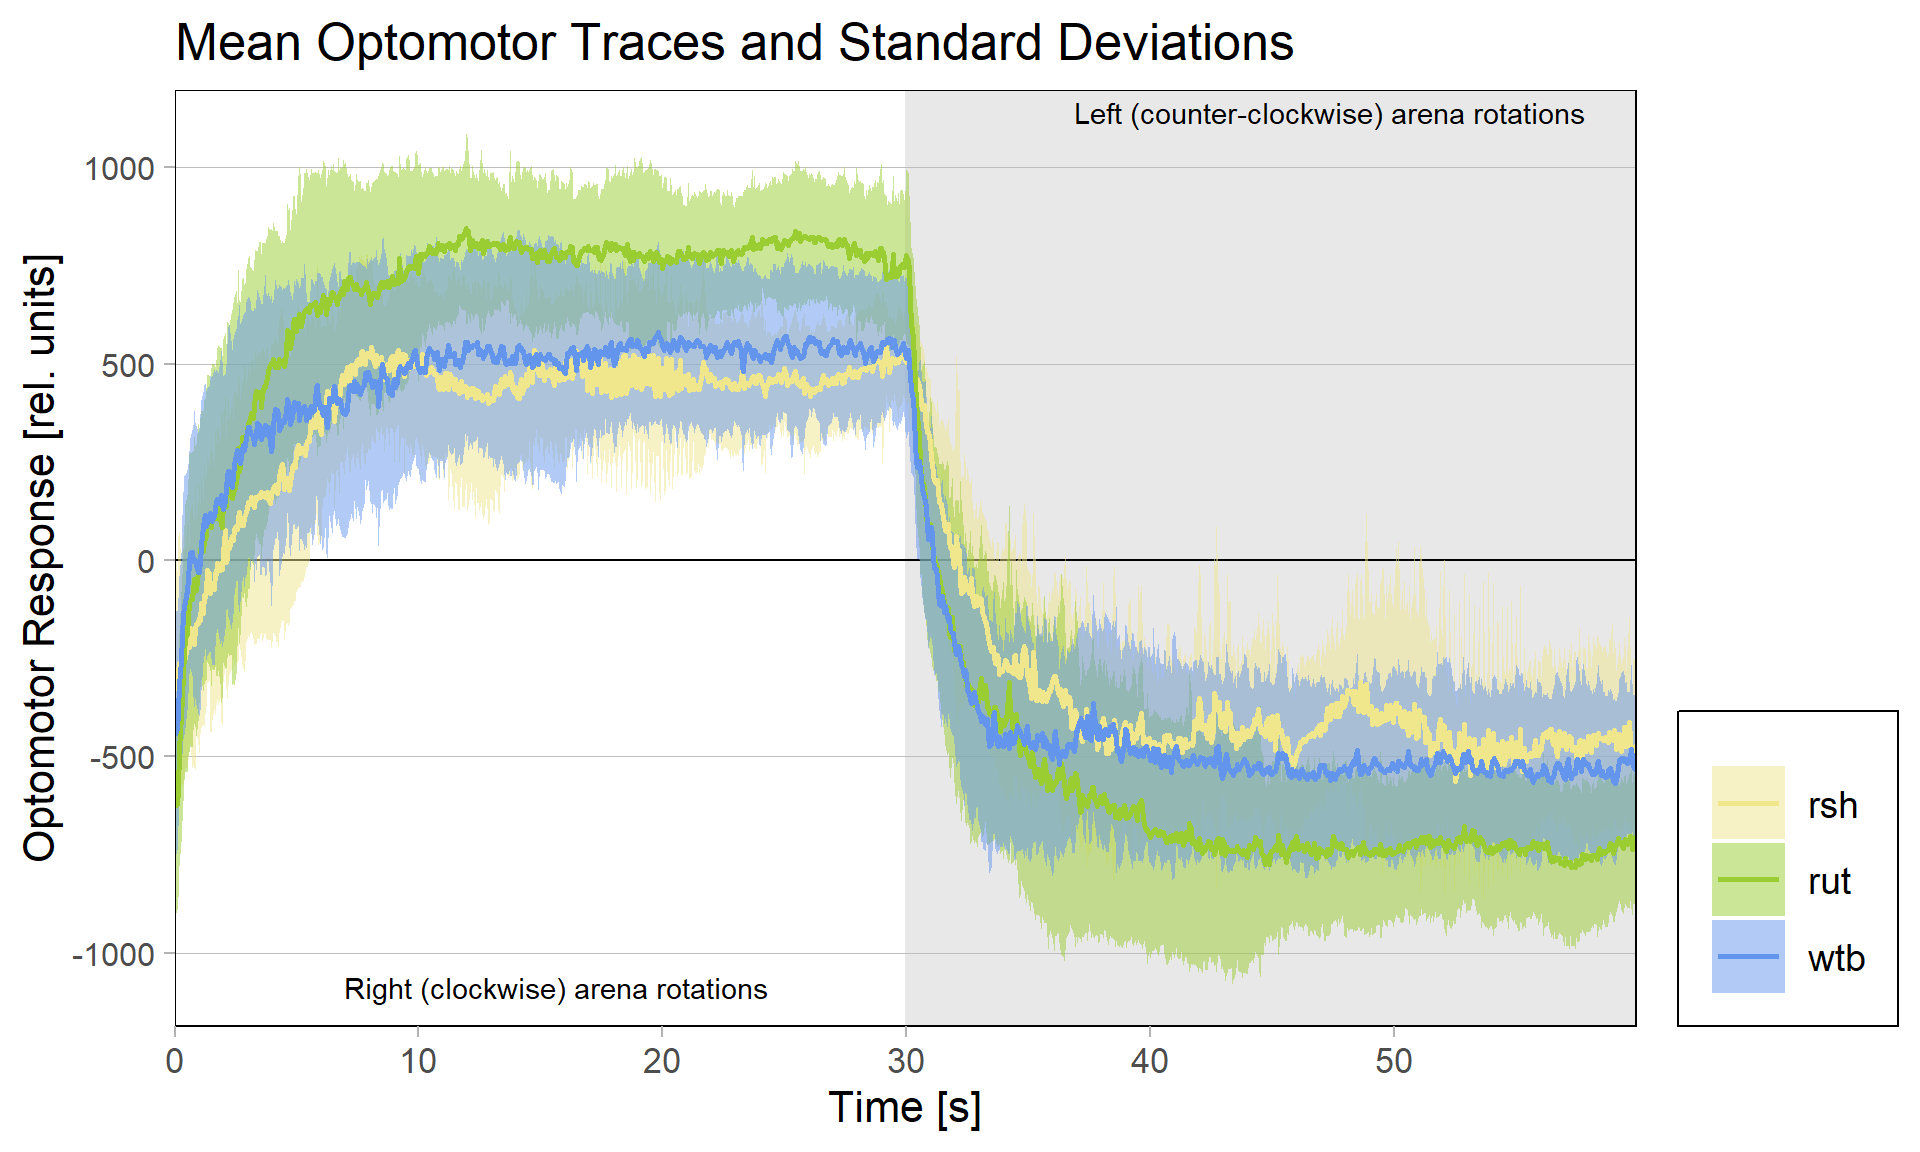
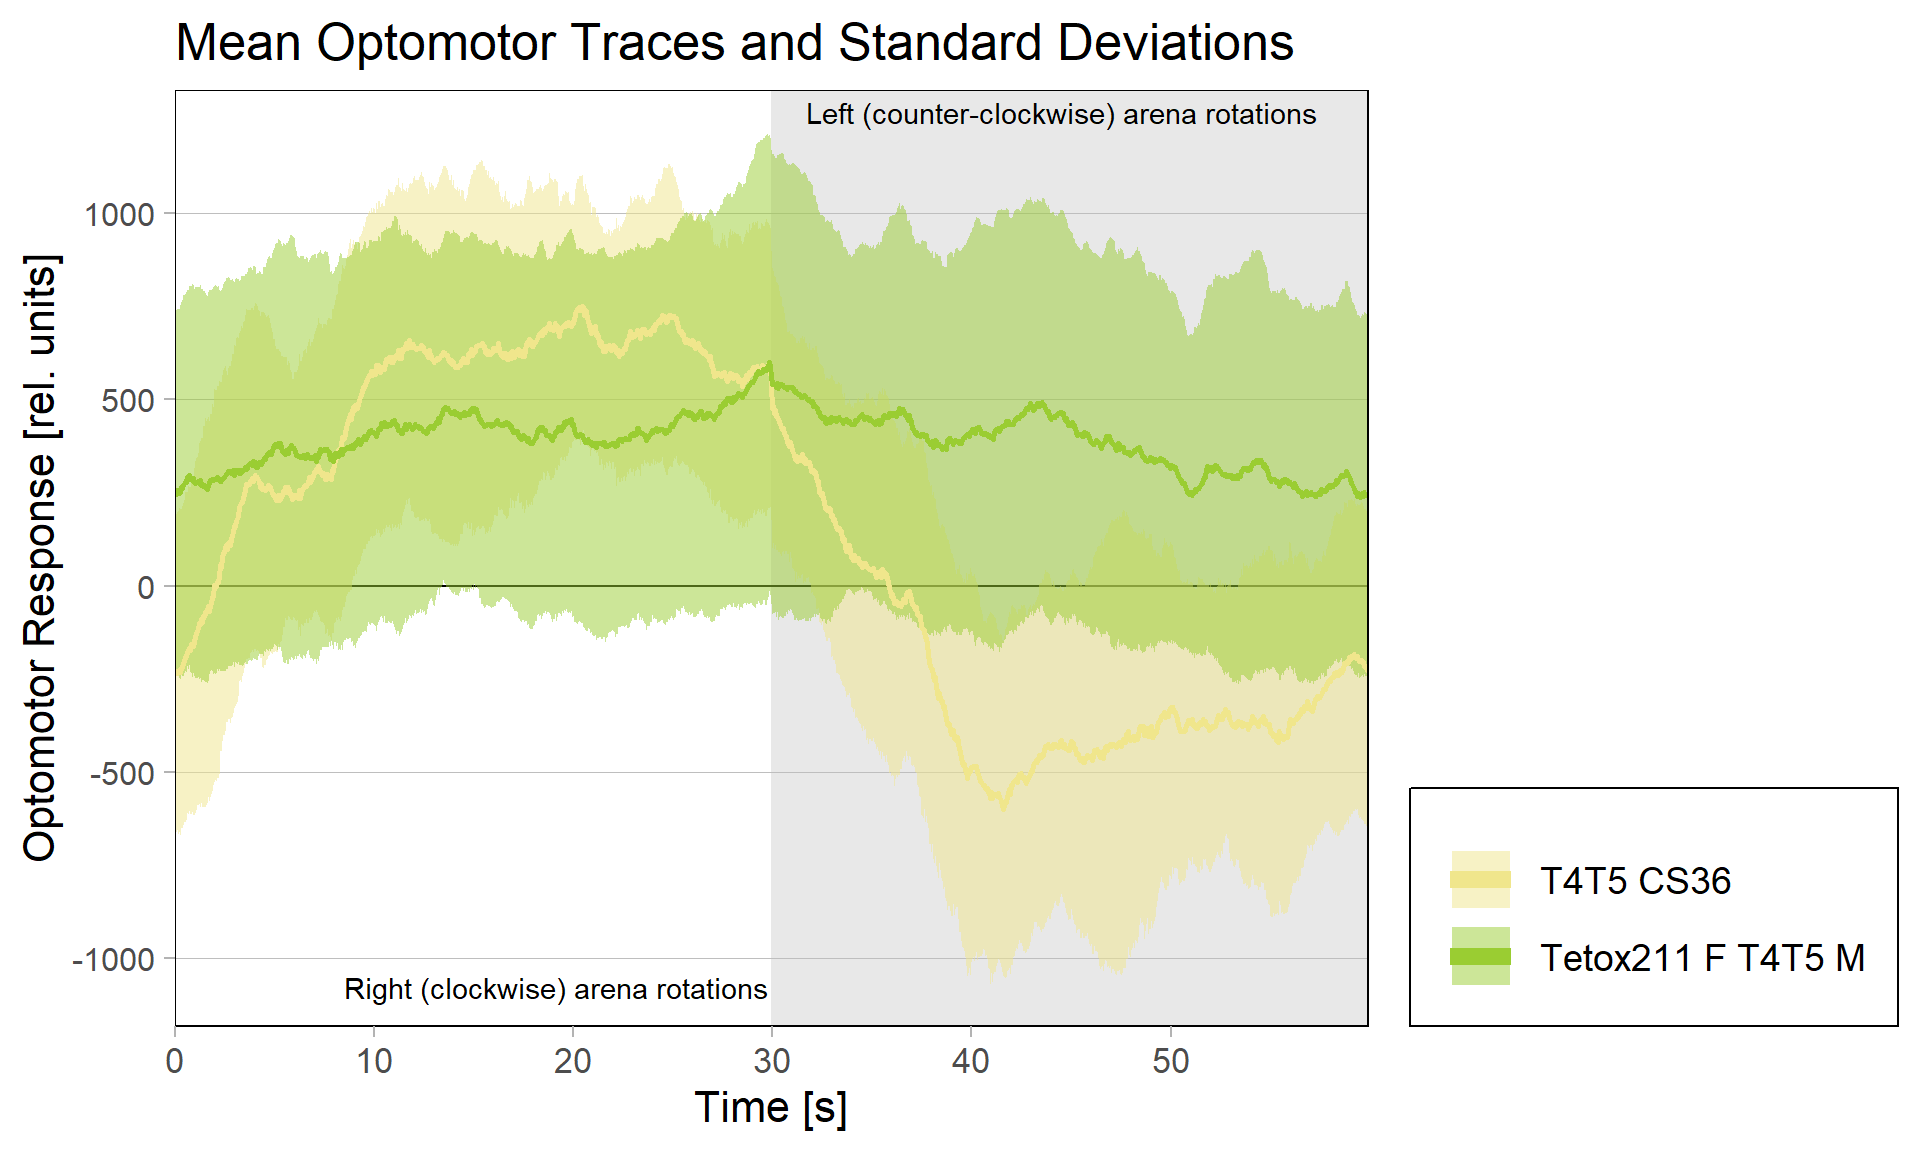
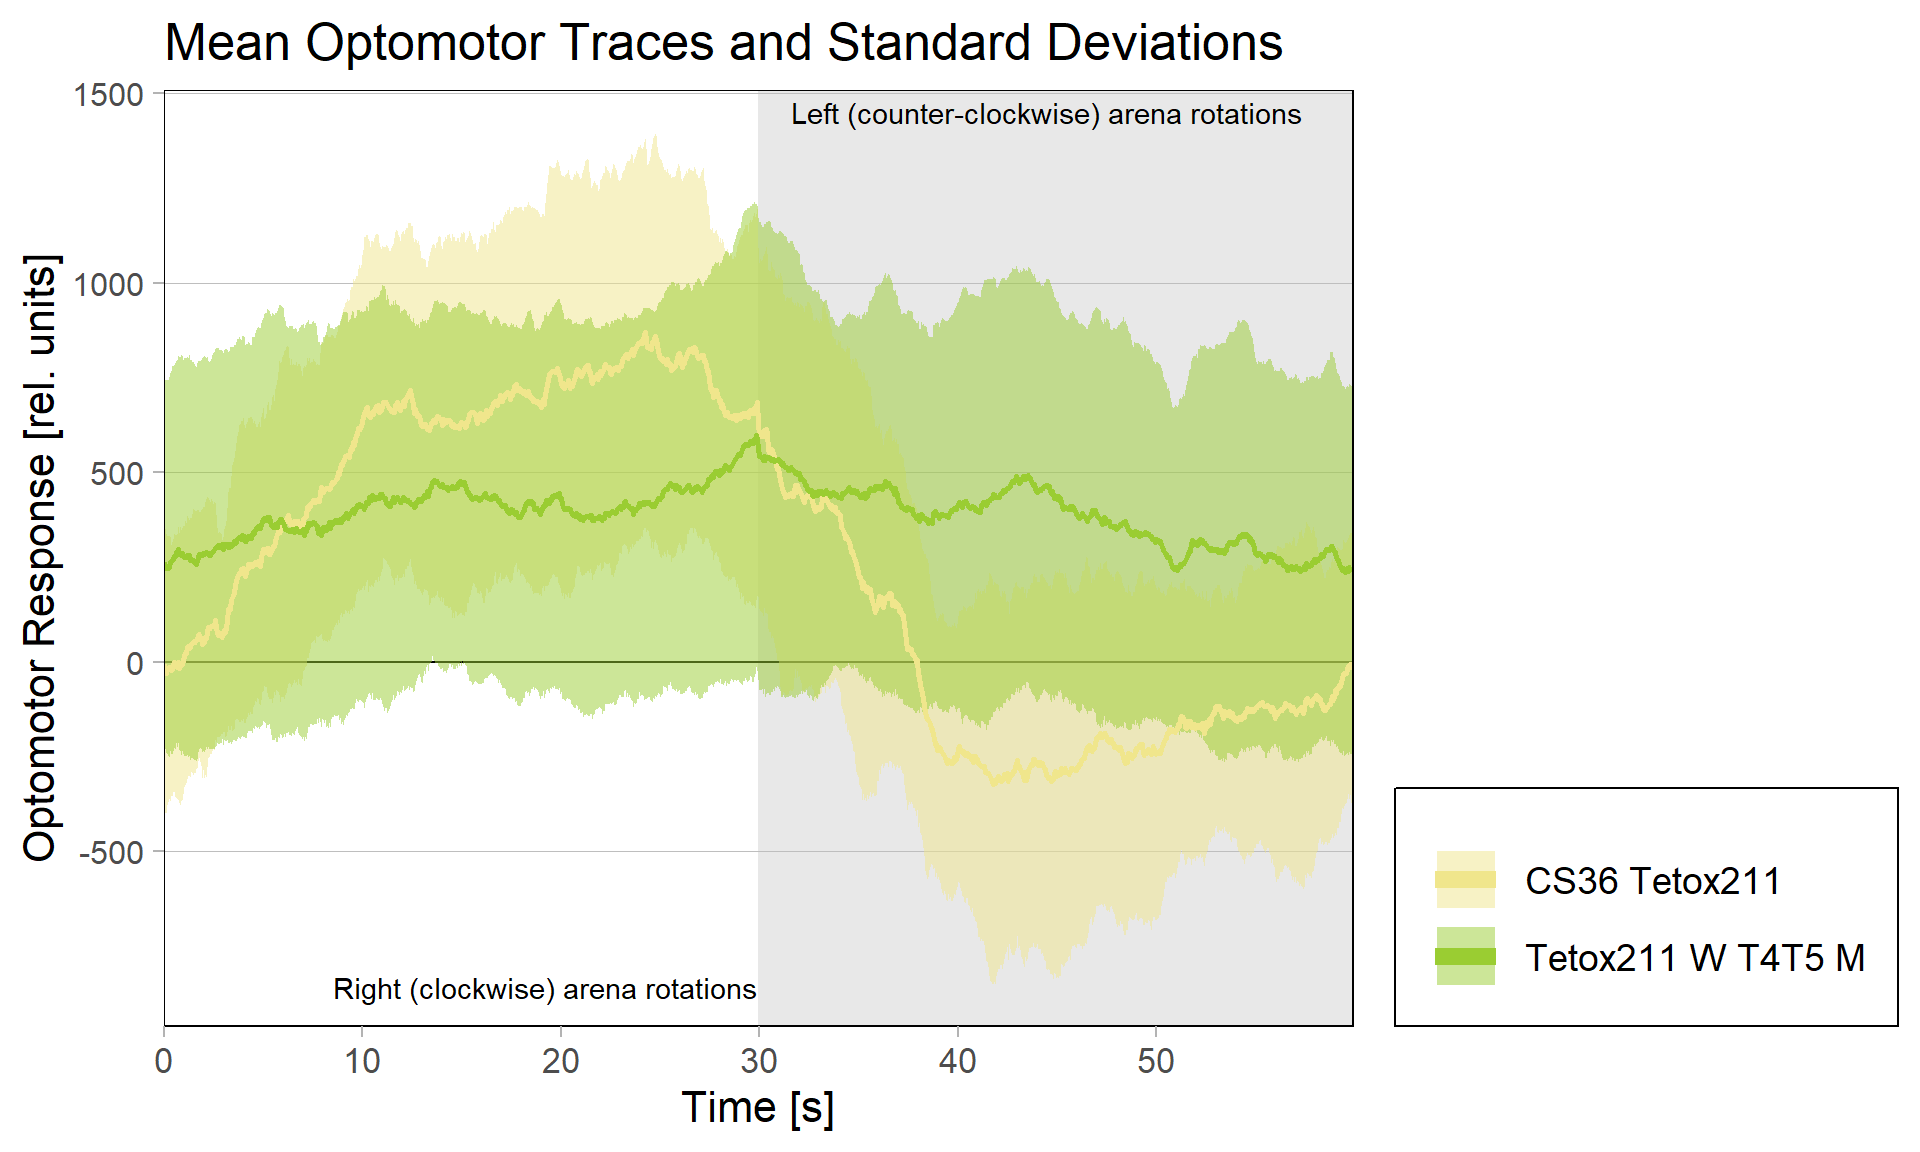
There had been some concerns about the optomotor display in the group evaluation sheets showing right-turning torque on the left side of the graph and vice versa. Also, the use of standard deviations seemed to blur differences between the experimental groups:
Because of these concerns, I have swapped the traces and used standard error of the means instead of standard deviations:
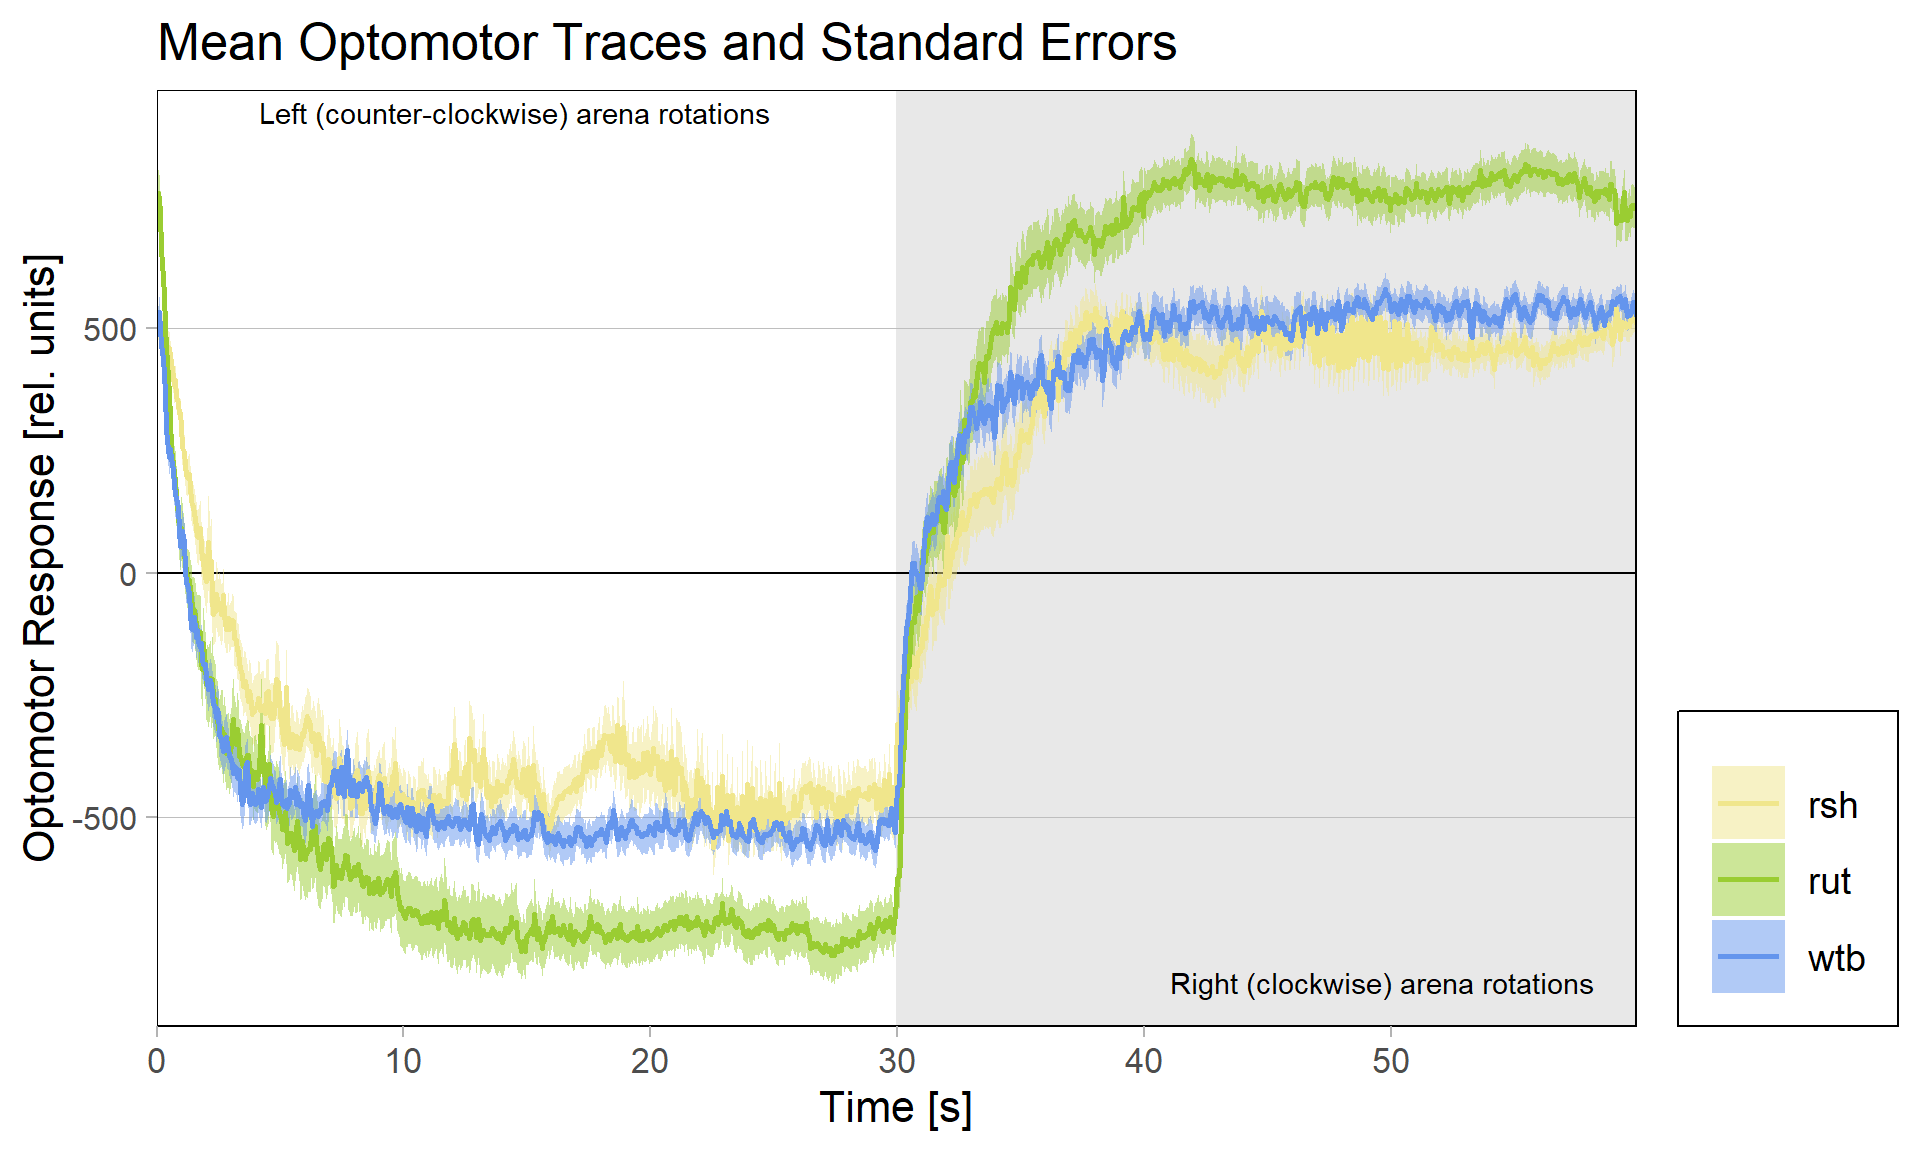
What do you think? Better or worse? Feedback very welcome!

Category: Optomotor response, R code | No Comments
Coded the regression analysis
on Thursday, September 7th, 2023 2:16 | by Björn Brembs
I now switched the sign of the Optomotor Asymmetry Index in flies that were punished on producing right-turning torque, such that weaker punished torque shows up as a positive index. After that was done, I plotted the correlation between the optomotor index and the preference index:
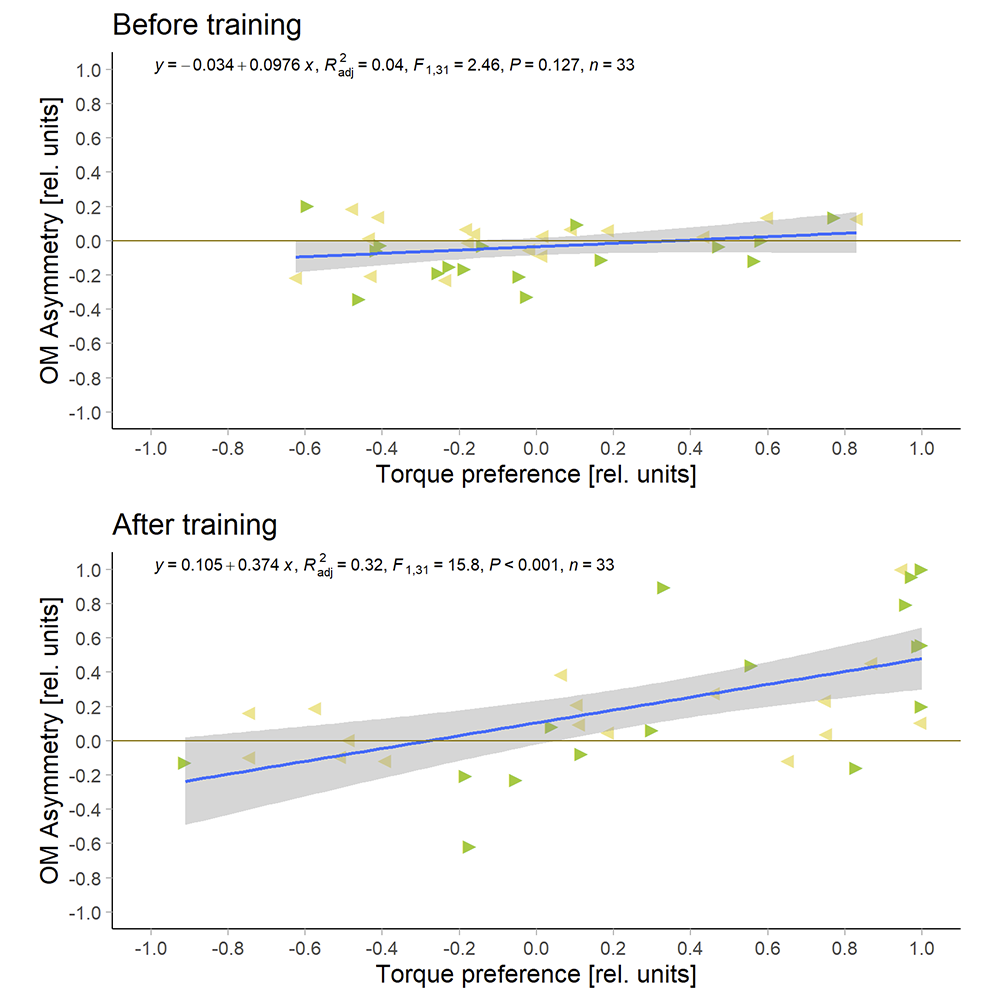
I had to get rid of eight flies where the optomotor response was already asymmetric before the training started, so now I only have 33 flies. But with these flies, there is no correlation before training and a very significant correlation after training.
Any suggestions about appearance of the graphs?
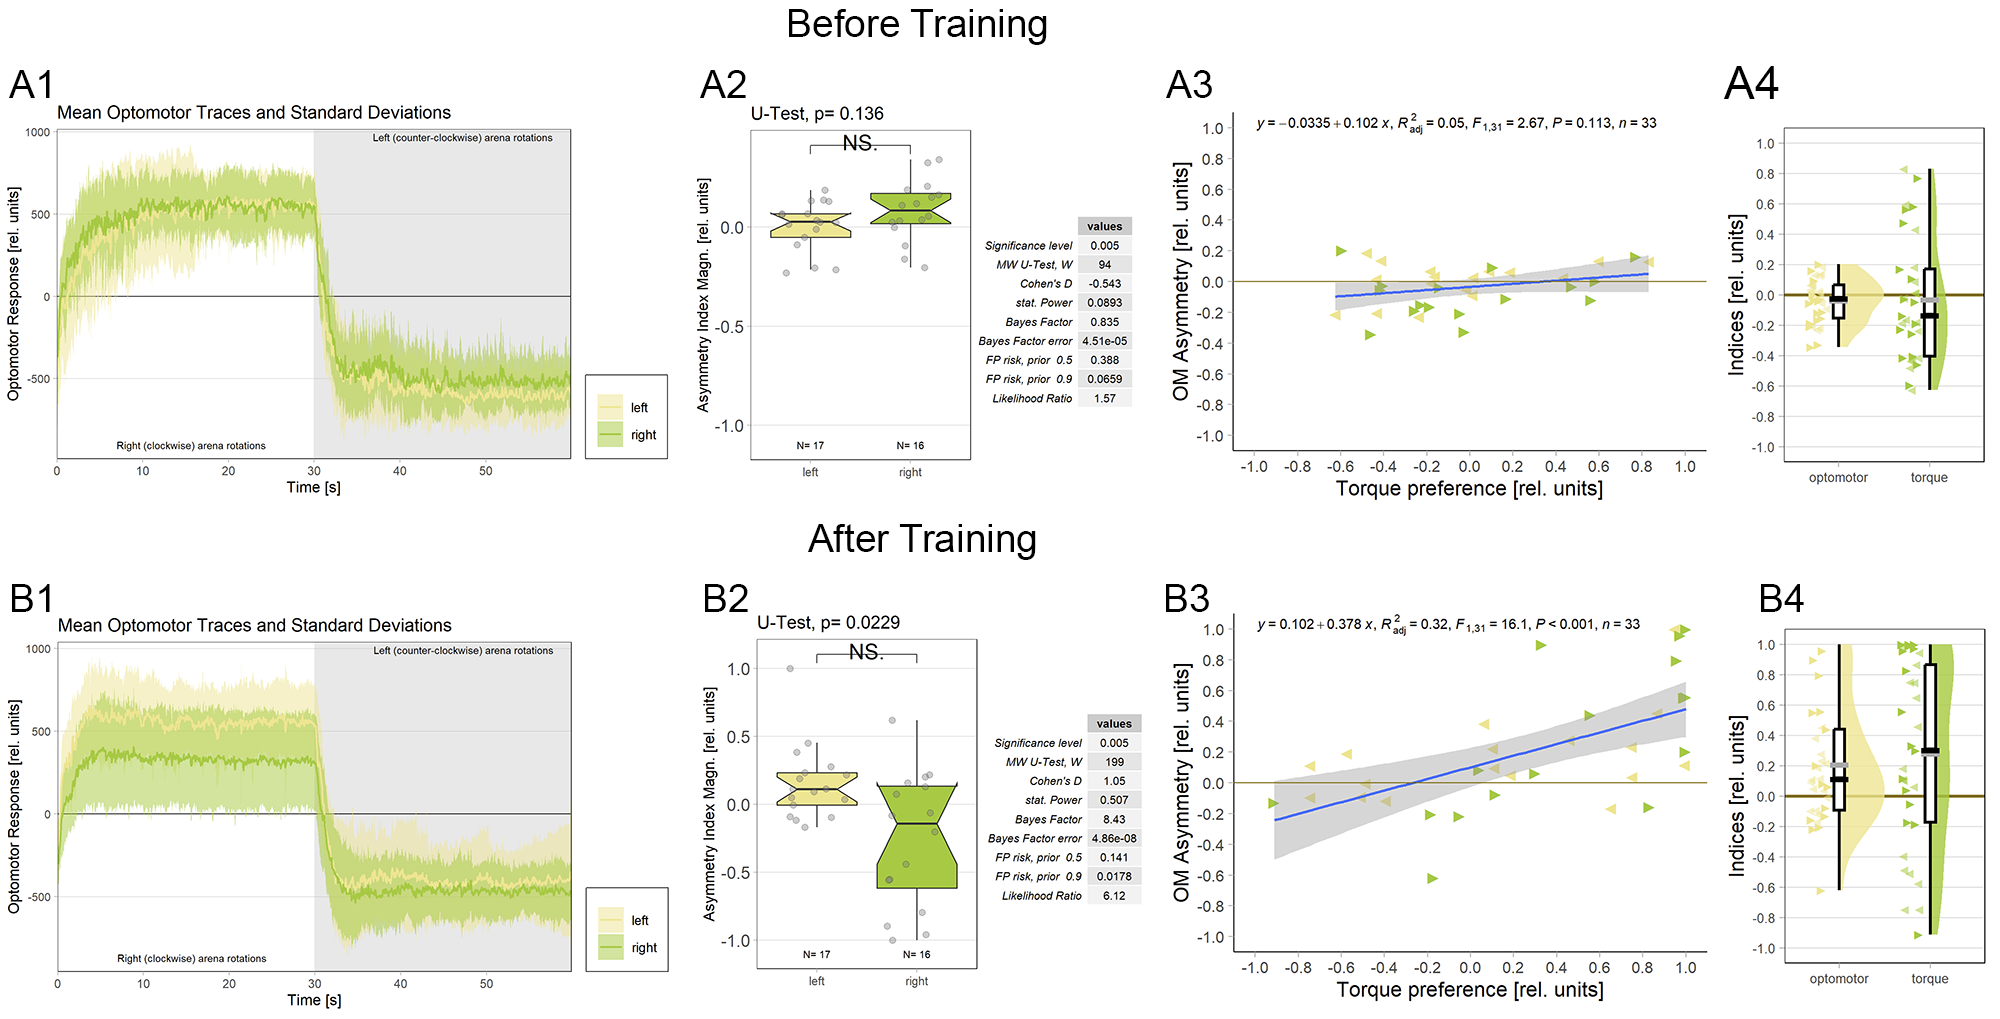
Would it be useful to plot optomotor and performance indices as raincloudplots next to the regressions?
This would be the complete figure:
Category: operant self-learning, Optomotor response | No Comments
Optomotor project nearing completion
on Monday, September 4th, 2023 1:59 | by Björn Brembs
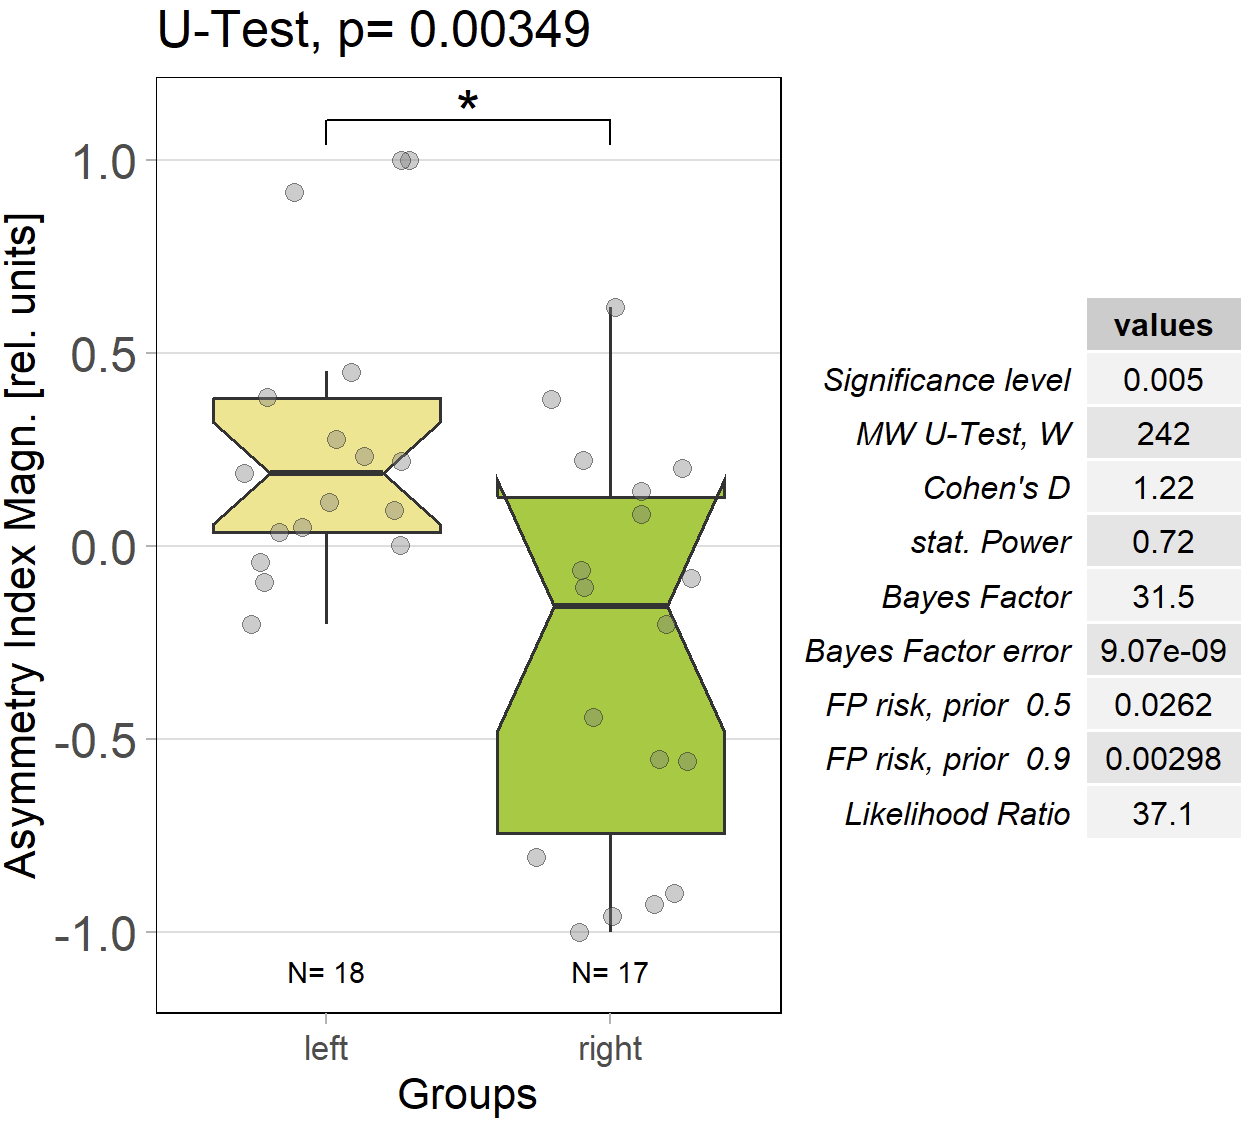
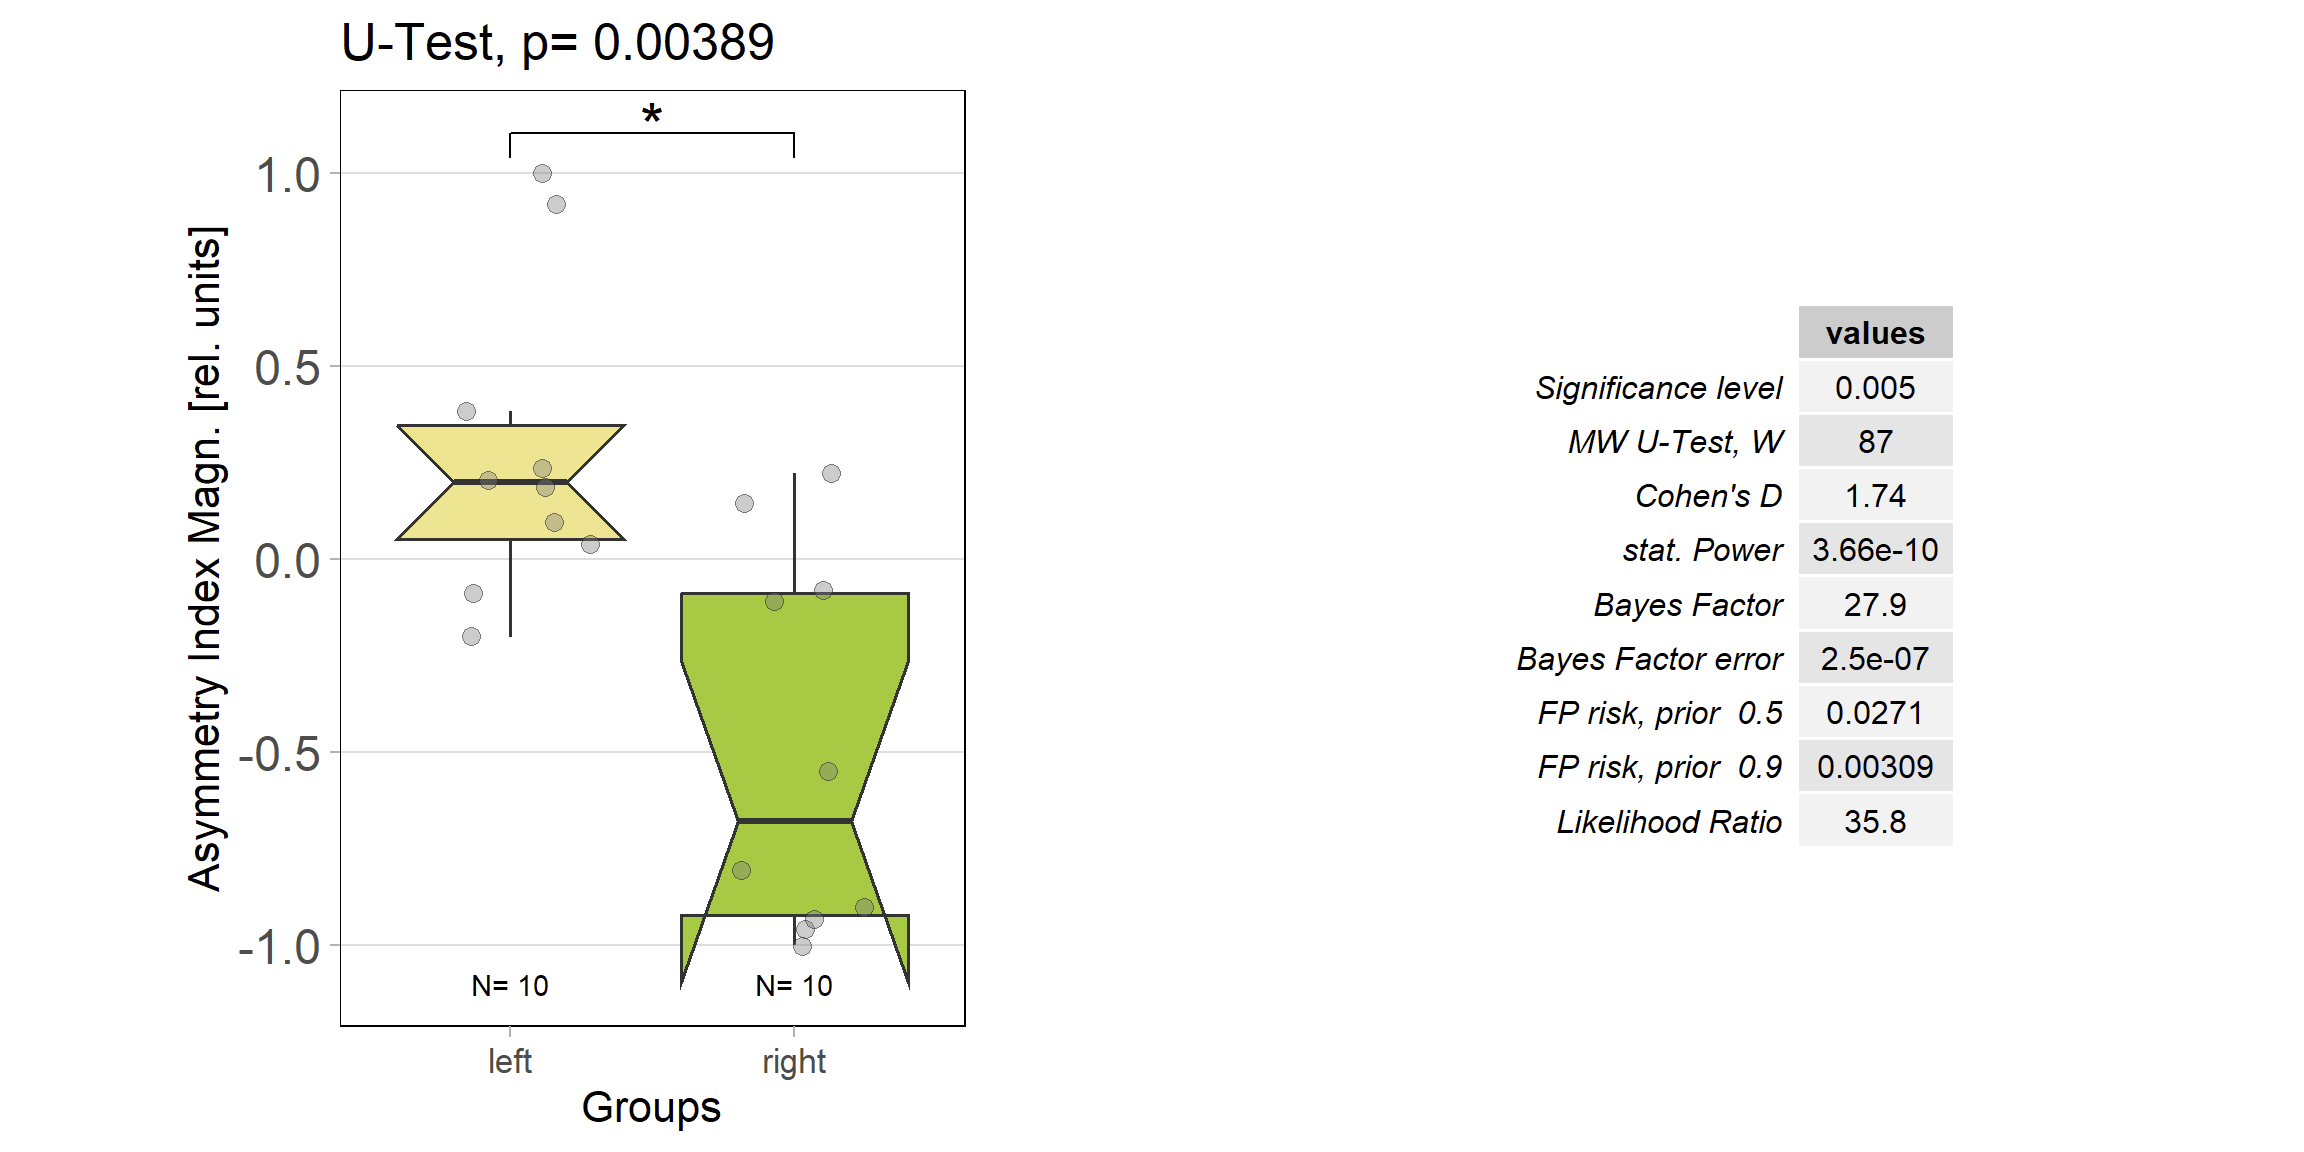
The results of comparing optomotor responses after self-learning remain solid. There still is a small asymmetry between the left/right groups, but nothing dramatic:
Category: operant self-learning, Optomotor response | No Comments
Bachelor Blog / #4 is there something?
on Monday, August 7th, 2023 2:13 | by Ellie
The offspring of my first experimental fly cohort finally hatched! Below you find a few first pre-tests I ran last week :)
First, here are the results of a quick test to see if the offspring shows a preference for the parentally trained side after the first training period:
After that I played around with the laser a little bit to find the learning threshhold. I set the laser on 2,6V but the results I got look a bit weird:
-> untrained wtb flies
-> offspring of trained wtb flies
I´m optimistic however there is still a lot of work to do…
Kicked out Canton S
on Thursday, June 29th, 2023 5:25 | by Björn Brembs
Since the Canton S strain I used wasn’t a perfect genetic background strain anyway and didn’t fly properly, I kicked it out and replaced it with the wild type Berlin data I had collected just prior to the rut and rsh mutants. Now I can collect data for two projects in one go: I check the rut/rsh learning mutants if they still behave the way they should and with the wtb control strain and continue collecting data to evaluate their optomotor responses after training. So now the learning scores for the three strains look like this:
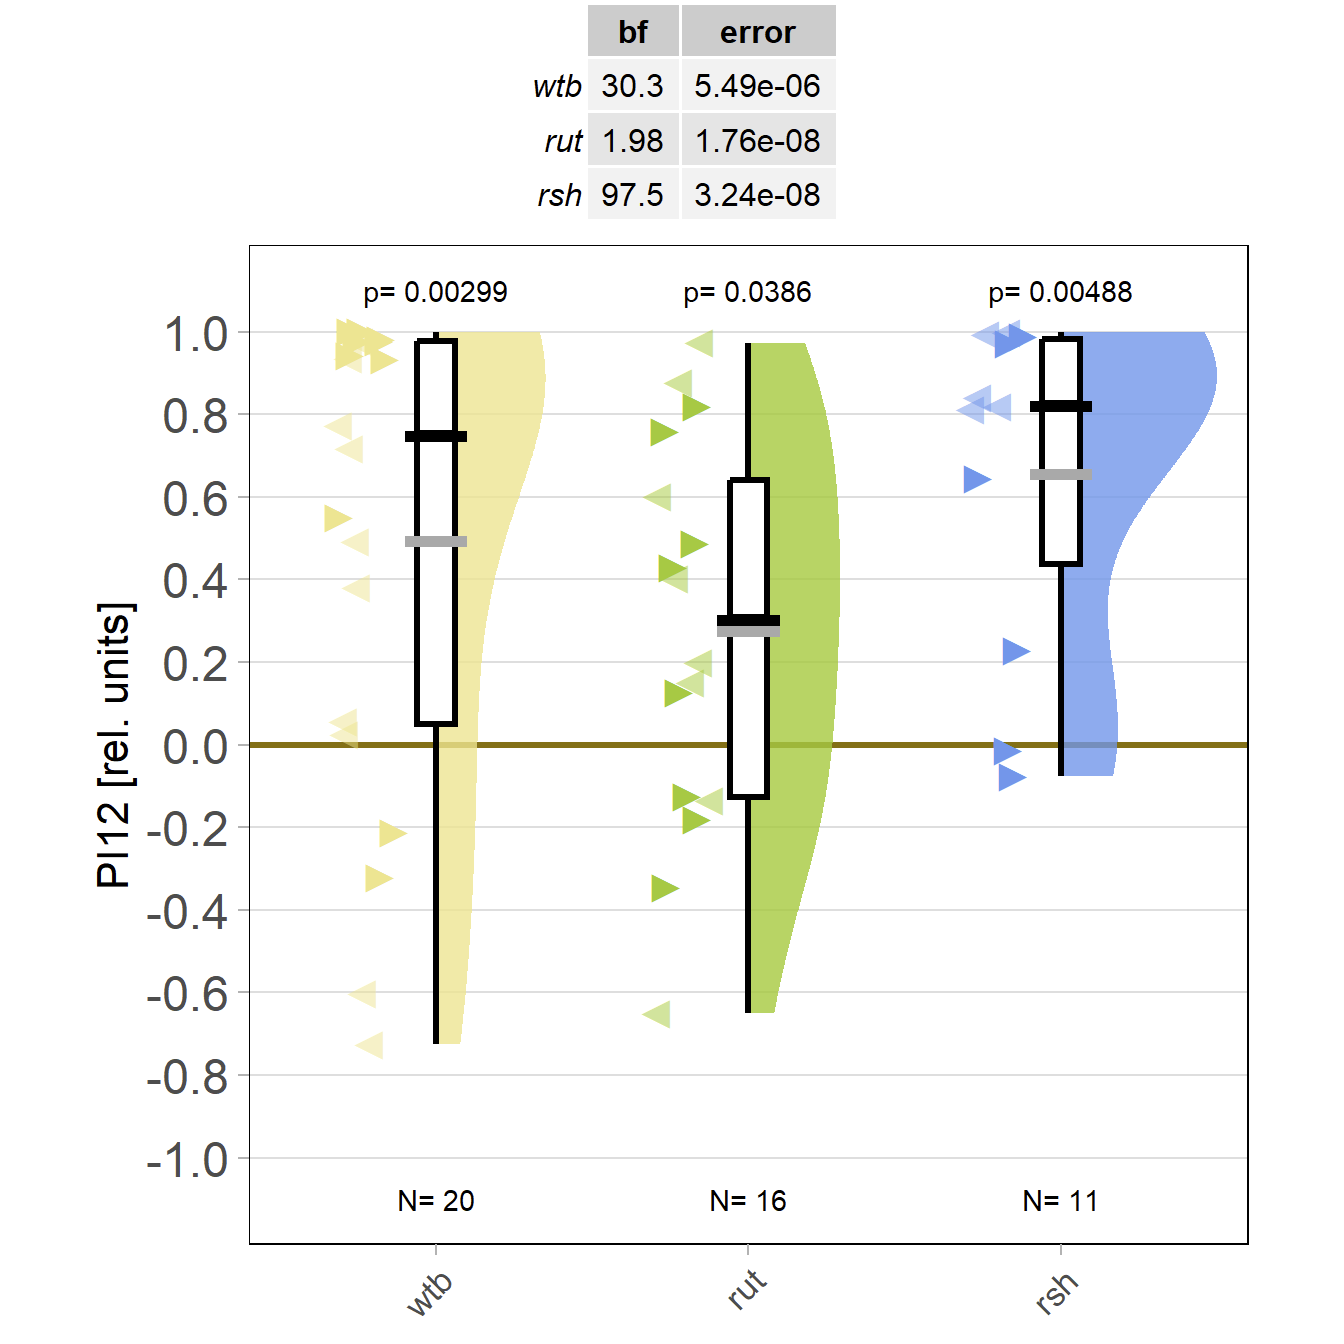
It still doesn’t look like rut is better than wtb, so I’m still skeptical that the strain is really what it should be. The rsh data also don’t look very promising, but I still need to get more flies with a negative preference before the training.
Category: operant self-learning, Optomotor response | No Comments
Optomotor asymmetry after torque learning
on Tuesday, June 6th, 2023 3:31 | by Björn Brembs
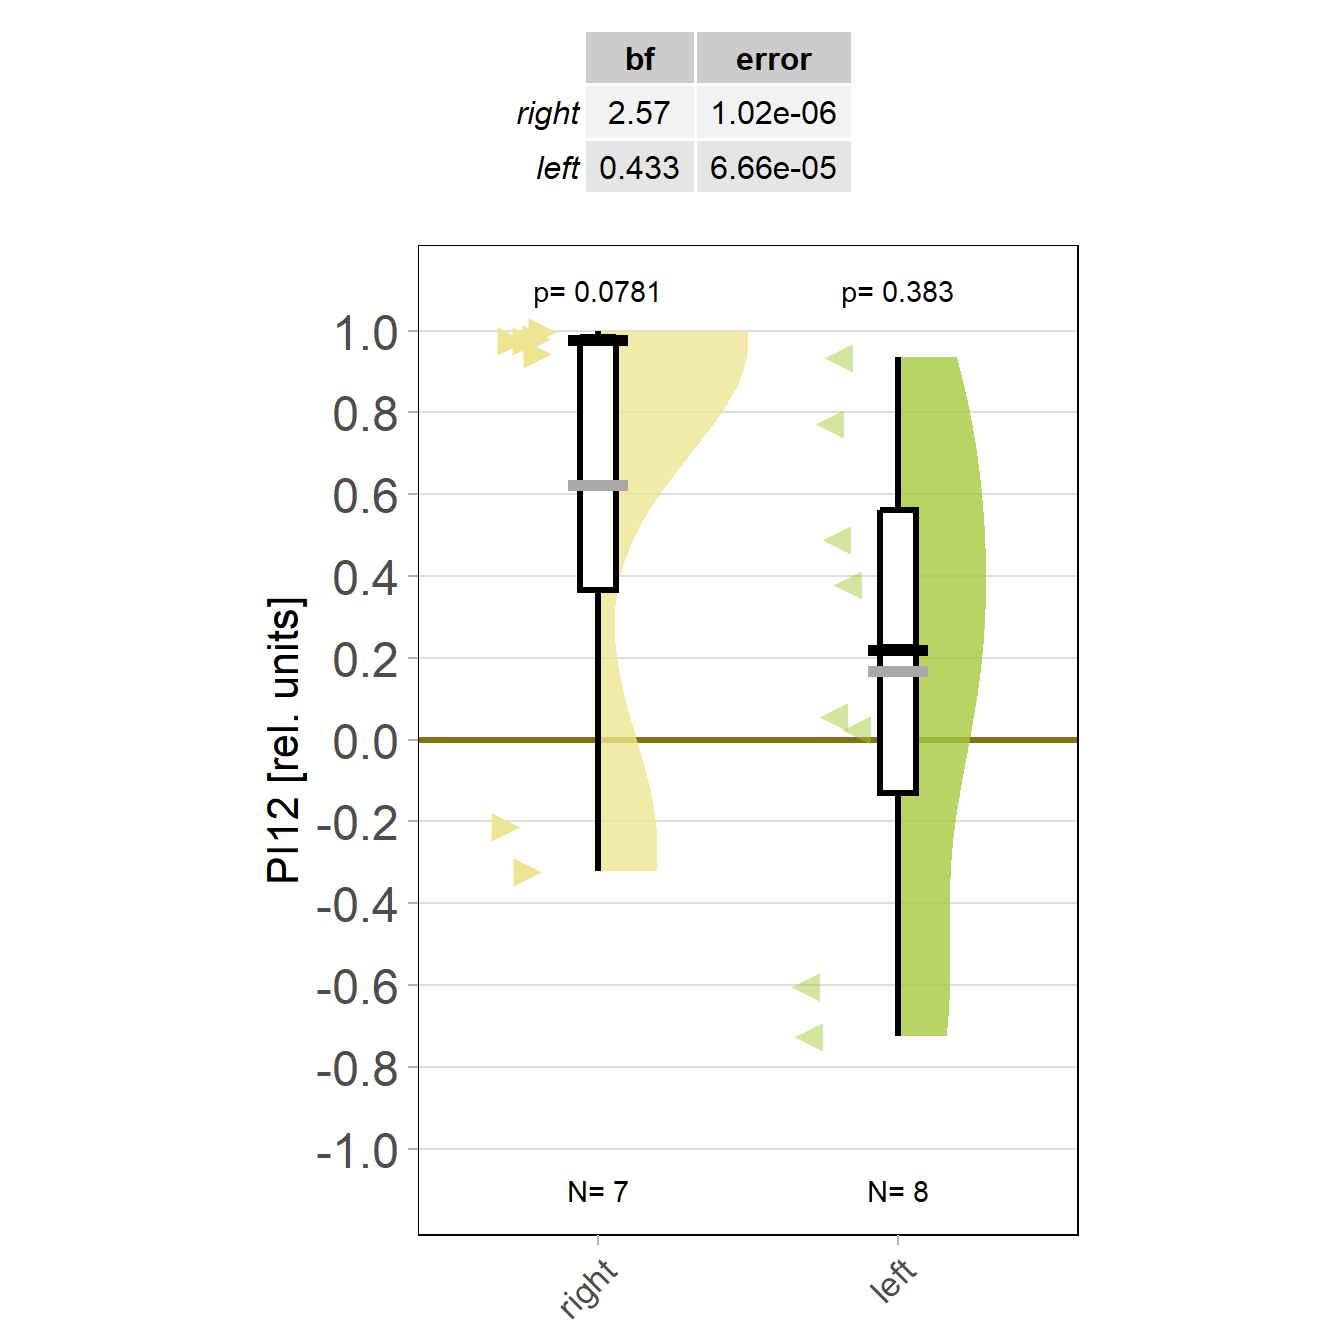
Only a few more flies compared to the first week, but the difference between optomotor responses after punishing left or right torque, respectively, is starting to show:
These data suggest I should fill the groups up to a sample size beyond 20 if I want to use these data somewhere…
Category: Operant learning, Optomotor response | No Comments
Optomotor effects after torque learning?
on Friday, May 26th, 2023 5:04 | by Björn Brembs
After training 14 flies it looks as if the new setup is working as it should:

Looking at the optomotor traces more closely now that (a) we know that motor neurons are the only site of plasticity and (b) we routinely record optomotor behavior after training, something very interesting appeared when comparing flies that have been trained on one turning direction with flies trained on the other side:
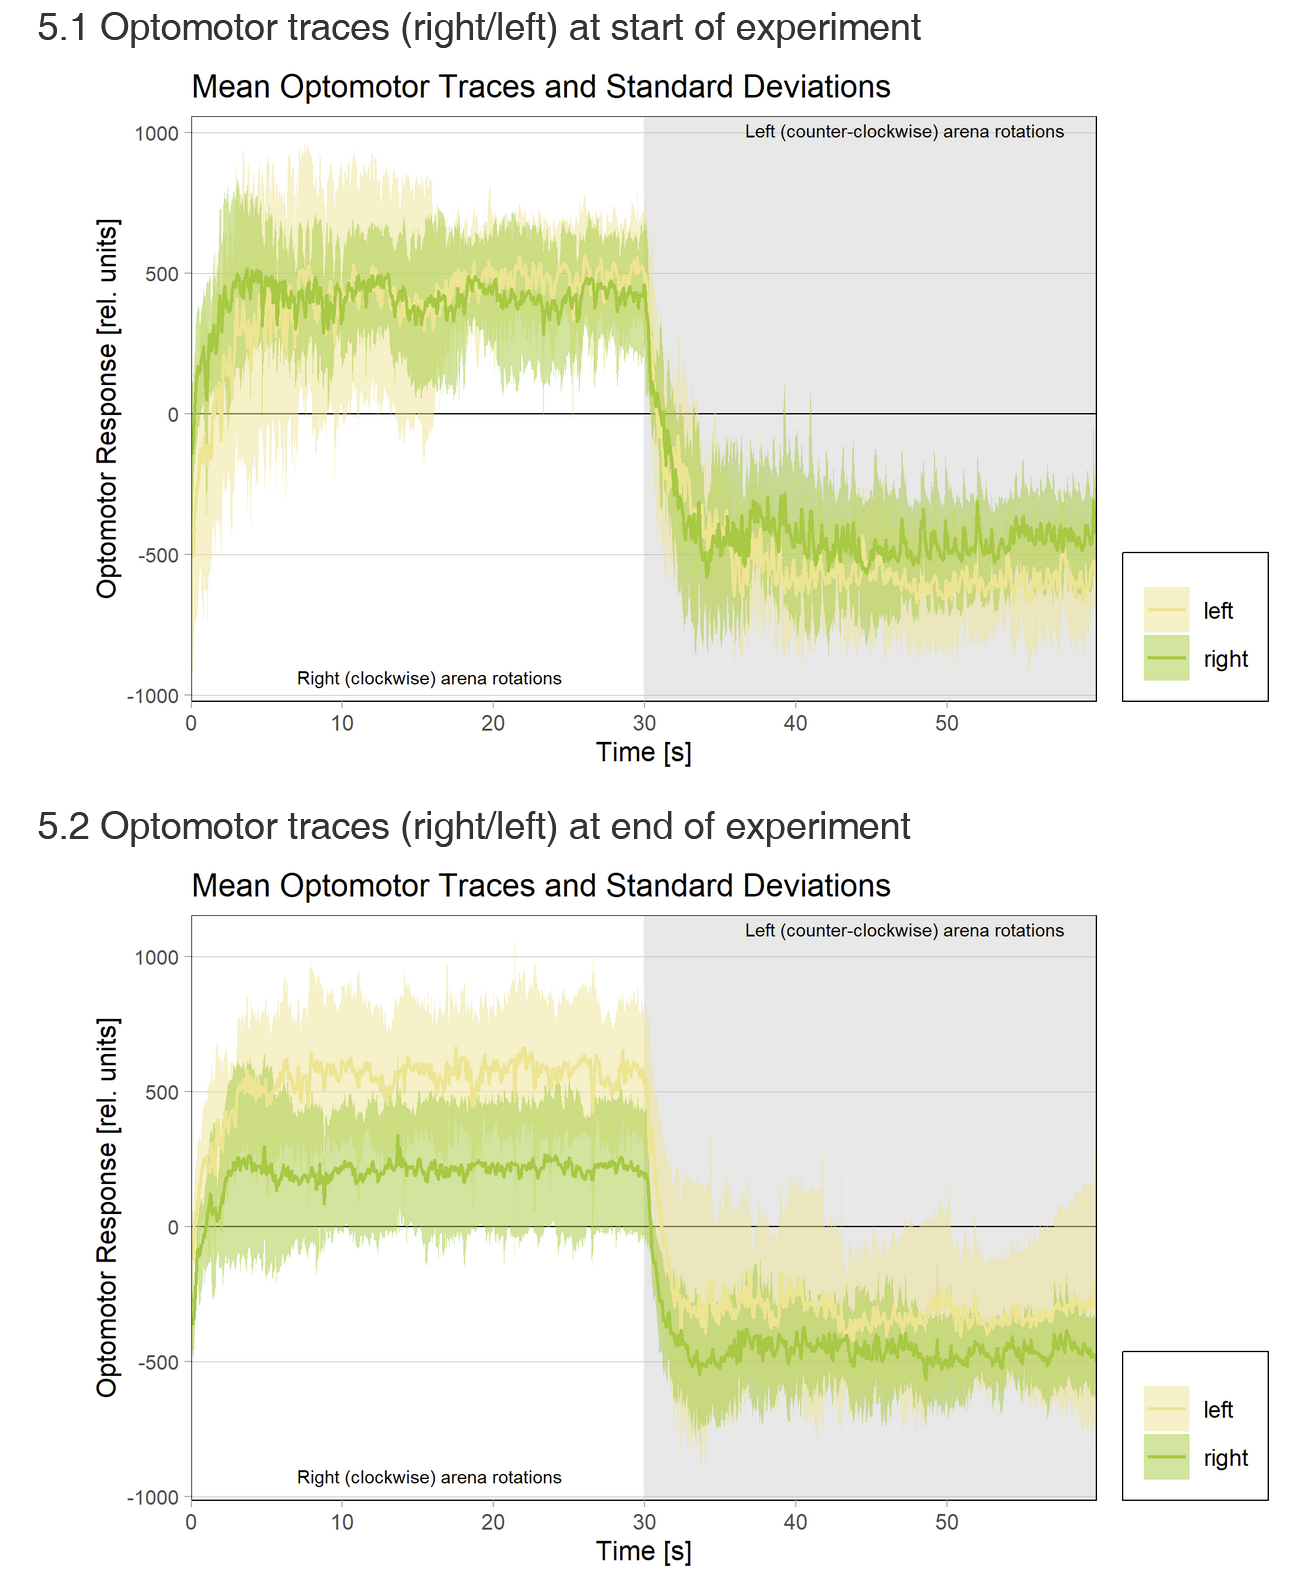
Flies trained to avoid right turning show reduced optomotor response to the right and vice versa! The weaker effect for ‘left’ may be due to the weaker learning in this group?
Anyway, I have never seen this and find it quite exciting!
Category: Operant learning, Optomotor response | No Comments
Laboratory course report: Optomotor response screening
on Saturday, July 31st, 2021 1:49 | by Simon Benmaamar
Abstract
In the visual system of Drosophila, T4/T5 neurons have been characterised as first stage of computation of the direction of visual motion, as blocking these neurons results in a lack of optomotor response. However, until now it has still not been completely revealed, how these neurons acquire their properties essential for sensing motion. Drgx and CG14340, which had been identified as possible candidates, do not seem to affect motion detection, as silencing or knocking down did not impair the optomotor responses. Furthermore, there seems to be a strong selectivity regarding different effector lines, as blocking T4/T5 neurons in order to abolish the optomotor responses was only successful with one UAS-TeTxLC line. Blocking the T4/T5 neurons viaKir 2.1 did not impair the optomotor response with either of the different UAS-Kir2.1 effector used.
1 Introduction
To safely navigate through a constantly changing space, it is indispensable for flies to integrate self-motion and environmental information in order to be able to perform very precise and robust flight maneuvers (Sherman and Dickinson, 2004; Budick et al., 2007). When tethered flies are exposed to optical stimuli in a rotating arena, they actively try to steer in the direction of motion in order to stabilize the visual image on the retina, a behaviour known as optomotor response (Götz, 1968).
In Drosophila melanogaster, T4/T5 neurons are known as the first stage of computation of the direction of visual motion. They both exist in four subtypes in which each responds to one of the cardinal directions and project axons into one of the four lobula plate layers (Maisak et al., 2013). T4 neurons receive input from neurons brightness increments, whereas T5 neurons receive input from neurons encoding brightness decrements (Joesch et al., 2010; Maisak et al., 2013; Shinomiya et al., 2014). Previous studies have already shown the impact of these neurons on motion detection as blocking T4/T5 neurons resulted in a lack of optomotor response (Schnell et al., 2012; Bahl et al., 2013; Maisak et al., 2013). However, which molecular components are involved for T4/T5 neurons to acquire their properties essential for sensing motion, is still not fully understood. Drgx, which encodes a paired-like homeobox transcription factor, was found to be a potential candidate as it is expressed in T4/T5 neurons and silencing drgx resulted in anatomical changes in the T4/T5 neurons. CG14340 is expressed in Tm1 and T4/T5 neurons and predicted to activate drgx expression (Rass, 2021).
This work focuses on this topic by screening the optomotor behaviour of drgx knock down flies and a CG14340 mutant line. Furthermore, it was tried to reproduce the previous achieved results of flies with blocked T4/T5 neurons by using different UAS-Kir2.1 and UAS-TeTxLC effector lines.
2 Materials and methods
2.1 Fly stocks and maintenance
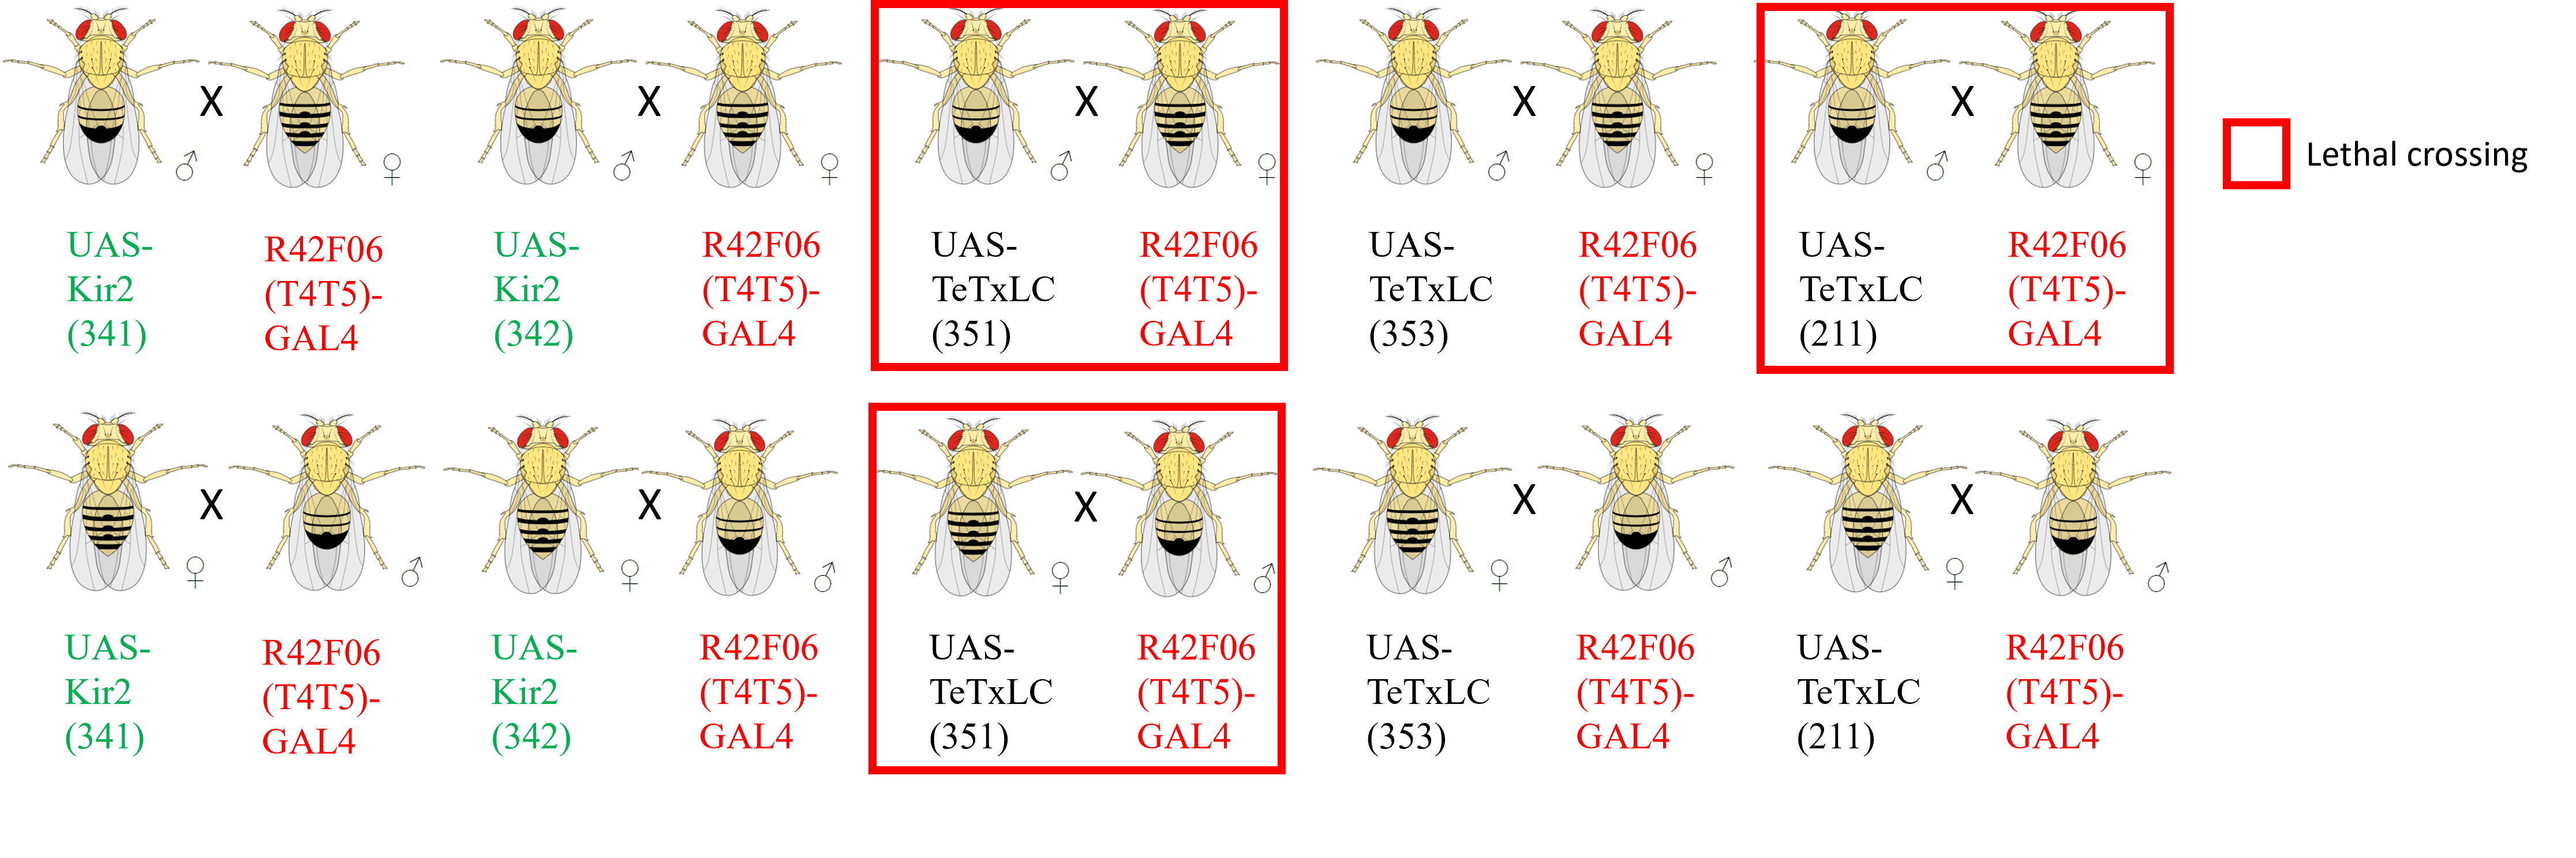
Flies were maintained in plastic vials with standard cornmeal agar medium at 25°C and 60% humidity on a 12h/12h light and dark cycle. The following strains were used as driver lines: R9B10-Gal4, R39H12-Gal4, R42F06-Gal4, nsyb-Gal4. For knock-down experiments, UAS-Drgx-Rnai, UAS-Cherry-Rnai (control) were used. The CG14340-lexA line was produced via CRISPR/Cas9 gene knock-in (Rass, 2021). Two different UAS-Kir2.1 effector lines (341, BL#6596; 342, BL#6596) and three different UAS-TeTxLC effector lines (351, BL#28837; 353, BL#28841; 211, BL#28838) were used for blocking experiments (first number indicates the number that is used for the fly line in the fly stock of the lab (Brembs’ lab), #BL = Bloomington ID). To label T4/T5 neurons, the UAS-CD8::GFP fly strain was used. Crossings with Canton S wild type flies served as controls. In all experiments, 1–3-day old adult flies were tested. Additionally, 2 weeks old CG14340-lexA flies were tested. Only female flies were tested in the experiments except for the R9B10-Drgx and R39H12-Drgx flies. For blocking the T4/T5 neurons, the crossings were set up reciprocally (Figure 1). The crossing with one of the UAS-TeTxLC effector line (352) turned out to be lethal in both directions: Larvae were unable to pupate. Crossing with another UAS-TeTxLC effector line (211) was only lethal when females of the R42F06-Gal4 driver line were used.
2.2 Behavioural essay and analysis
2.2.1 Optomotor setup
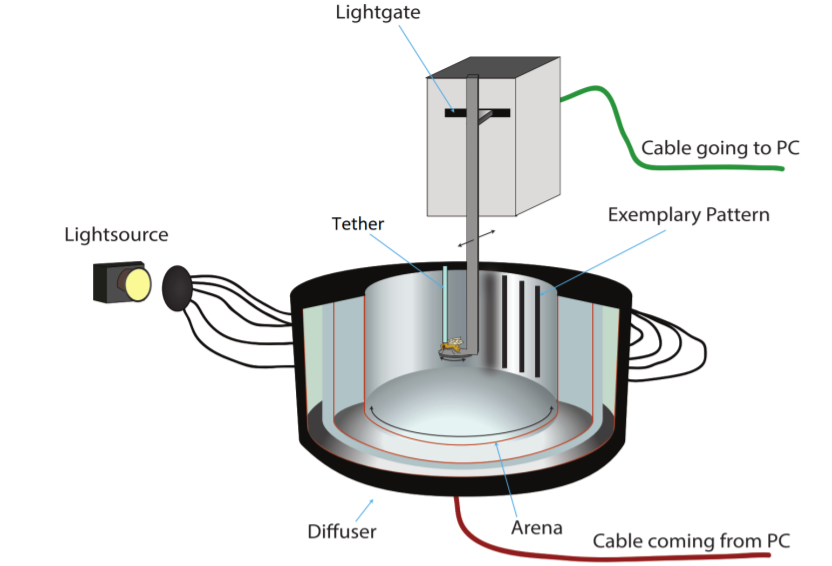
Flies were cold-anesthetized and a small stick of fishing line (length of ~ 2 cm) was glued on the centre of the thorax via a UV sensitive glue. The flies were still able to freely move their head and wings and stored for at least 1 hour prior to the experiments in a thin ring of foam rubber attached to a petri dish. Via a clamp the animals were positioned with their sticks on a platform in the middle of the arena. To test the optomotor response of walking flies, the setup of von der Linde (Linde, 2018) was used (Figure 2): The arena of this optomotor setup is illuminated by a 100 W light bulb with a filter for heat generating wavelengths. Transparent plastic tubes are responsible for a homogeneous distribution of the light. On the inside of the cylindrical arena, an even pattern of black and white stripes can be found. The rotation of the arena is achieved via a motor controlled by a motor unit that receives signals from a Digital-Analog-Converter (DAC) connected to a computer. The platform consists of a bent tin strip where the fly is placed on the horizontal plane and able to push the platform to the left and right. This movement of the platform is then detected by a photoelectric sensor. Using a python-based script, the platform signal will be read at 100 Hz and a live graph showing the platform position as well as the arena position can be seen. The duration of each experiment was 5 minutes, with alternating rotations for 30 seconds and the metadata for each experiment were saved as an xml-file.
2.2.2 Evaluation of the optomotor data
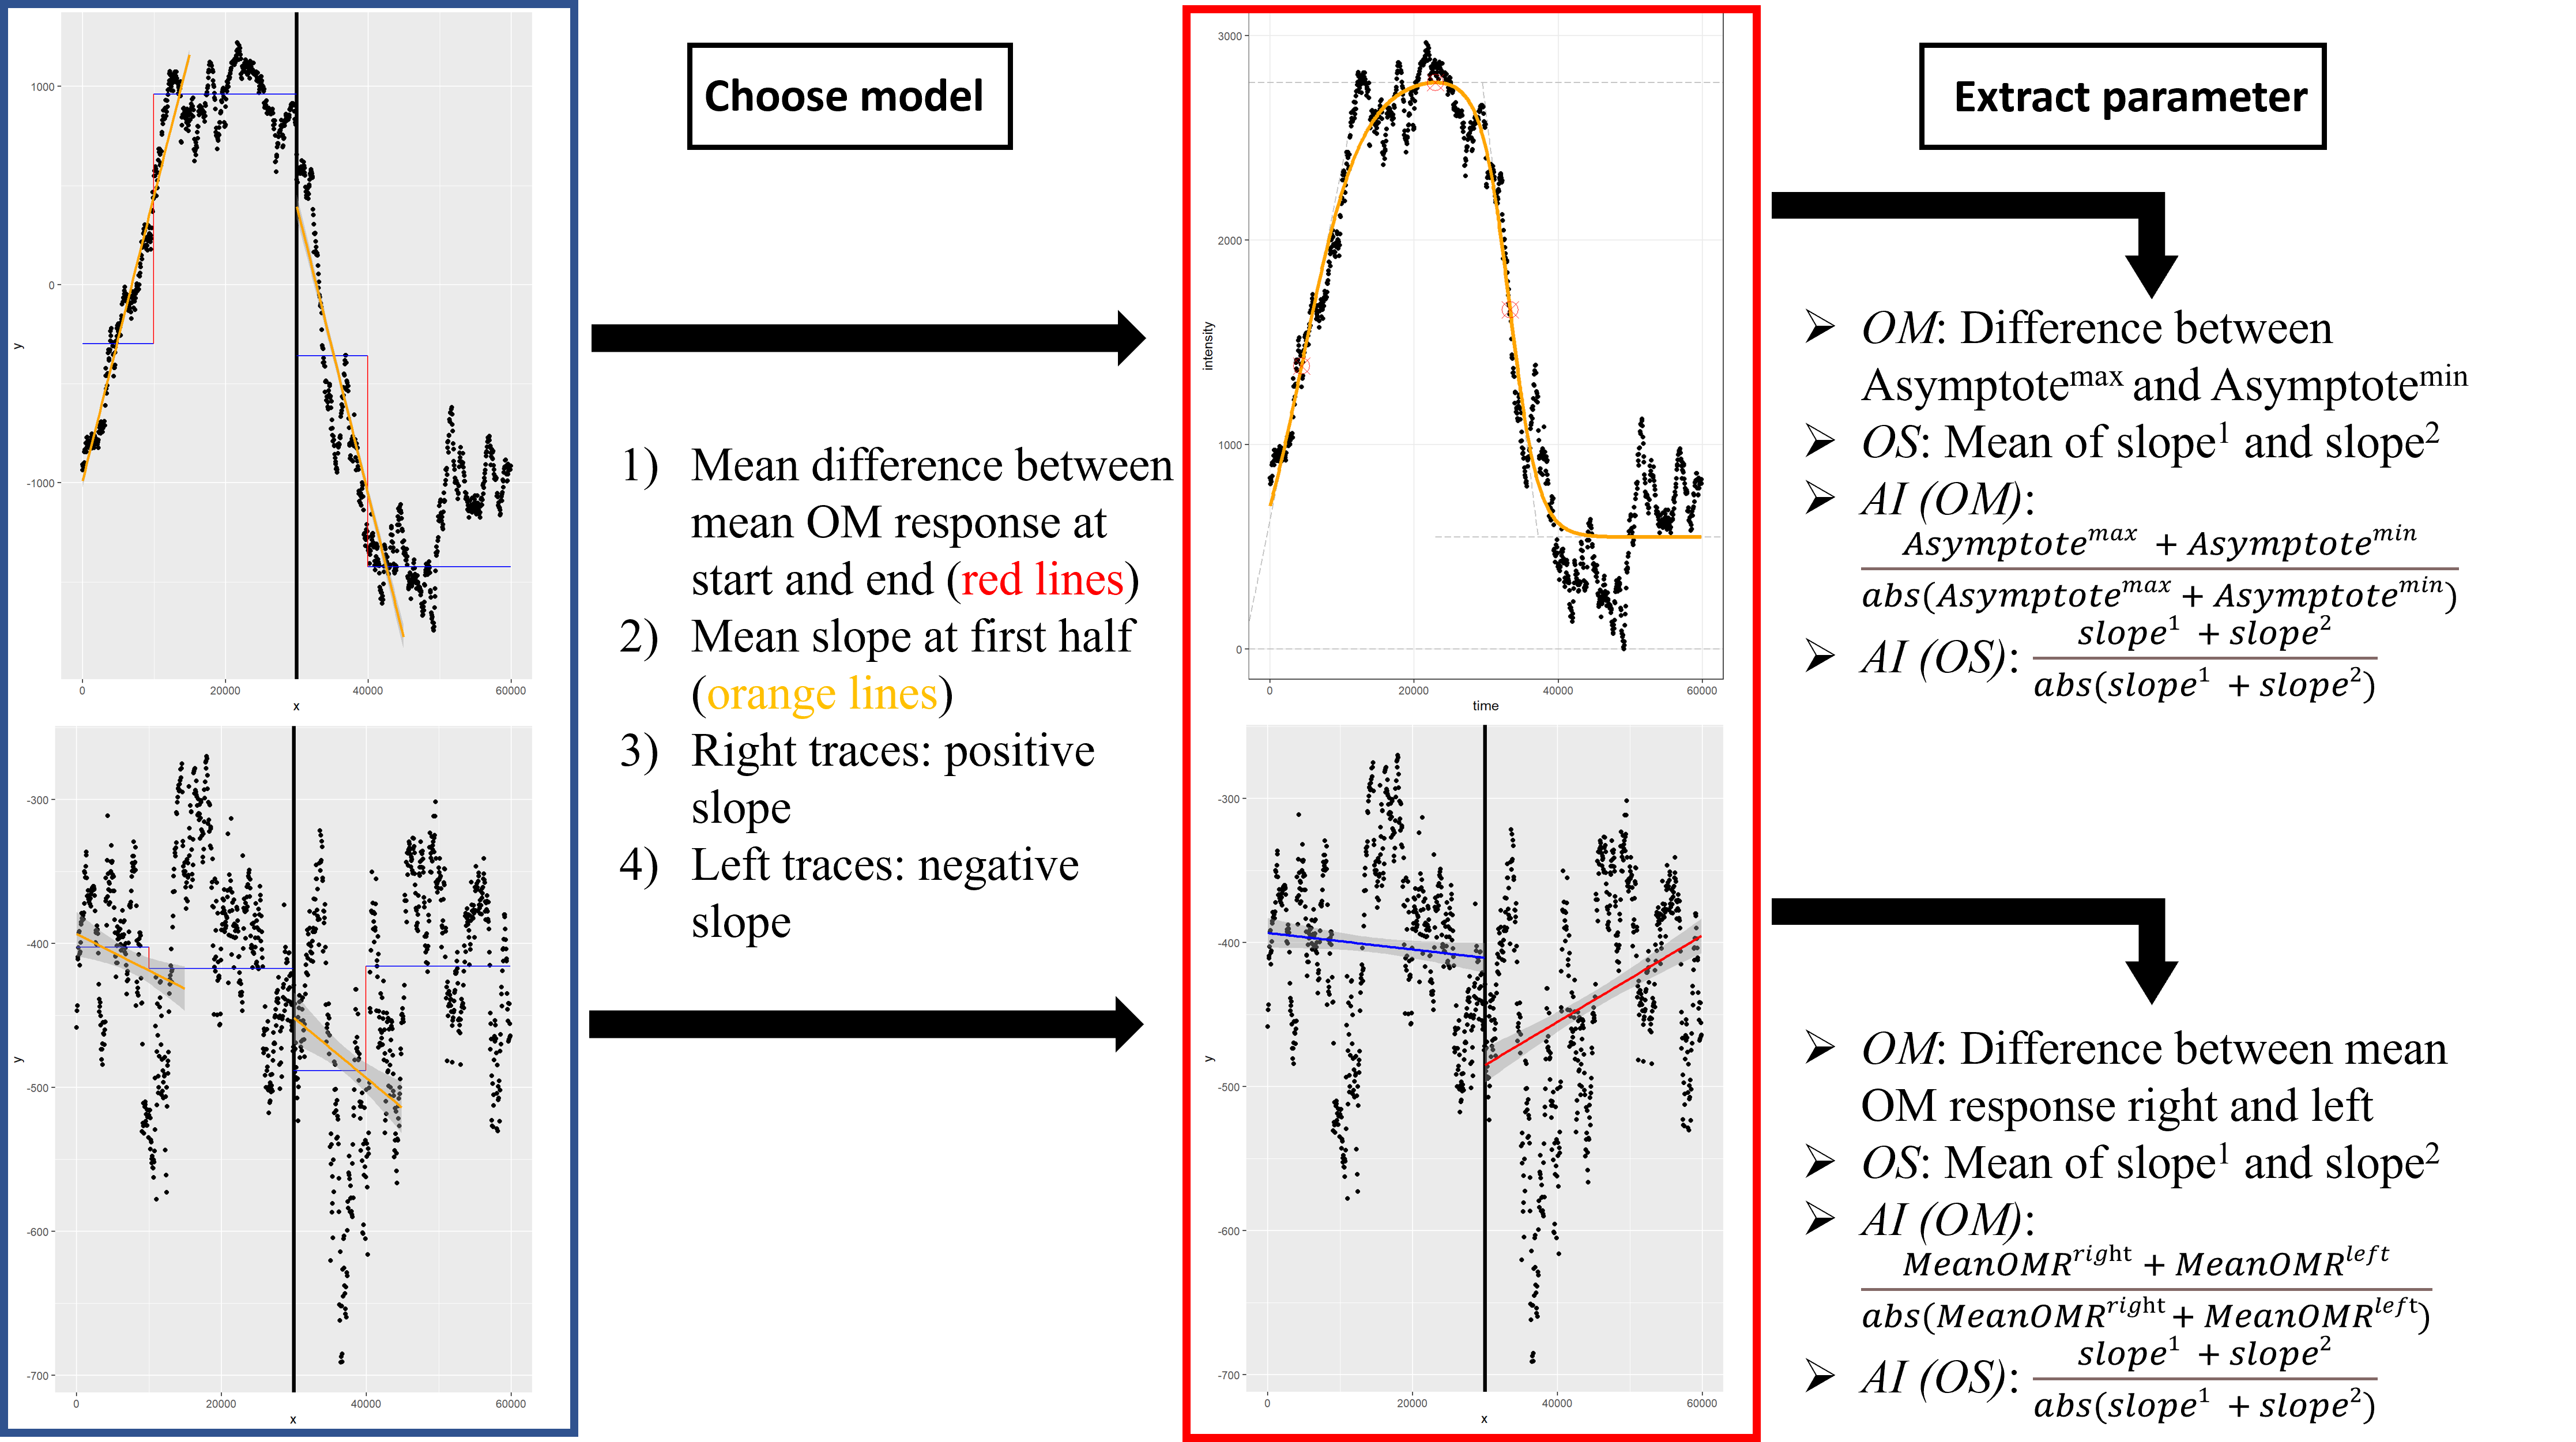
Using a R based script, the individual mean optomotor traces for each rotation (left and right turning of the arena) can be plotted. Flies performing an optomotor response will push the platform to one side as an attempt to follow the rotation of the patterning. When switching the direction of the rotation, the fly will push the platform towards the opposite direction. As a result, the traces of flies showing an optomotor response tend to look like a double-sigmoidal curve. On the other hand, it is of course possible that some flies lack an optomotor response. In this case, a double-sigmoidal model would not fit and therefore a linear model is needed. To determine, whether the observed traces would fit a double-sigmoidal model, four criteria need to be fulfilled (Figure 3): The mean difference between the mean optomotor responses at the beginning (0-10/30-40 s) and the end (20-30/50-60 s) of the right and left rotations needs to be above a certain value. The same applies for the slope of a linear fit of the optomotor traces at the first half (first 15 s) of clockwise and counter-clockwise rotation. Furthermore, this slope must be positive for the right turning optomotor traces and negative for the left turning optomotor traces. To look for differences in optomotor behaviour, the script is able to calculate four different parameters: optomotor magnitude (OM), optomotor slope (OS) and the asymmetry indices for the optomotor magnitudes and slopes. The optomotor magnitude indicates how strong the optomotor response was, whereas the optomotor slope is an indicator of how fast the optomotor response war. For the sigmoidal model, the OM is calculated as the difference between the maximum and the minimum asymptote. The slope is detected as the mean of the first and second slope. For the linear model the OM is determined as the difference between the mean optomotor responses of the right rotation traces and the mean optomotor response of the left rotation traces. The slope is calculated as the mean of the slopes of the linear fit of the right and left turning optomotor traces. Furthermore, the asymmetry indices of the optomotor magnitude and the slope can be calculated in both models. A Mann-Whiney U test is performed to look for statistical differences. The script is available at “https://github.com/brembslab/DTSevaluations”.
2.3 Brain dissection and imaging
Brains of female adult flies were fixated for 2 hours in 4 % PFA-TX100 and subsequently dissected in PBS. After that, they were washed three times with PBST (0.1 % TX-100) for 10 minutes and one time with PBS for 5 minutes and then mounted in VectaShield H-1000. A total of 5 brains were dissected. Imaging was performed with a Leica TCS SP8 confocal microscope.
3 Results
3.1 Silencing drgx in T4/T5 neurons did not impair the optomotor response
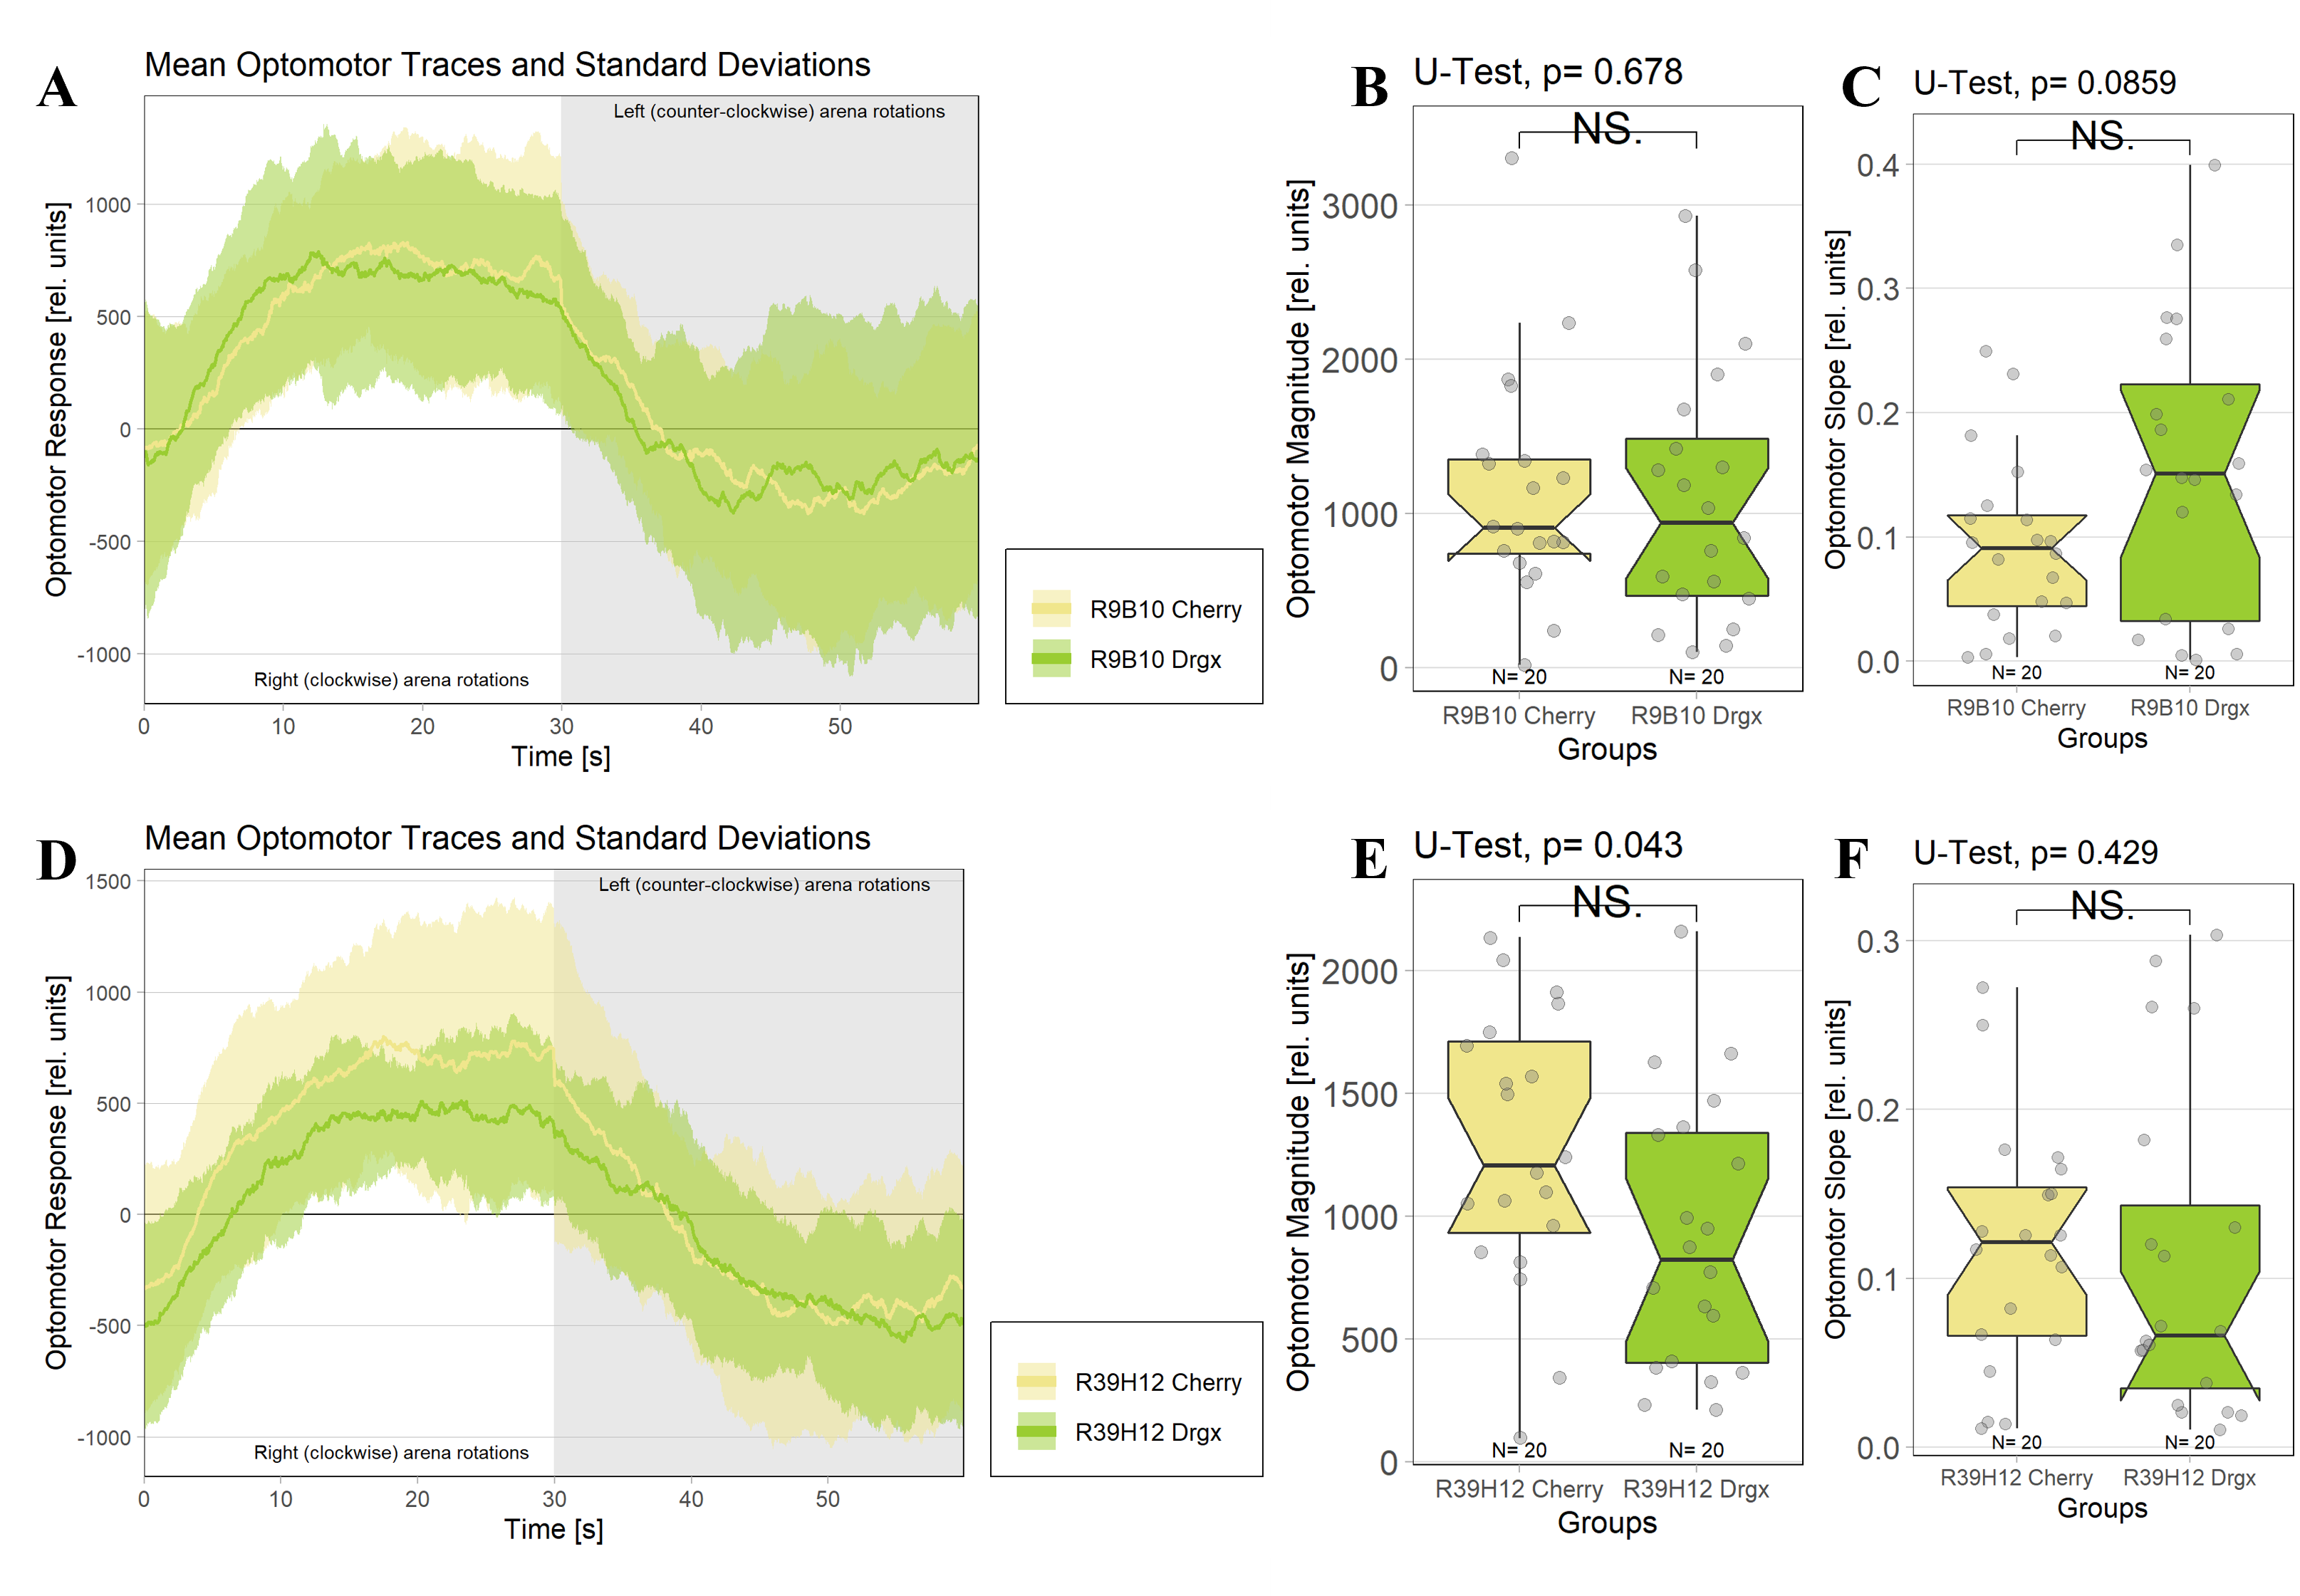
A specific knockdown of drgx was performed by combining UAS-Drgx-Rnai effector lines with two different Gal4 driver lines. The R39H12-Gal4 driver line drives expression in T4/T5 neurons from late L3 larval stage onwards (Schilling et al., 2019) and the R9B10-Gal4 driver line already at an earlier stage in neuroblasts (Rass, 2021). Using either the R39H12-Gal4 or the R9B10-Gal4 driver line to knock down the drgx expression in T4/T5 neurons at different developmental stages did not impair the optomotor response, as in both cases no significant differences in the optomotor magnitudes as well as optomotor slopes were found compared to control flies that were crossed to a UAS-Cherry-Rnai effector line. (Figure 4).
3.2 CG14340 mutant flies showed solid optomotor responses
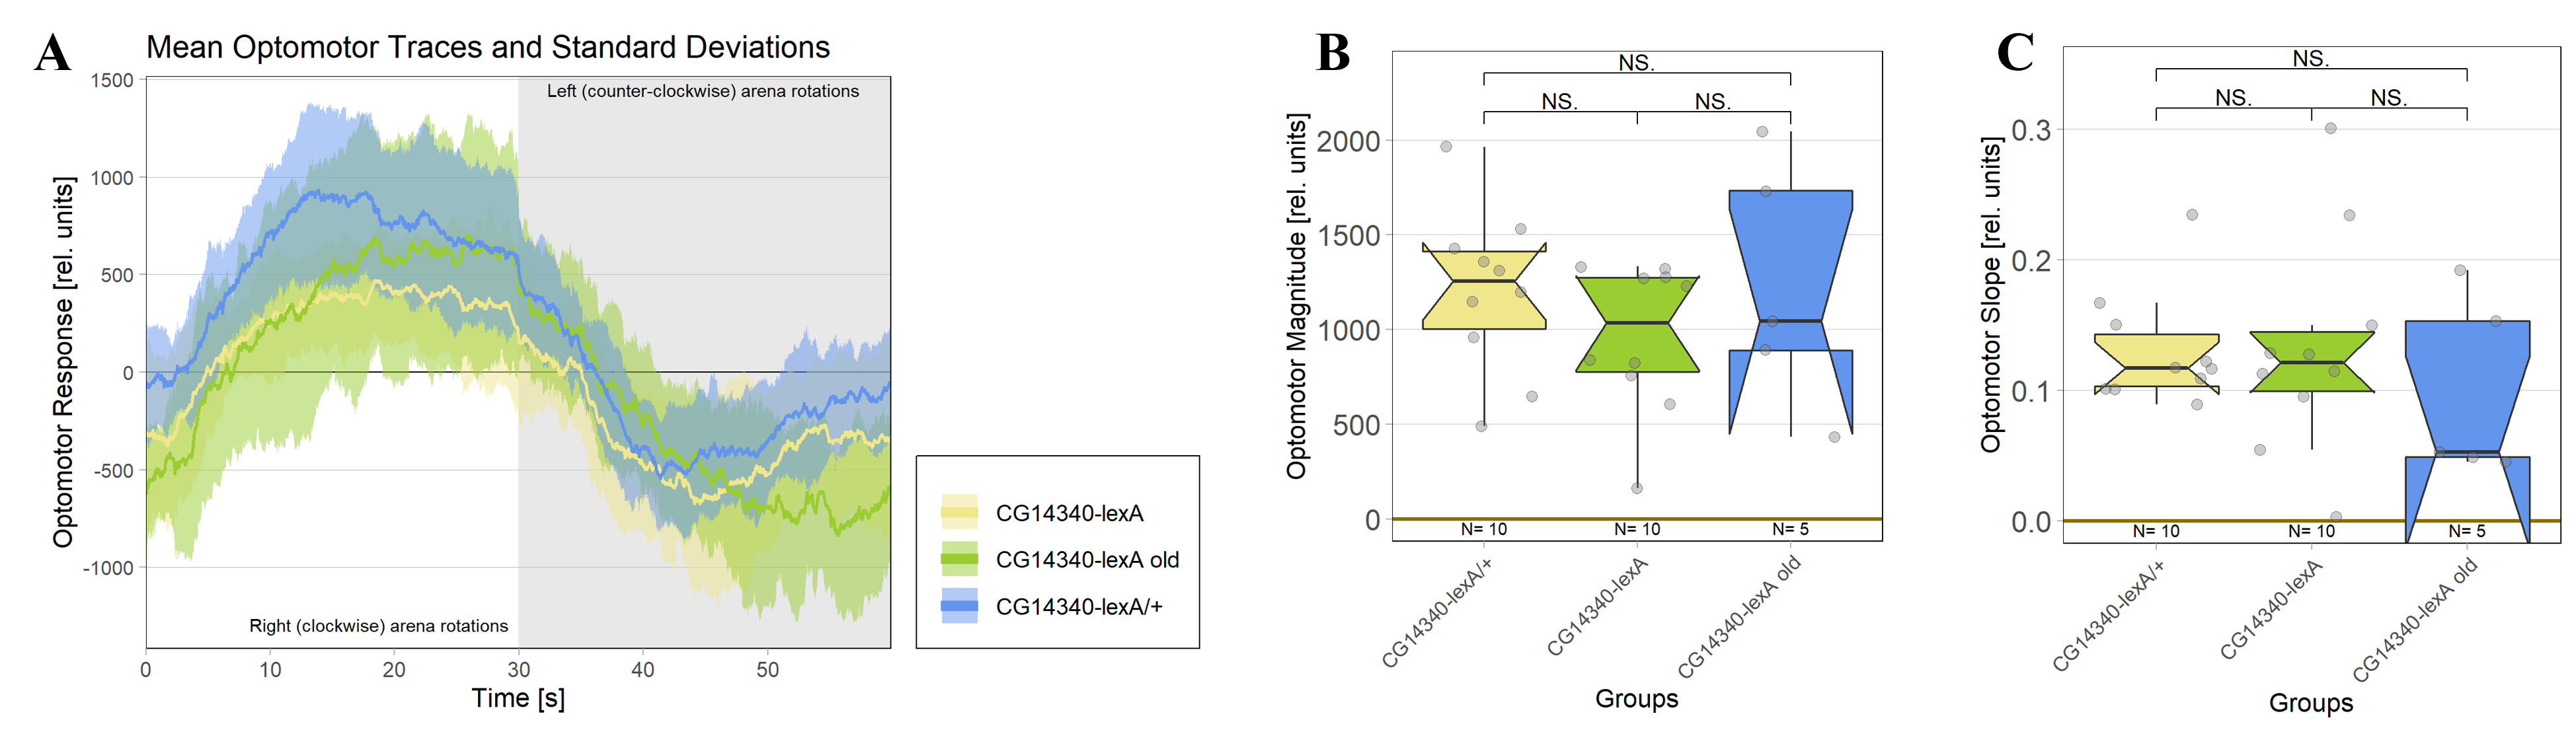
The CG14340-lexA mutant line was produced via CRISPR/Cas9 gene knock-in (Rass, 2021). A heterozygous line served as control (CG14340-lexA/+). Similar to the previous results, 1-3 day old CG14340-lexA mutant flies were able to perform solid optomotor responses, resulting in no significant differences regarding the optomotor magnitude (U-test, p=0,247) and slope (U-test, p=0,971) compared to the heterozygous control flies (Figure 5). Similar results were obtained when using two week old CG14340-lexA flies.
3.3 Silencing T4/T5 neurons did not impair the optomotor response for all effector lines
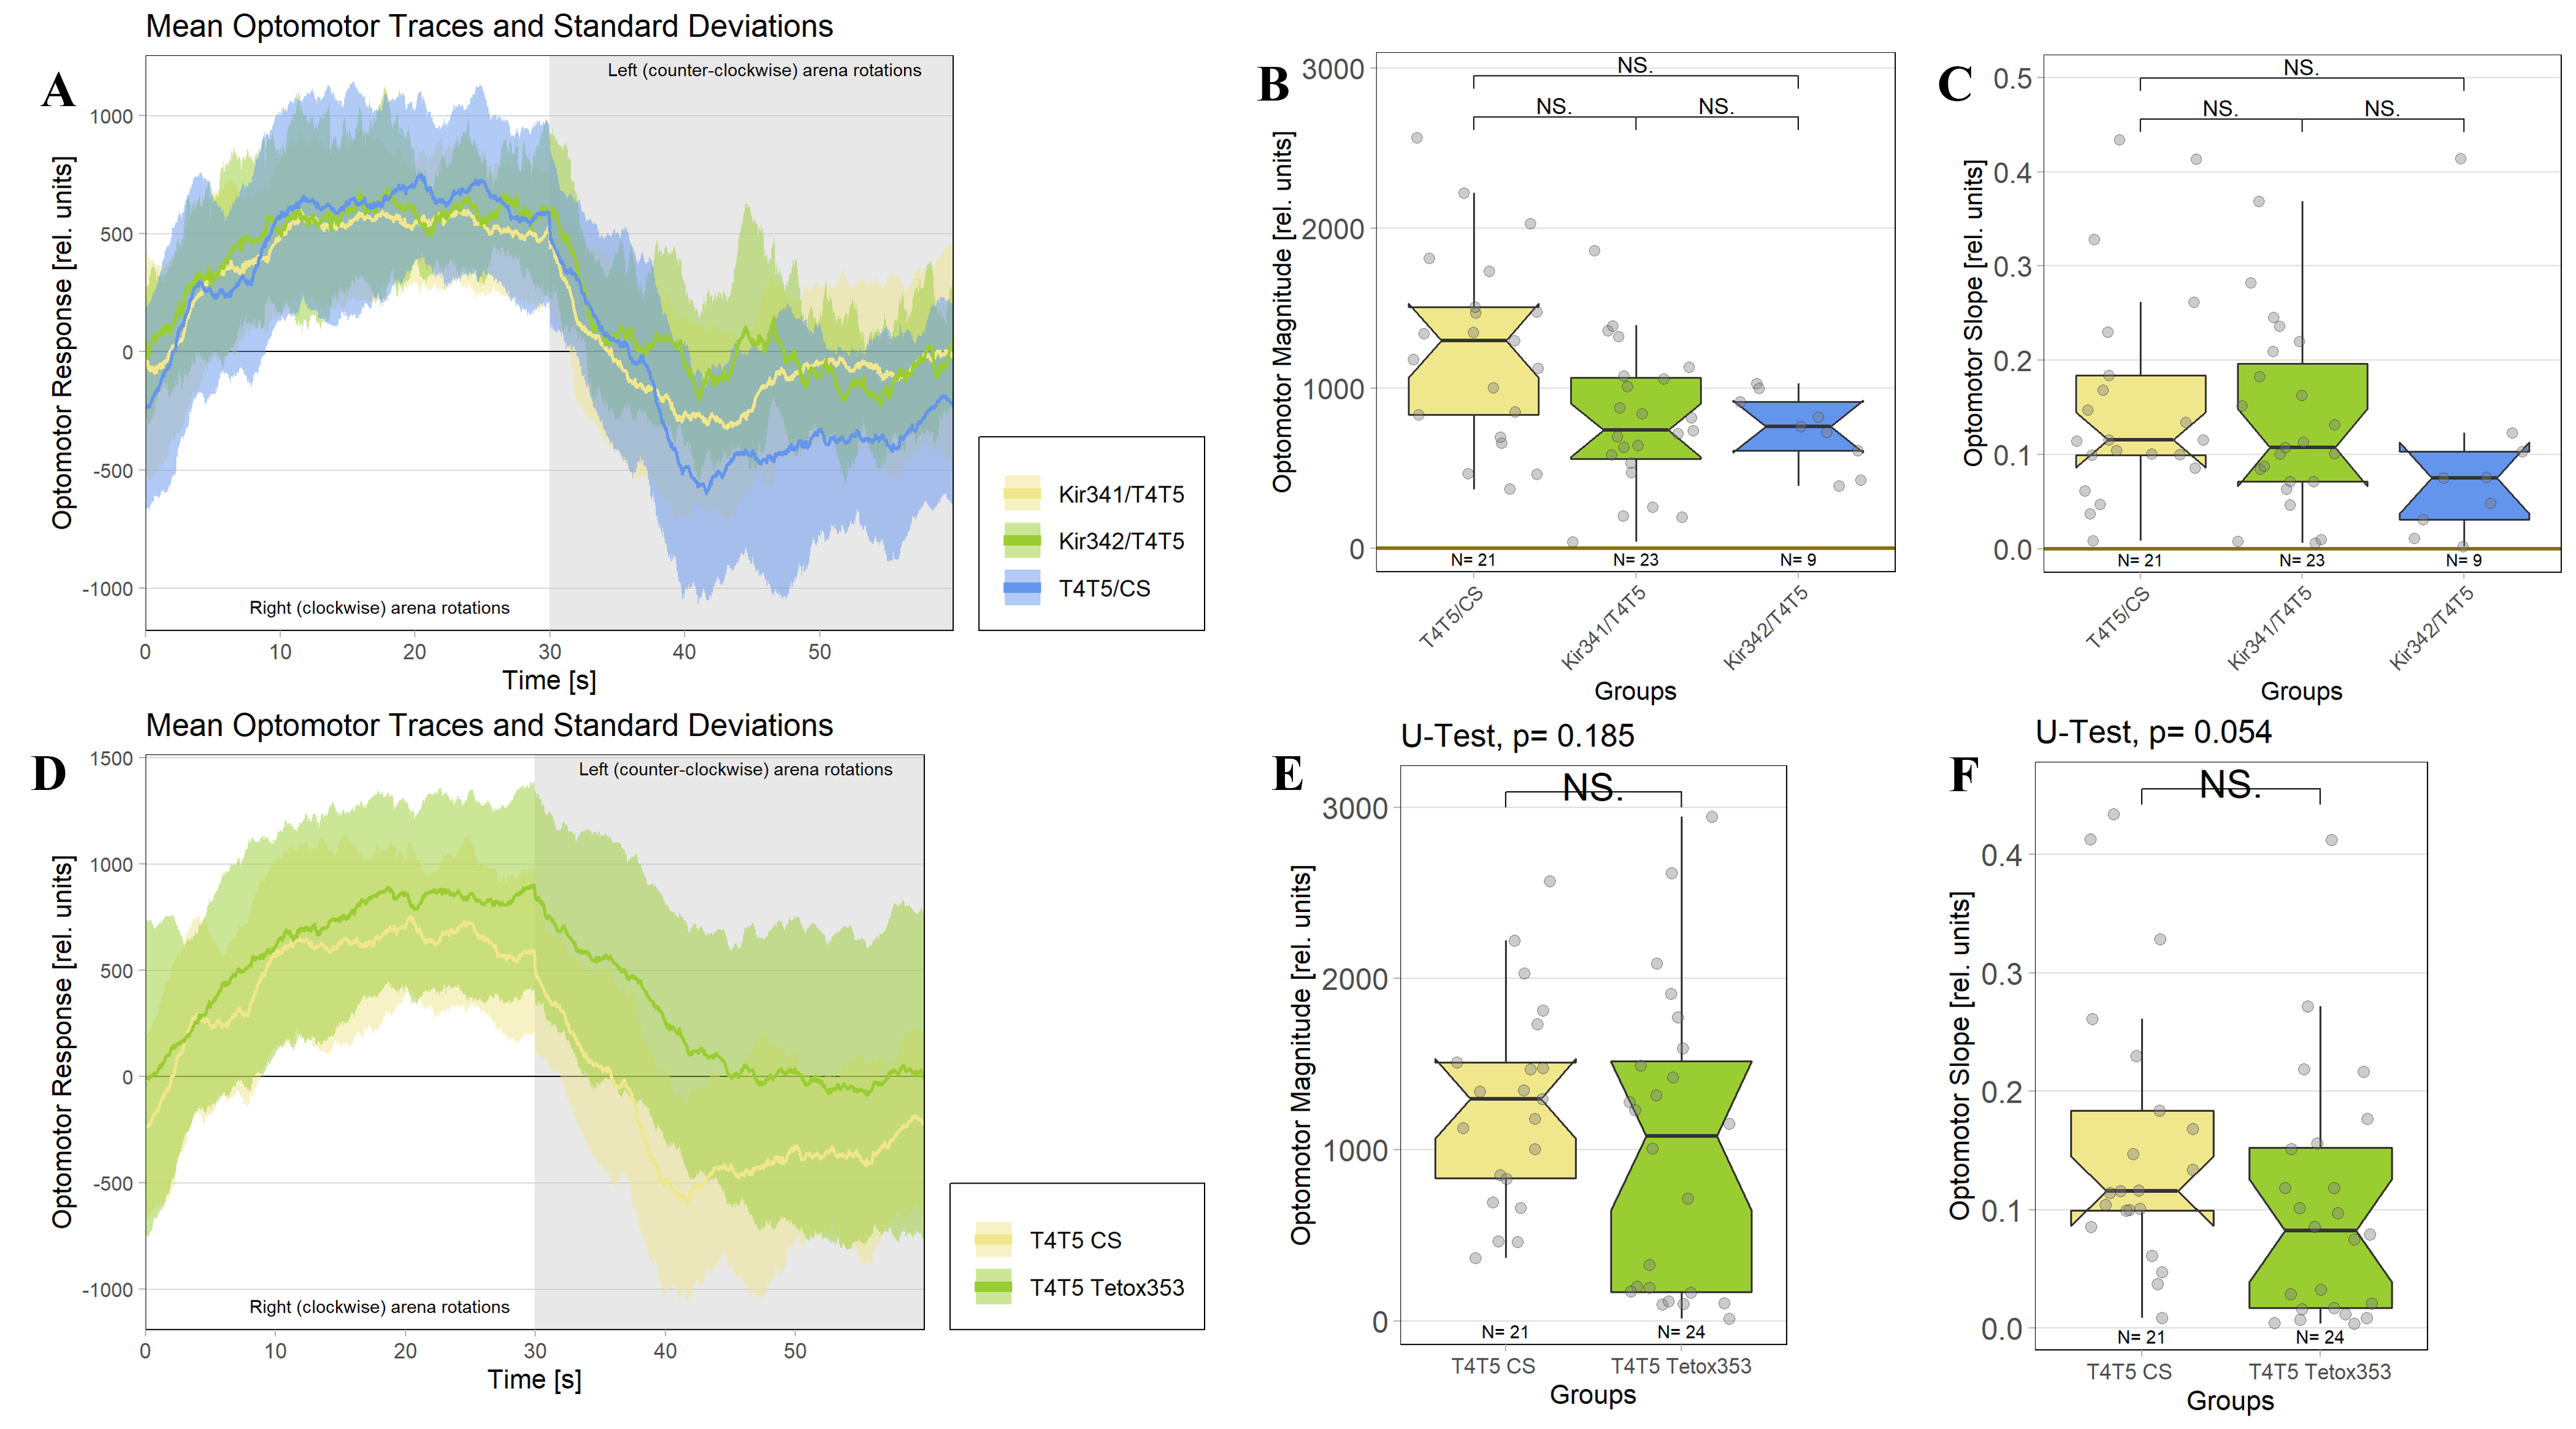
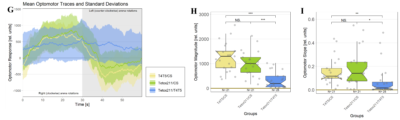
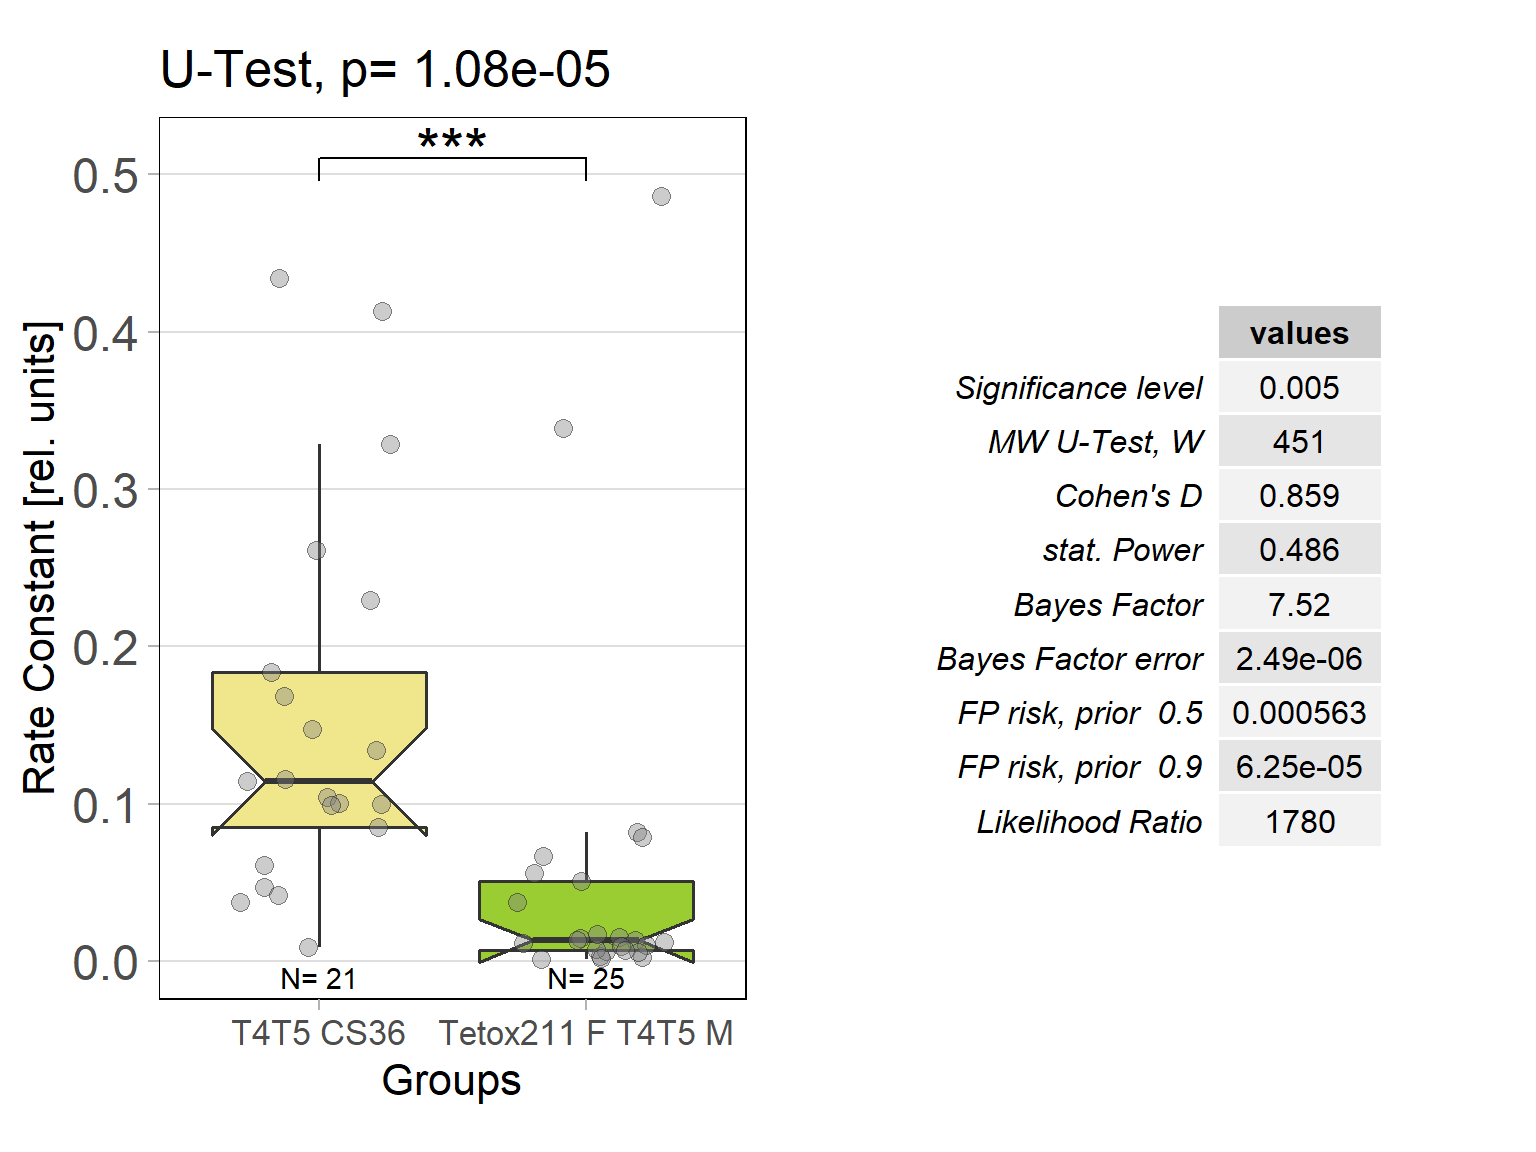
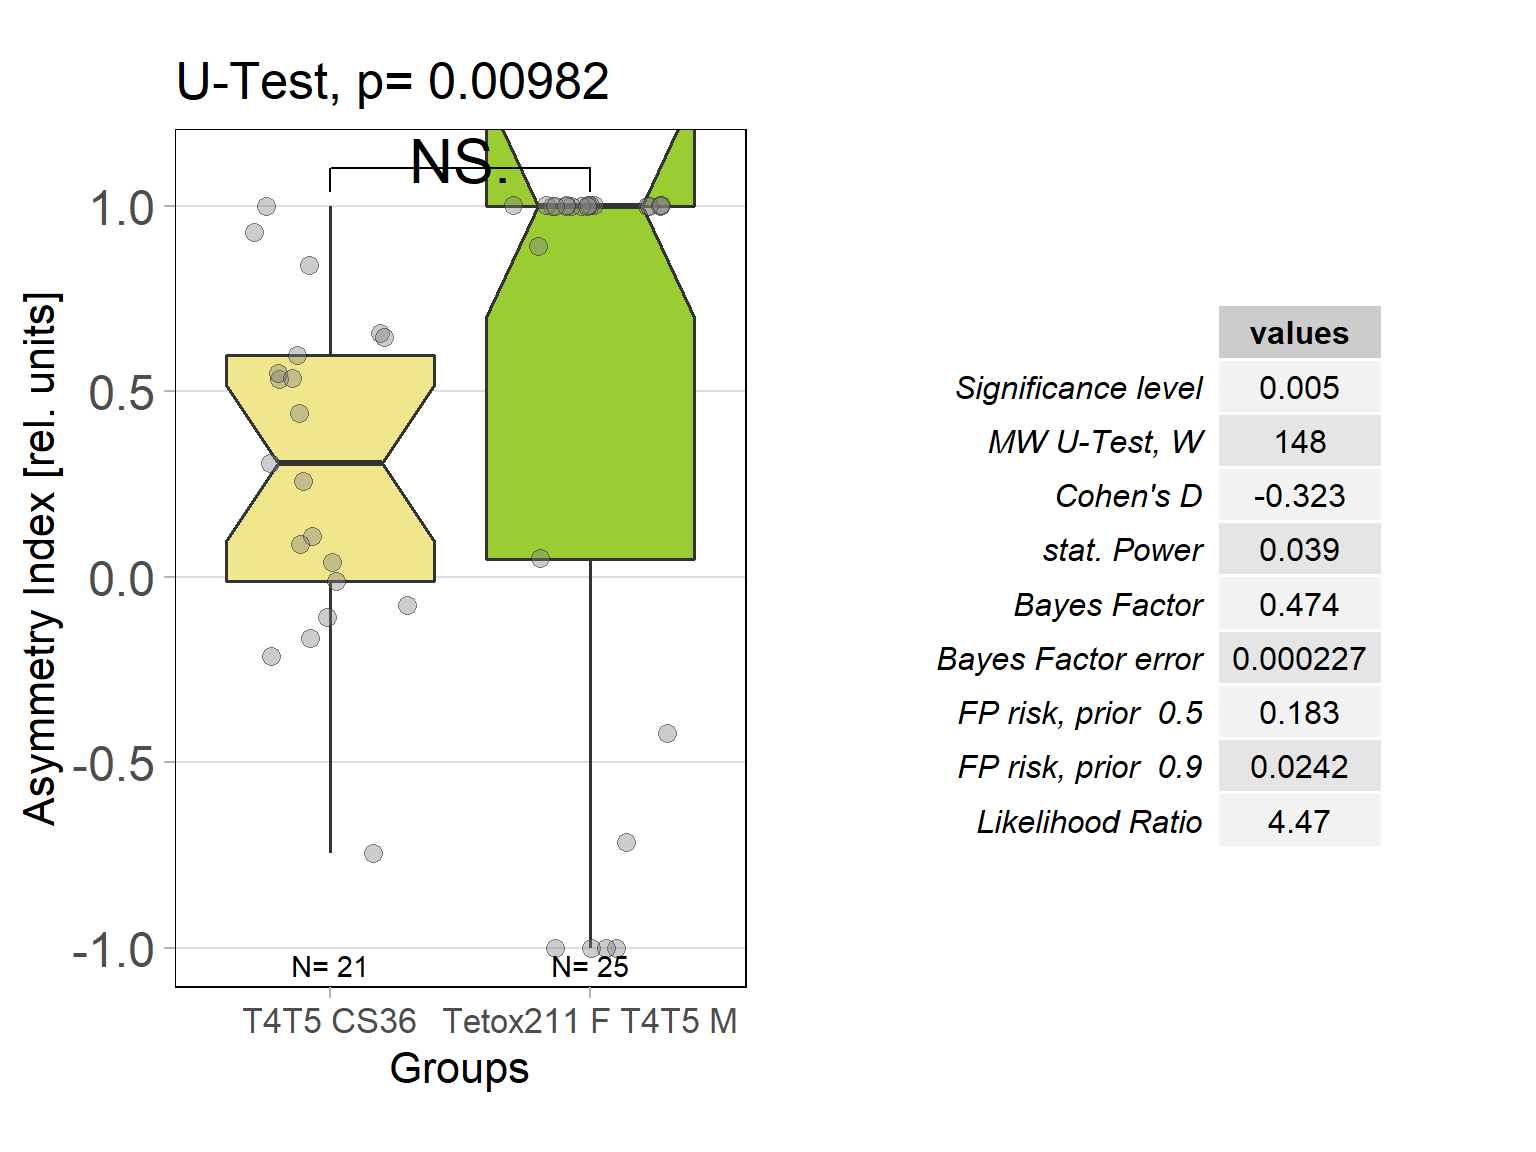
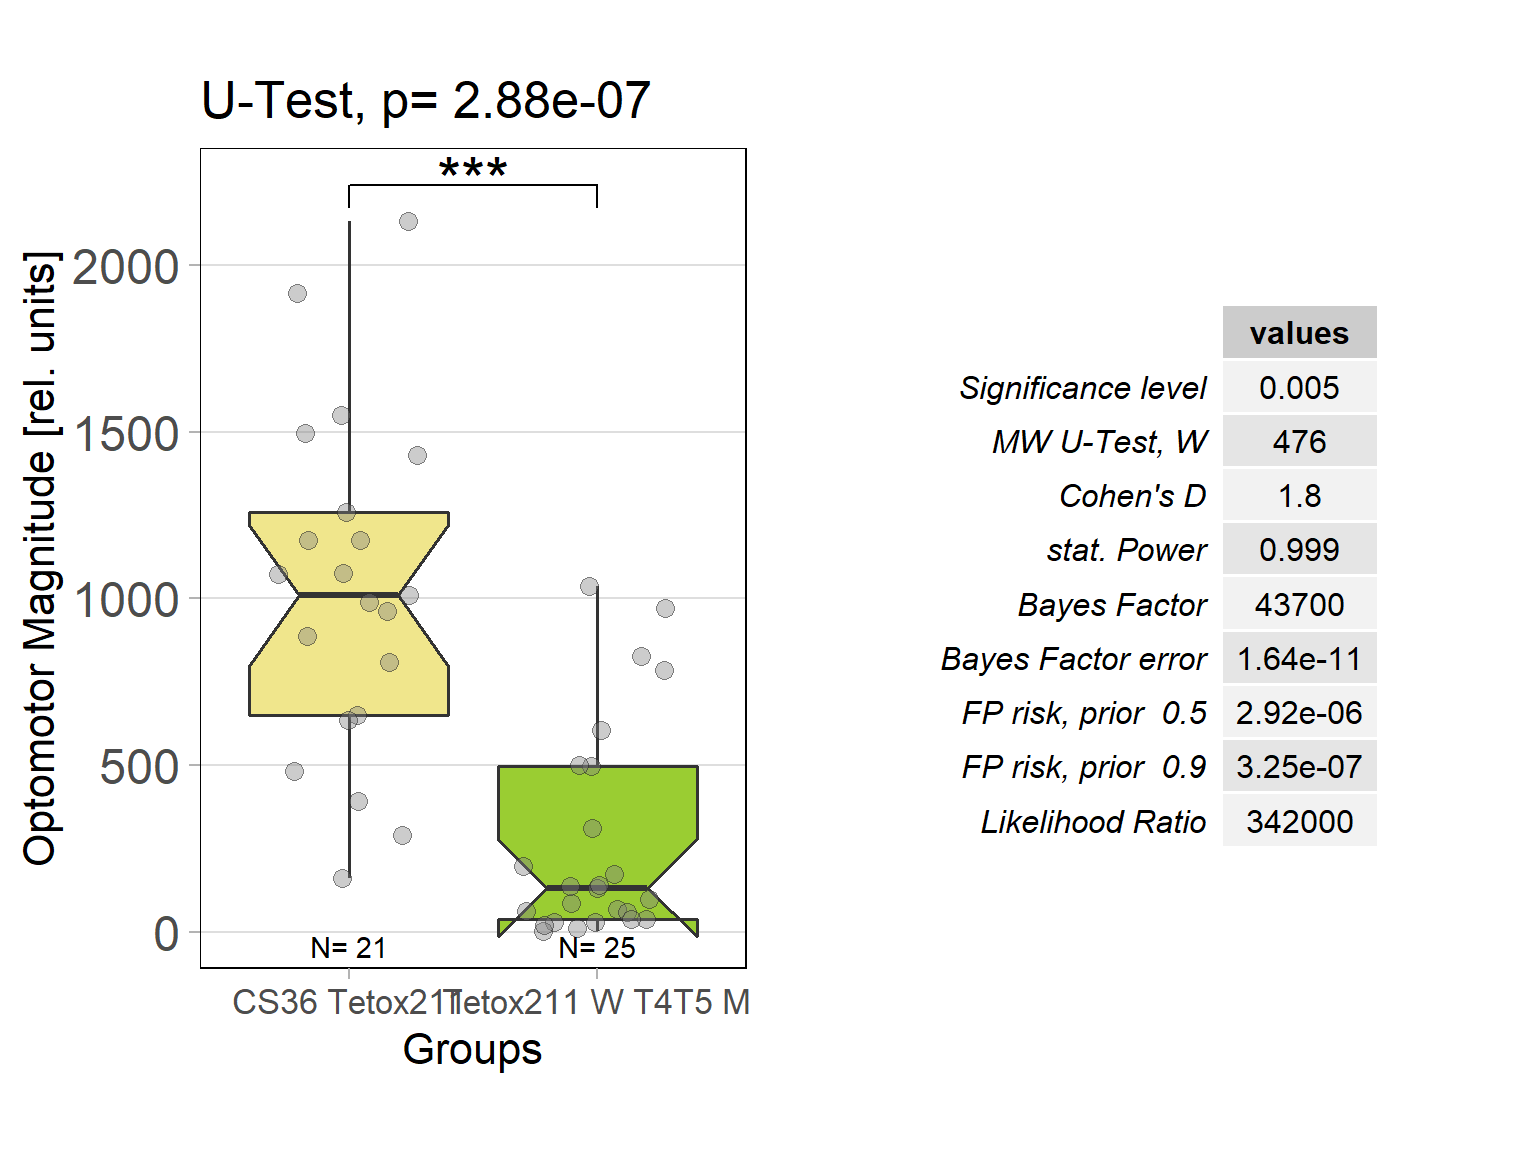
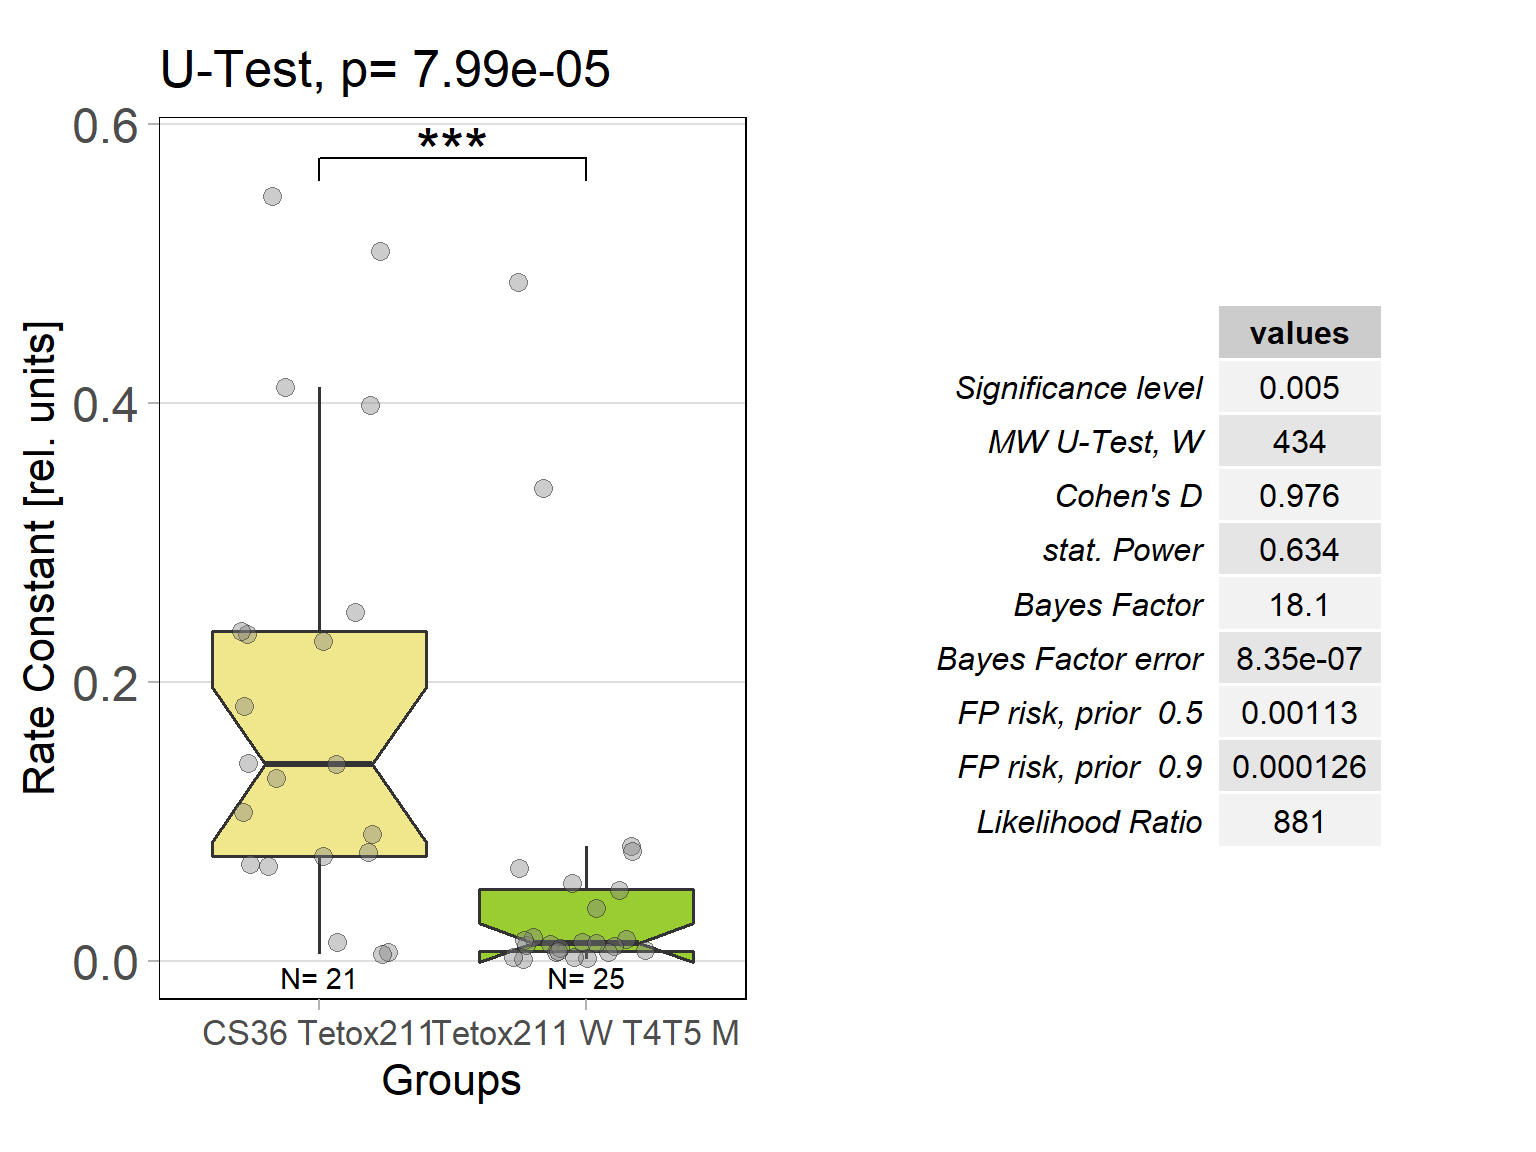
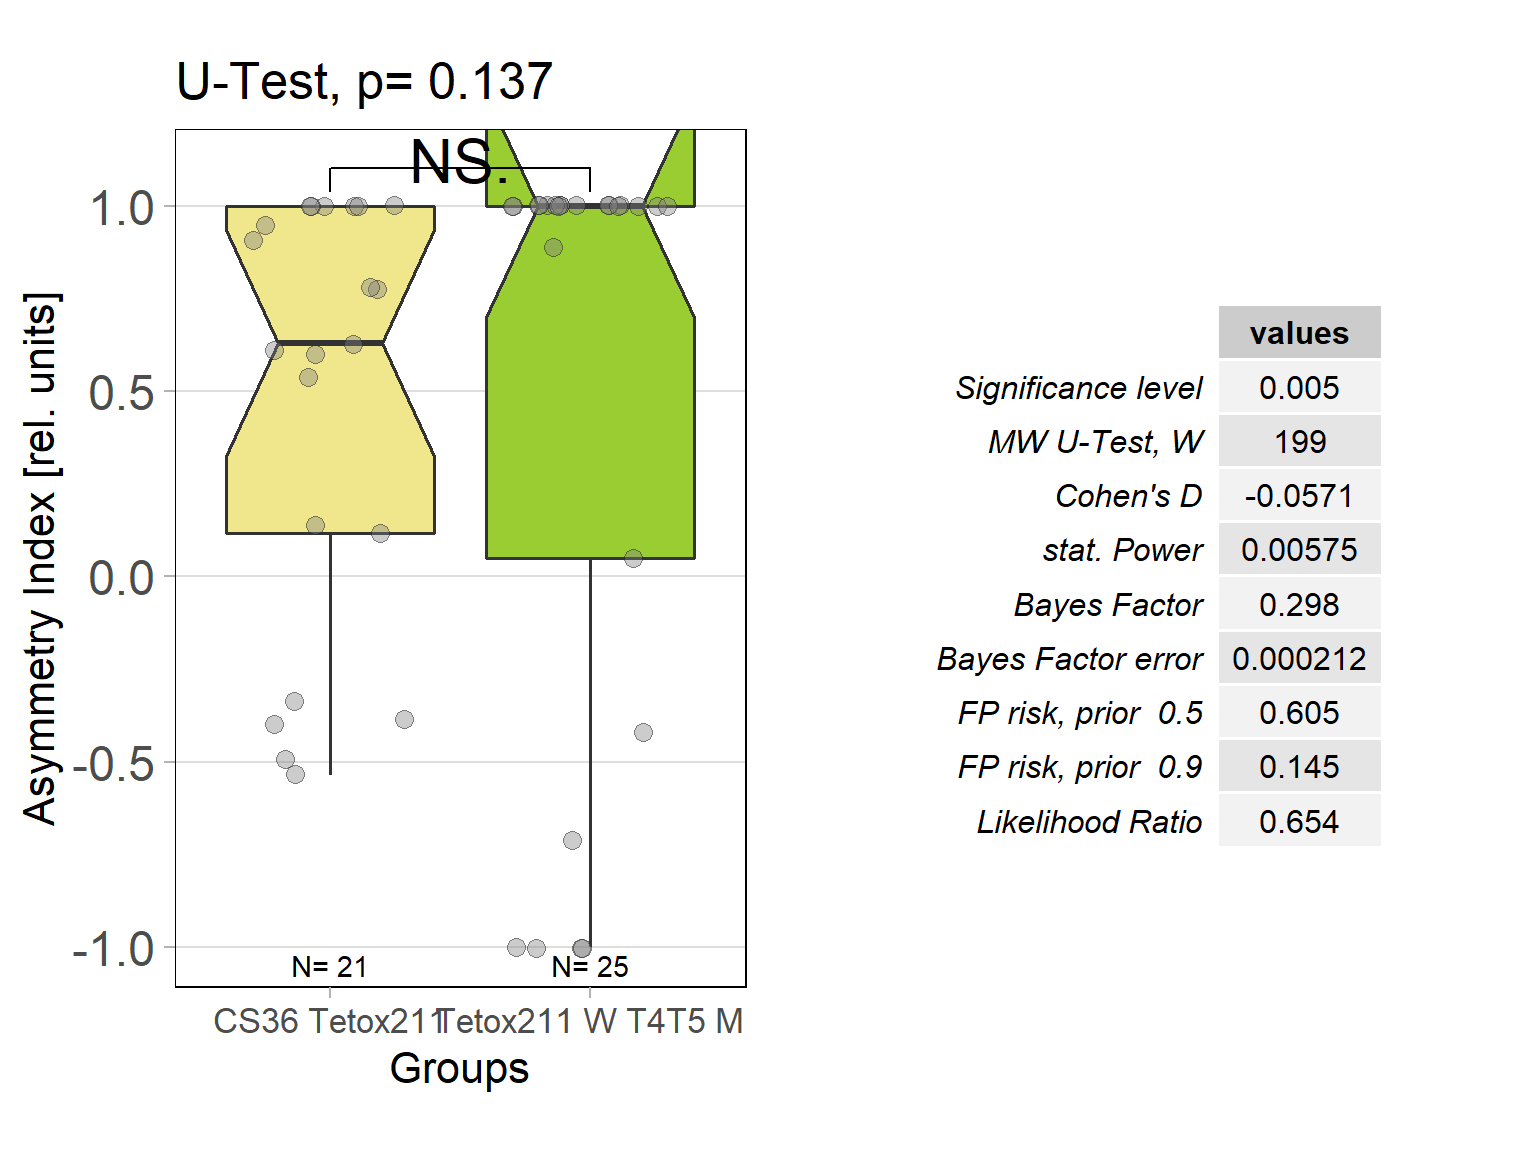
In order to silence T4/T5 neurons, the Gal4 driver line R42F06 was used, leading to selective expression in T4 and T5 cells (Schnell et al., 2012). Interestingly, only one UAS-TeTxLC effector line (TeTx 211)seemed to be able to completely block T4/T5 neurons resulting in a significant lack of optomotor response (Figure 6 G-I). These flies showed significantly lower optomotor magnitudes and significantly slower reactions to the change in direction of rotation (optomotor slopes) compared to the effector control flies (OM: U-test, p < 0,0001; OS: U-test, p < 0,001) as well as to the driver control flies (OM: U-test, p < 0,0001; OS: U-test, p < 0,005). Blocking via Kir 2.1 did not seem to impair the optomotor response (Figure 6 A-C) as there was no significant reduction in optomotor responses or slopes compared to the effector control flies. Furthermore, the optomotor magnitudes and slopes of T4T5-Gal4/UAS-Tetox353 flies were not significantly lower compared to the driver control flies (OM: U-test, p= 0,185; OS: U-test, p about < 0,054). However, looking at the individual data points revealed, that the optomotor magnitudes and slopes of T4T5-Gal4/UAS-Tetox353 flies appeared to be strongly reduced for about half of these flies, suggesting that T4/T5 neurons might have been blocked by only some of these flies (Figure 6 E and F).
To test whether the effectors used would in principle be able to block neurons, all effector fly lines were crossed with nsyb-Gal4 flies. These crossings turned out to be lethal for all effector lines. Interestingly, Kir342/nsyb flies died only in the approximately second larval stage.
3.4 Expression pattern of the R42F06-Gal4 line
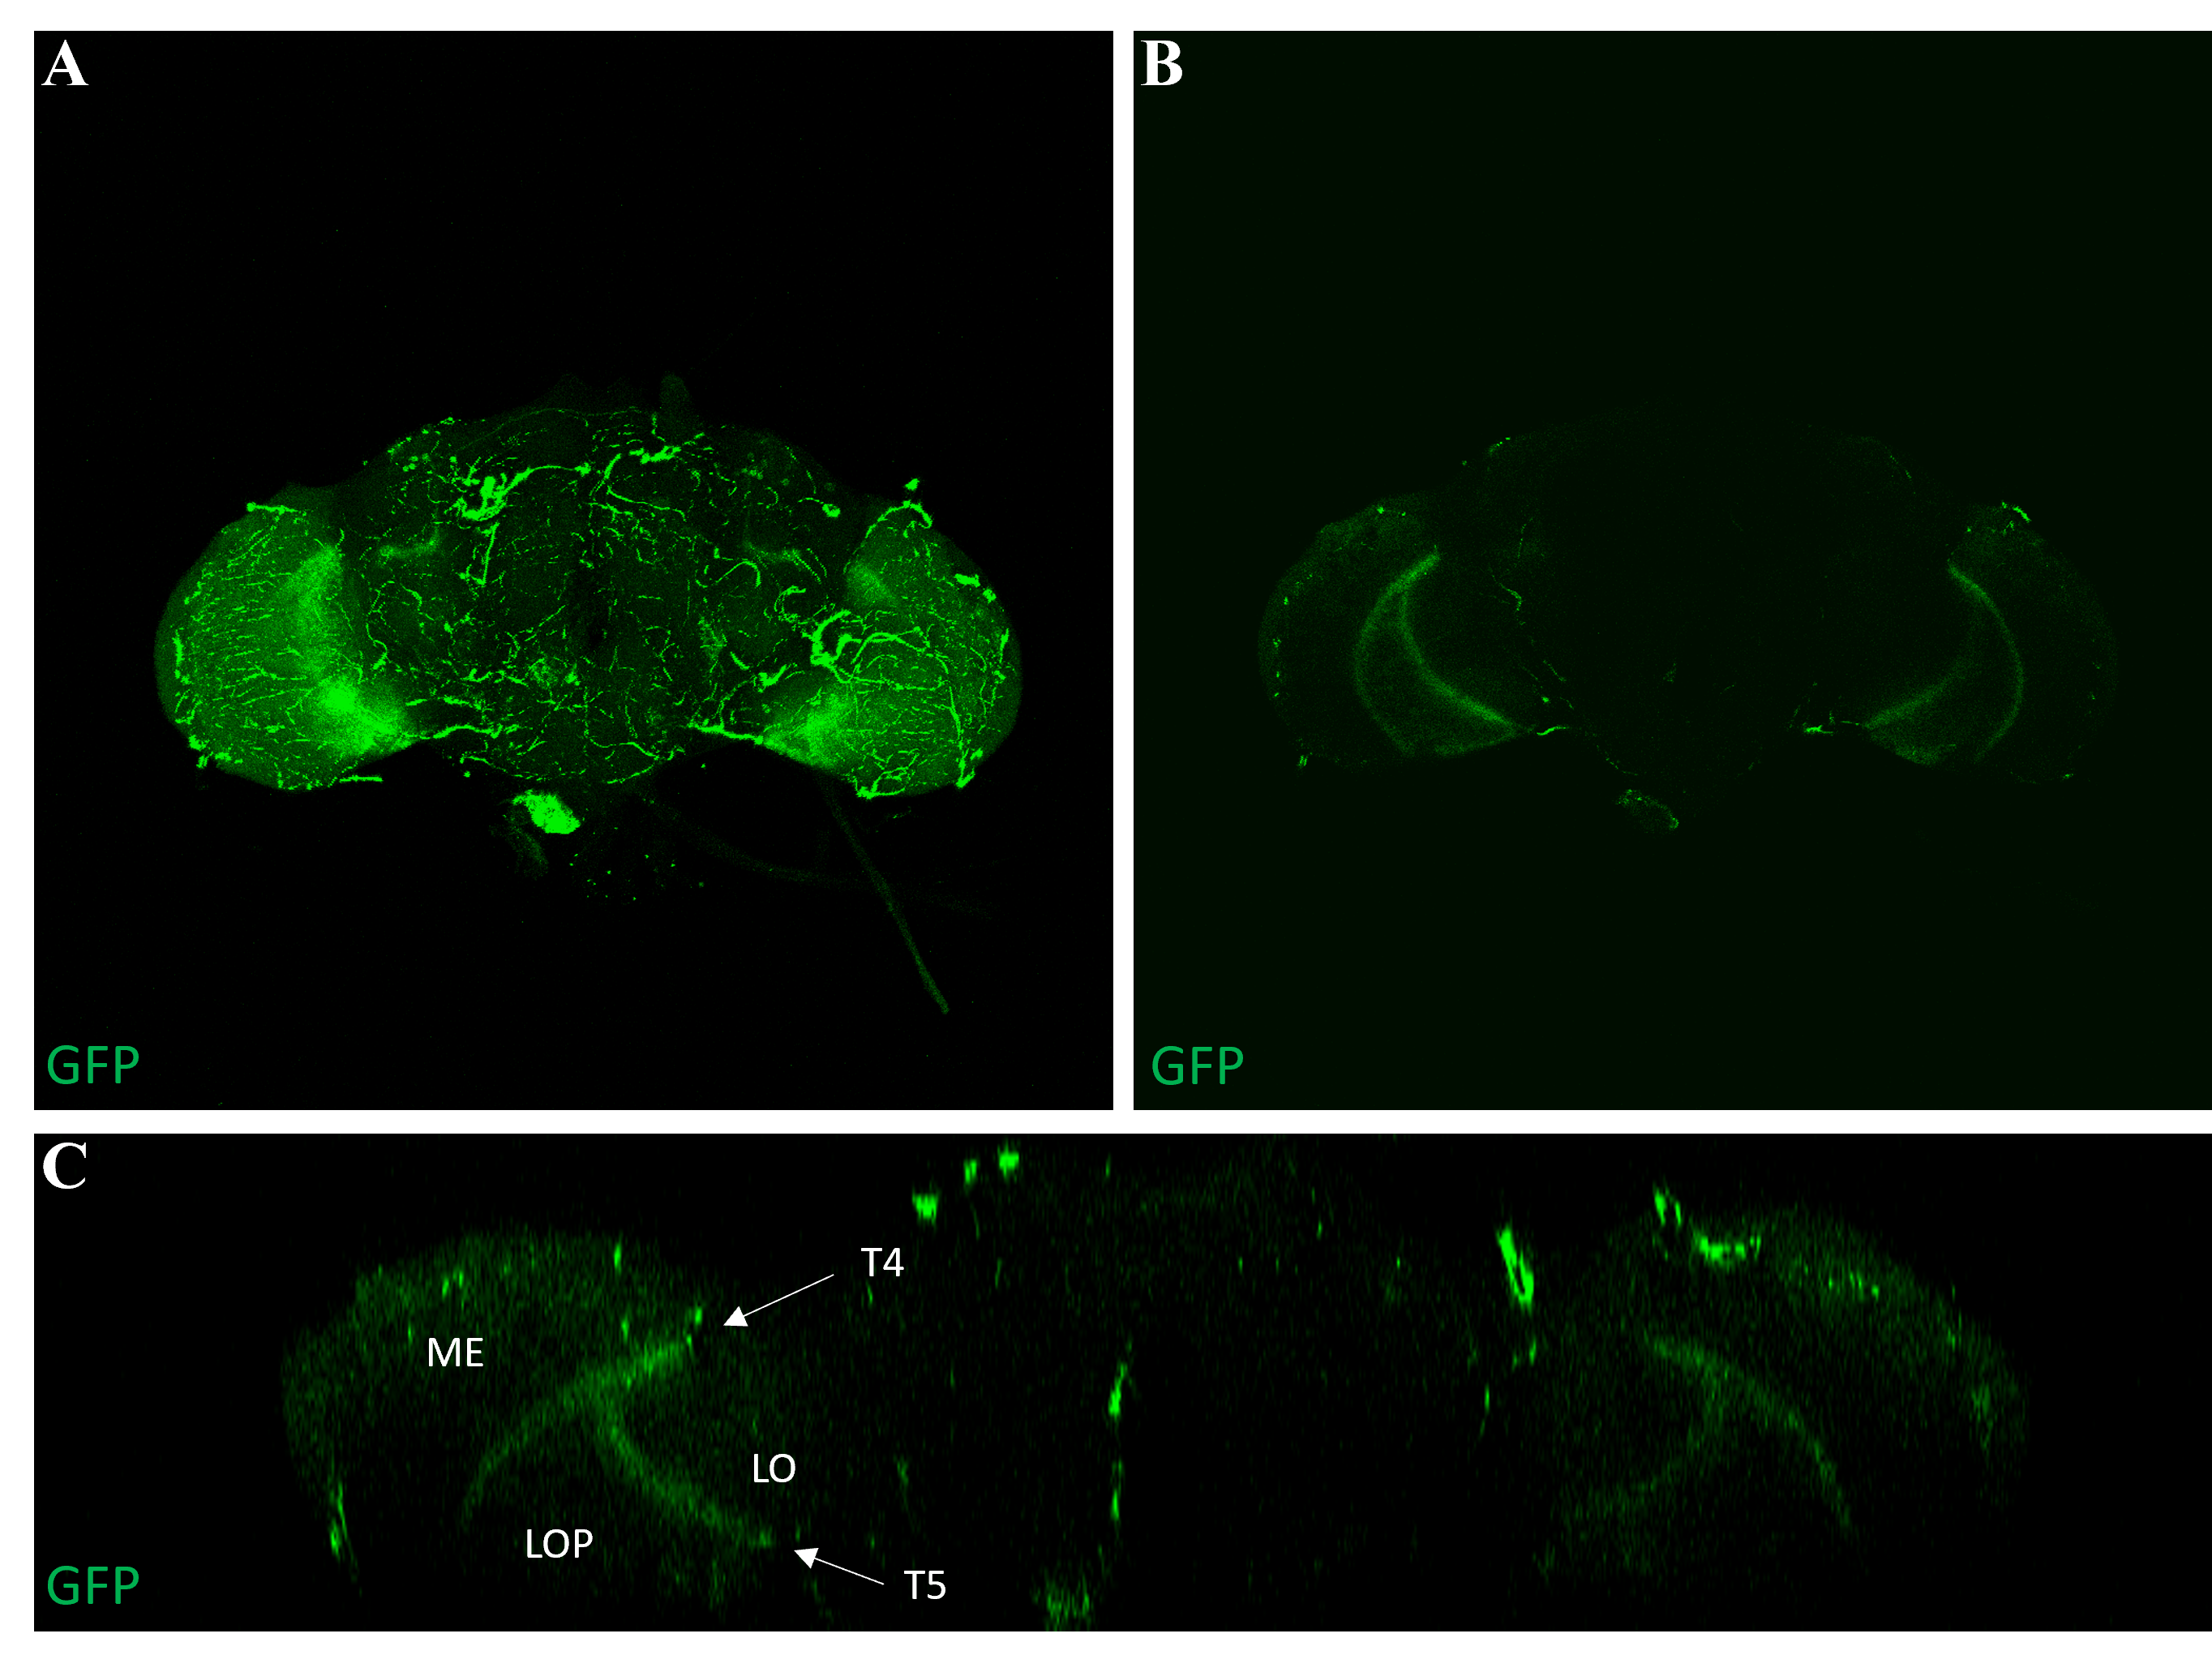
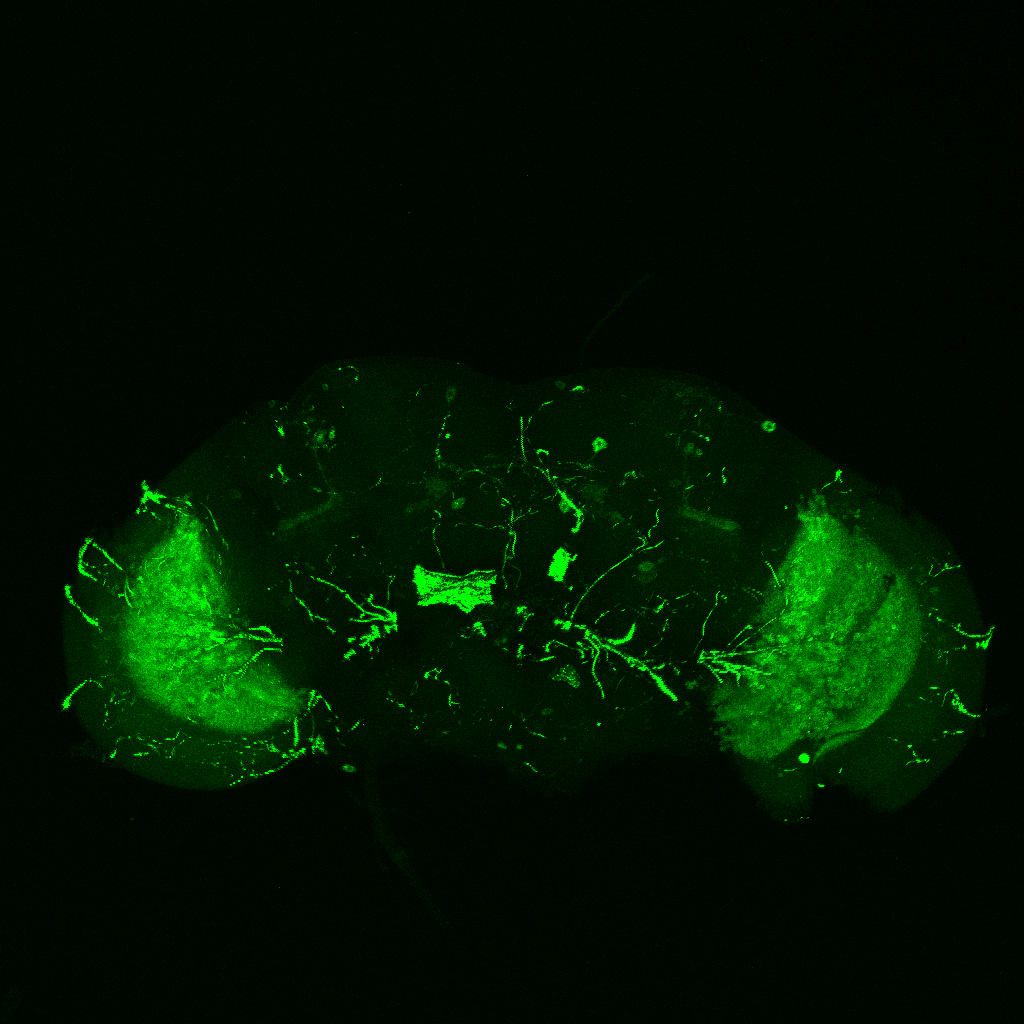
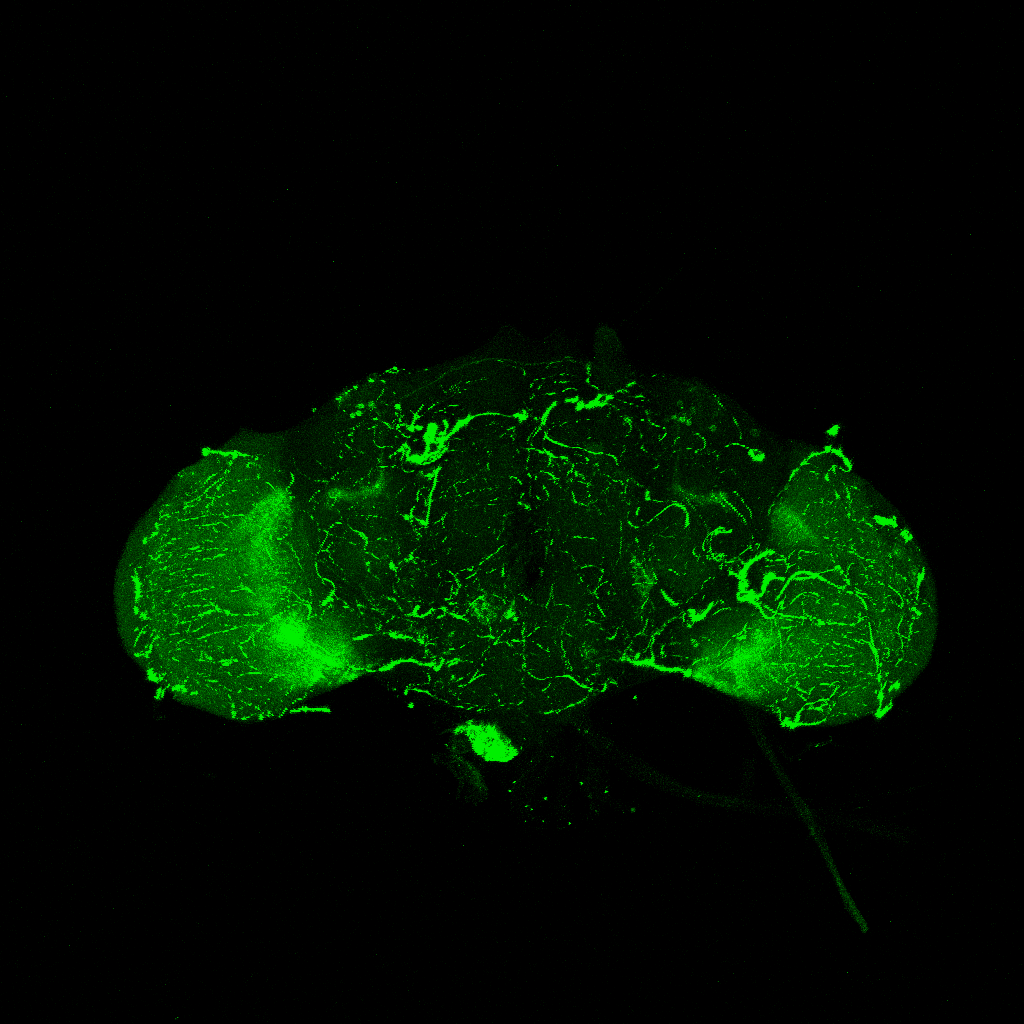
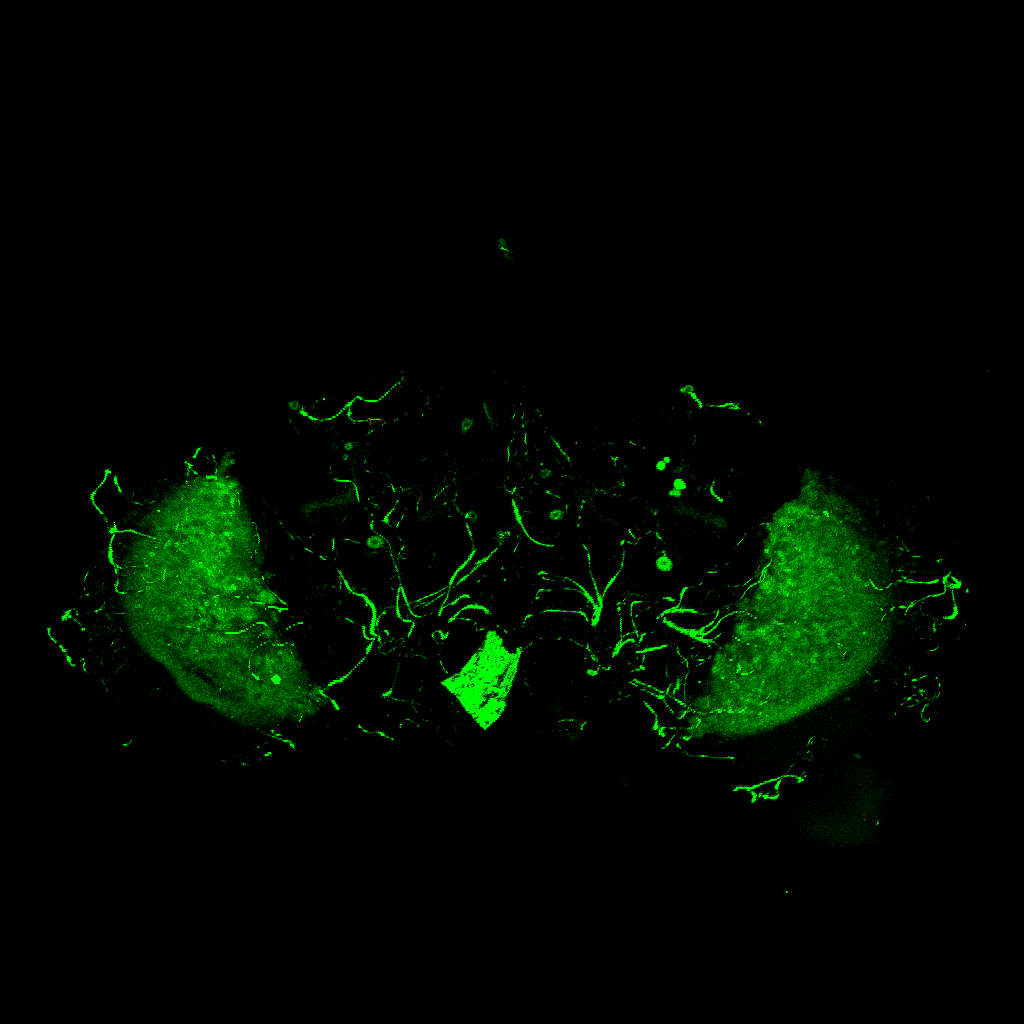
To ensure that the R42F06-Gal4 driver line selectively expresses in T4/T5 neurons, the brains of adult R42F06-Gal4/UAS-CD8::GFP flies were examined. All dissected brains revealed GFP expression in the T4 and T5 neurons of the optic lobes (Figure 6).
4 Discussion
In all of the experiments that were carried out there was a small positive shift of the optomotor traces, which was also detected by the asymmetry indices of the optomotor magnitudes. This shift could be explained by various factors. First, given the fact that the horizontal plane of the tin strip where the flies were positioned might not be totally smooth or flat, the flies could have been able to push the platform to one side more easily. An alternative explanation could be a systematic error when gluing the flies or positioning them on the platform.
Looking at the results, silencing drgx or knocking down CG14340 does not seem to impair the optomotor response (Figure 4 and 5). However, as there was a small reduction in optomotor magnitudes of flies expressing drgx-Rnai from late L3 larval stage onwards, further studies would be needed to reveal whether this effect was actually caused by silencing the drgx expression. One possibility to detect smaller differences in optomotor responses would be to increase the width of the black stripes making it harder for the flies to follow the rotation of the patterning.
Furthermore, using two different fly lines to hyperpolarise T4/T5 neurons with the inward rectifier K+ channelKir 2.1 (Johns et al., 1999) did not impair the optomotor response (Figure 6 A-C). On the other hand, using one of the UAS-TeTxLC effector lines (211) to block T4/T5 neurons via tetanus toxin was sufficient to completely abolish the optomotor responses (Figure 6 G-I). In contrast to Kir 2.1, tetanus toxin cleaves the synaptic vesicle protein synaptobrevin, resulting in a loss of neurotransmitter exocytosis (Sweeney et al., 1995). Interestingly, blocking with the other UAS-TeTxLC effector line (353) resulted in strongly reduced optomotor magnitudes and slopes of about half of these flies, indicating that T4/T5 neurons were only blocked in some of these flies (Figure 6 D-F). A third UAS-TeTxLC line (351) could not be tested, as the crossings with R42F06-Gal4 turned out to be lethal.
Schnell, et al., which had previously shown that blocking T4/T5 neurons resulted in a lack of motion responses, used a effector line, carrying UAS-Kir2.1-EGFP on the second and tub-Gal80ts on the third chromosome. These flies were raised at 25 °C and shifted to 31°C, 2–5 days prior to hatching to inactivate Gal80ts. As a second effector strain they used a fly line, carrying UAS-shits on the third chromosome. Shipirets is a temperature-sensitive mutation of a dynamin orthologue gene which blocks synaptic transmission by inhibiting vesicle endocytosis (Schnell et al., 2012). Given the fact, that although both the effector lines, whose crossings with nsyb-Gal4 were lethal, as well as the R42F06-Gal4 driver line, which indeed selectively expressed in T4/T5 neurons, appeared to work in principle, it seems as if some of these neurons were somehow able to compensate the blocking. Consequently, further investigations would be needed to explain the observed selectivity regarding these effector lines in order to reveal whether, for example, tub-Gal80ts would be needed to reproduce the previous accomplished block of T4/T5 neurons via Kir 2.1(Schnell et al., 2012). Furthermore, it would be interesting to see, whether a similar selectivity could be observed when using different UAS-shitsstrains as effector lines.
References
Bahl, A., Ammer, G., Schilling, T., Borst, A. (2013). Object tracking in motion-blind flies. Nat Neurosci (16), 730–738.
Brembs’ lab. Fly stocks. Available online at: https://docs.google.com/spreadsheets/d/15WfkzU16bEWGYeXvf1Ge-EIime0AF_T52Uh-nWzrNM0/edit#gid=0 [accessed Jul 09, 2021].
Budick, S., Reiser, M., Dickinson, M. (2007). The role of visual and mechanosensory cues in structuring forward flight in Drosophila melanogaster. J Exp Biol (210), 4092–4103.
Götz, K. (1968). Flight control in Drosophila by visual perception of motion. Kybernetik (4), 199–208.
Joesch, M., Schnell, B., Raghu, S., Reiff, D., Borst, A. (2010). ON and OFF pathways in Drosophila motion vision. Nature (468), 300–304.
Johns, D., Marx, R., Mains, R., O’Rourke, B., Marban, E. (1999). Inducible genetic suppression of neuronal excitability. J Neurosci (19), 1691–1697.
Linde, Maximilian von der (2018). Establishing an optomotor experiment for Drosophila. Available online at: https://lab.brembs.net/wp/wp-content/uploads/theses/Max_vdLinde_Bachelor.pdf [accessed Jul 05, 2021].
Maisak, M., Haag, J., Ammer, G., Serbe, E., Meier, M., Leonhardt A et al. (2013). A directional tuning map of Drosophila elementary motion detectors. Nature (500), 212–216.
Rass, Mathias (April, 2021). Personal communication.
Schilling, T., Ali, A., Leonhardt, A., Borst, A., Pujol-Martí, J. (2019). Transcriptional control of morphological properties of direction-selective T4/T5 neurons in Drosophila. Development (146), 199–208.
Schnell, B., Raghu, S., Nern, A., Borst, A. (2012). Columnar cells necessary for motion responses of wide-field visual interneurons in Drosophila. J Comp Physiol A Neuroethol Sens Neural Behav Physiol (198), 389–395.
Sherman, A., Dickinson, M. (2004). Summation of visual and mechanosensory feedback in Drosophila flight control. J Exp Biol (207), 133–142.
Shinomiya, K., Karuppudurai, T., Lin, T., Lu, Z., Lee, C., Meinertzhagen, I. (2014). Candidate neural substrates for off-edge motion detection in Drosophila. Curr Biol (24), 1062–1070.
Sweeney, S., Broadie, K., Keane, J., Niemann, H., O’Kane, C. (1995). Targeted expression of tetanus toxin light chain in Drosophila specifically eliminates synaptic transmission and causes behavioral defects. Neuron (14), 341–351.
Category: Optomotor response, Uncategorized | No Comments
GFP expression pattern of R42F06(T4T5)-Gal4 flies
on Monday, July 12th, 2021 1:47 | by Simon Benmaamar
Category: Optomotor response, Uncategorized | No Comments
Optomotor response of T4T5 Tetox 211 flies
on Sunday, July 4th, 2021 5:54 | by Simon Benmaamar
Driver Control

Effector Control
Category: Optomotor response | No Comments