The Tmaze Experiments : Screen results as on 22-7-18
Yellow 1 (Positive Control): Gr28bd-G4, TrpA1-G4
Parameters: Light: intensity (500 Lux side, 1000 Lux bottom); frequency = 20Hz; Delay = 1 ms; Duration = 9.9 ms; volts = 6.4
The T-Maze experiments : Middle analysis and Correlation plot
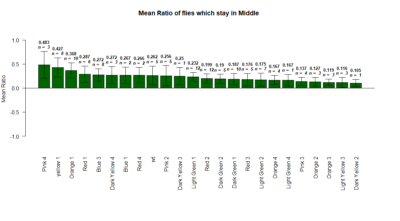
The mean ratio of the flies that stay in the middle during the experiments.
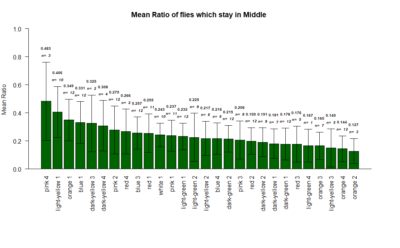
Correlation plot between the mean ratio of the flies that stay in the middle versus the Weighted PIs
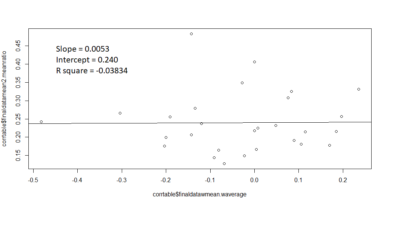
Slope = 0.0053
Intercept = 0.240
R square value = -0.03834
contrary to the expectations, there seems to be no correlation .
Tmaze Exploratory analysis : Middle Flies
plotting the mean ratio of flies which stay in the middle during experiment.
Yellow 1 (Positive Control): Gr28bd-G4, TrpA1-G4
Parameters:
Light: intensity (500 Lux side, 1000 Lux bottom)
frequency = 20Hz
Delay = 1 ms
Duration = 9.9 ms
volts = 6.4
T-Maze experiments : screen results as on 25-06-2018
Yellow 1 (Positive Control): Gr28bd-G4, TrpA1-G4
Parameters:
Light: intensity (500 Lux side, 1000 Lux bottom)
frequency = 20Hz
Delay = 1 ms
Duration = 9.9 ms
volts = 6.4
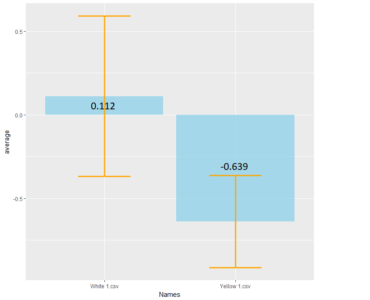
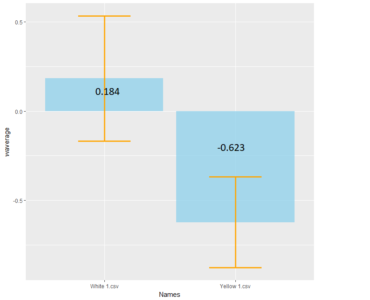
Tmaze experiments : Test for Blindness and Comparison with positive control
Comparison between White 1 ( Control (NorpA- UAS Chrimson)) and Yellow 1 (Positive Control ( Gr28bd-G4, TrpA1-G4).
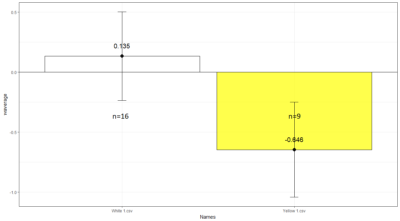
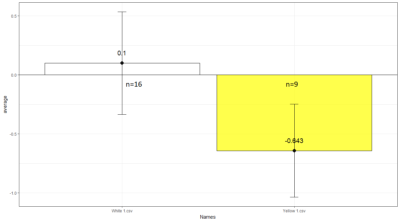
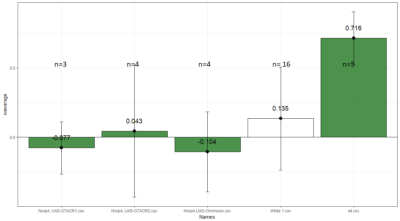
To test whether the flies are really blind, and there is no problem with the NorpA part of the construct, we compare with NorpA,UAS GTACR1 ; NorpA,UAS GTACR2 ; and another stock of NorpA-UAS-Chrimson.
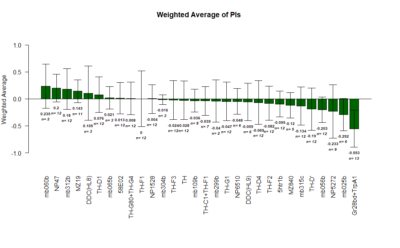
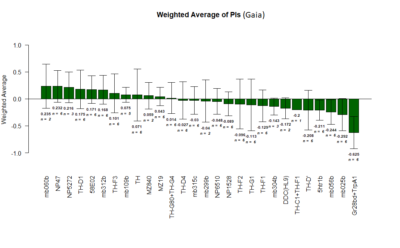
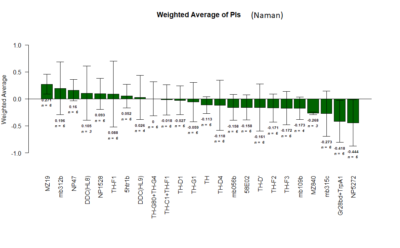
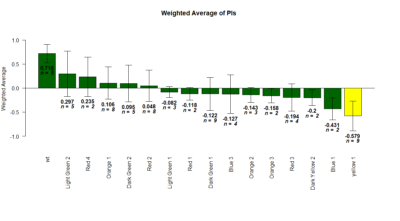
Weighted mean is calculated by multiplying the weights (total number of flies in that experiment/total number of flies in all the experiments) with the PI for that experiment, and taking the sum thereafter for all the experiments.
Tmaze experiments initial results
 the first graph shows Bar plot of Mean and standard deviation of PIs for Genetic control (n=9) and Positive control (n=5).
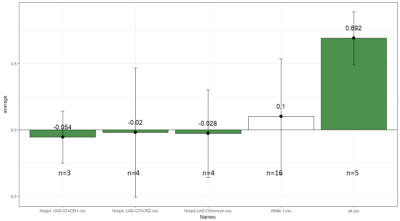
The second graph shows weighted mean and weighted standard deviation of the same.
Weighted mean is calculated by multiplying the weights (total number of flies in that experiment/total number of flies in all the experiments) with the PI for that experiment, and taking the sum thereafter for all the experiments.