Optomotor graph coded
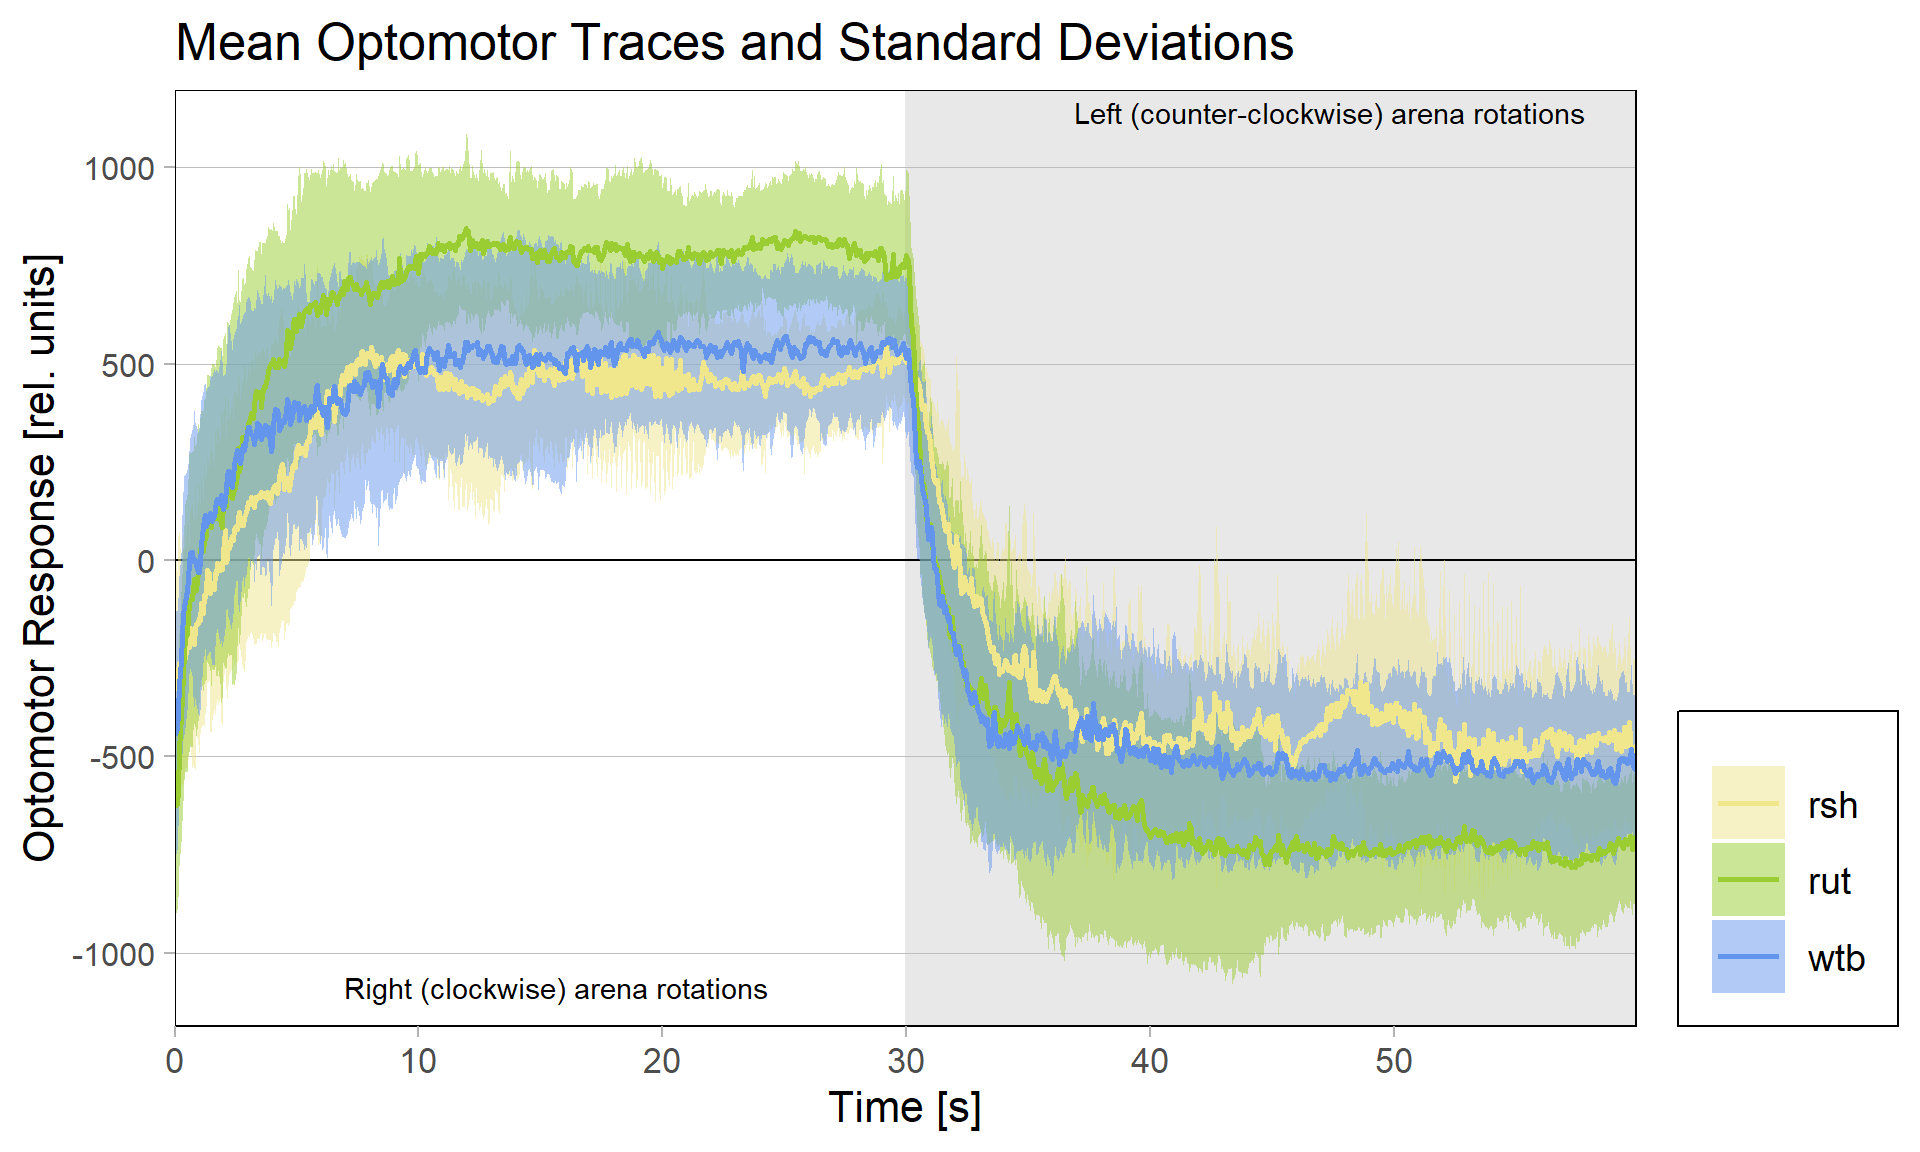
There had been some concerns about the optomotor display in the group evaluation sheets showing right-turning torque on the left side of the graph and vice versa. Also, the use of standard deviations seemed to blur differences between the experimental groups:
Because of these concerns, I have swapped the traces and used standard error of the means instead of standard deviations:
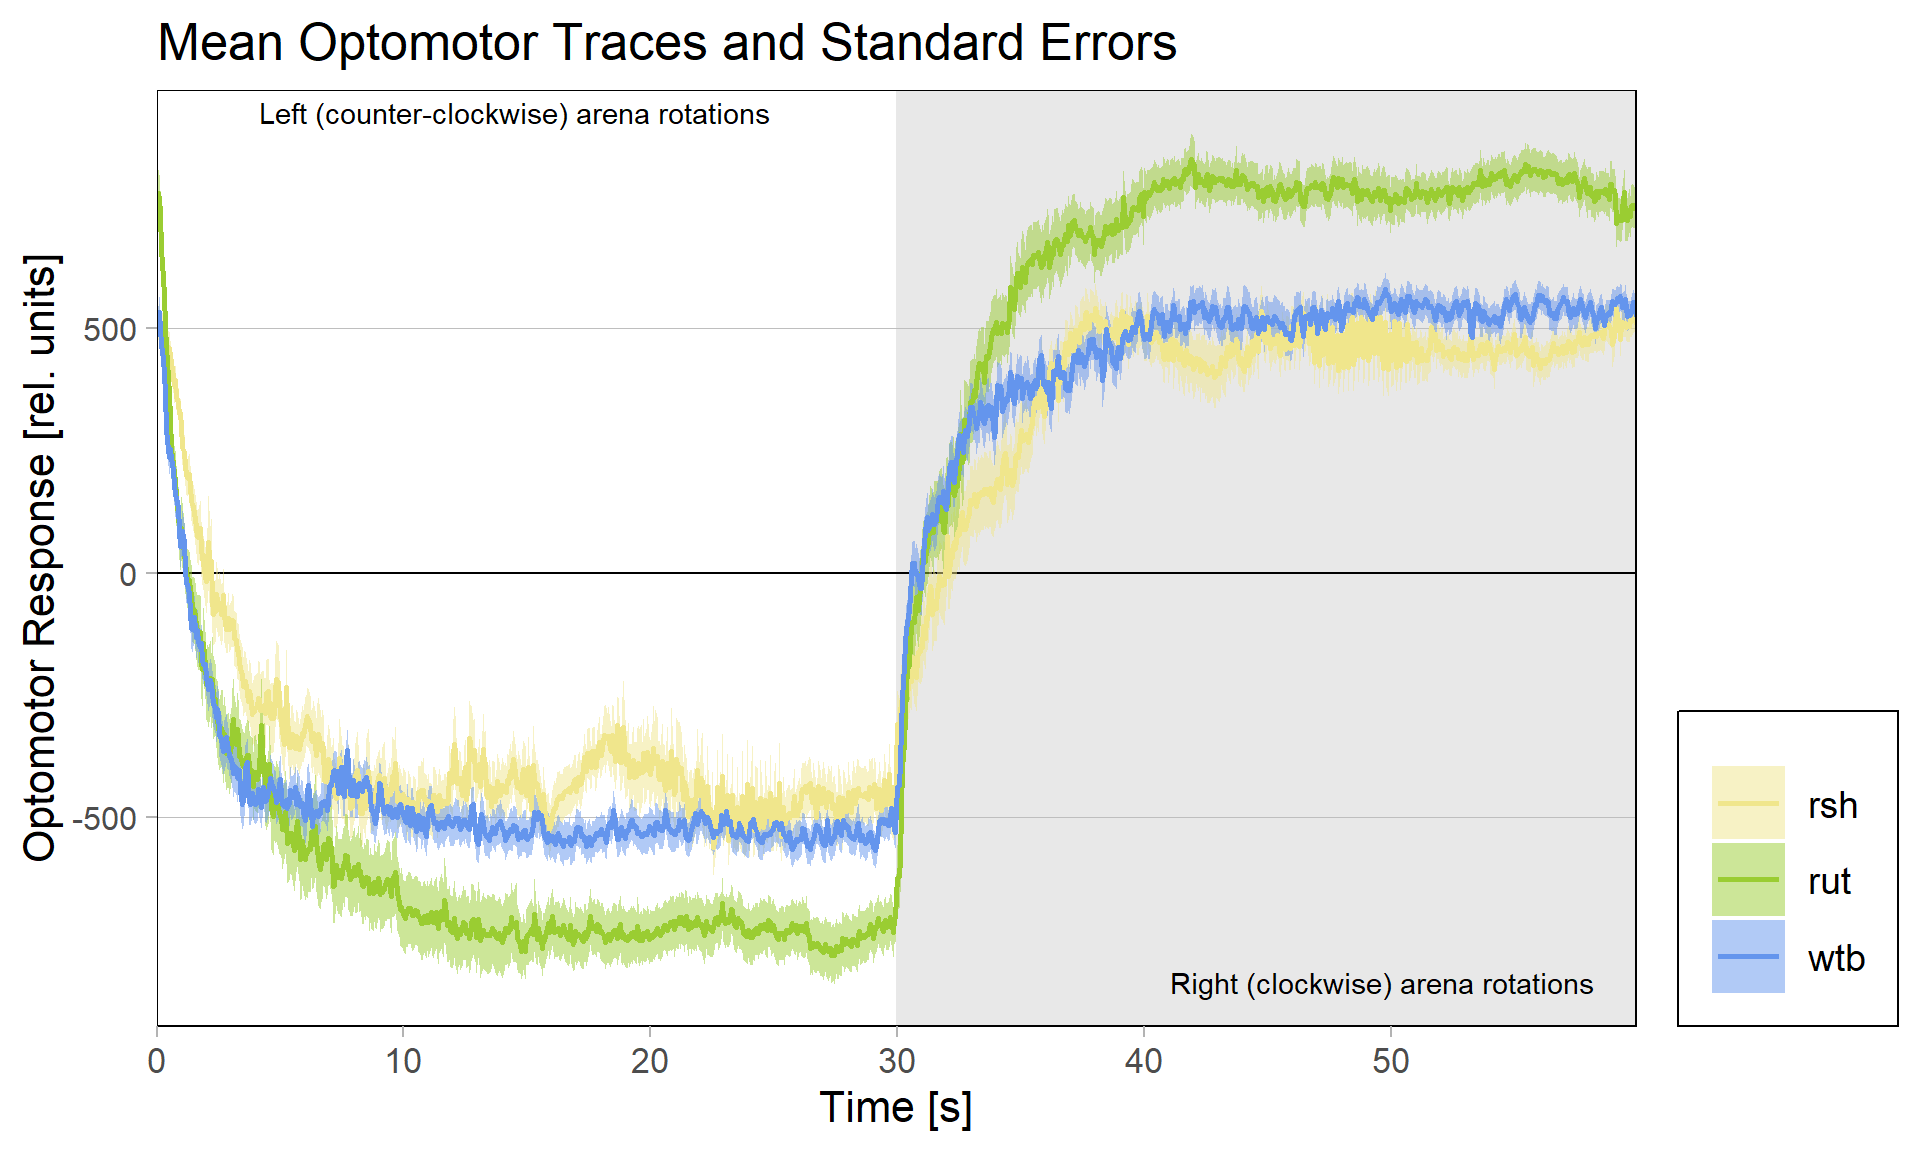
What do you think? Better or worse? Feedback very welcome!
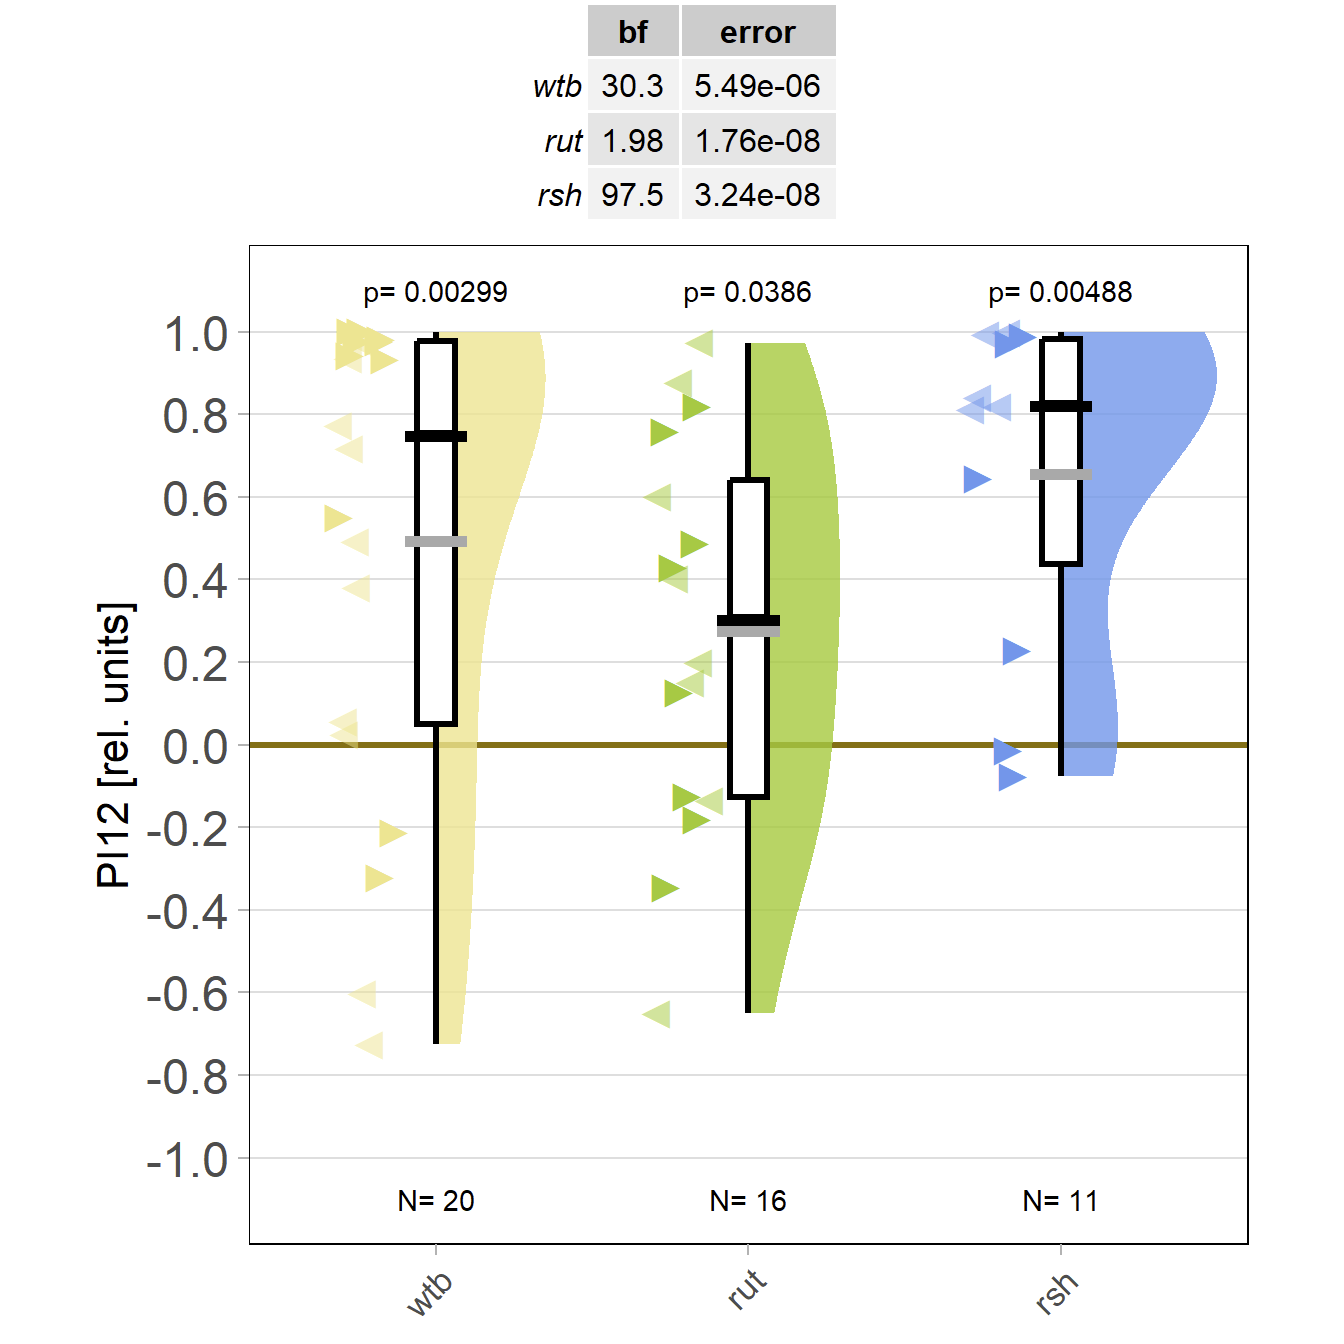
Finally done: rut and rsh flies better at self-learning
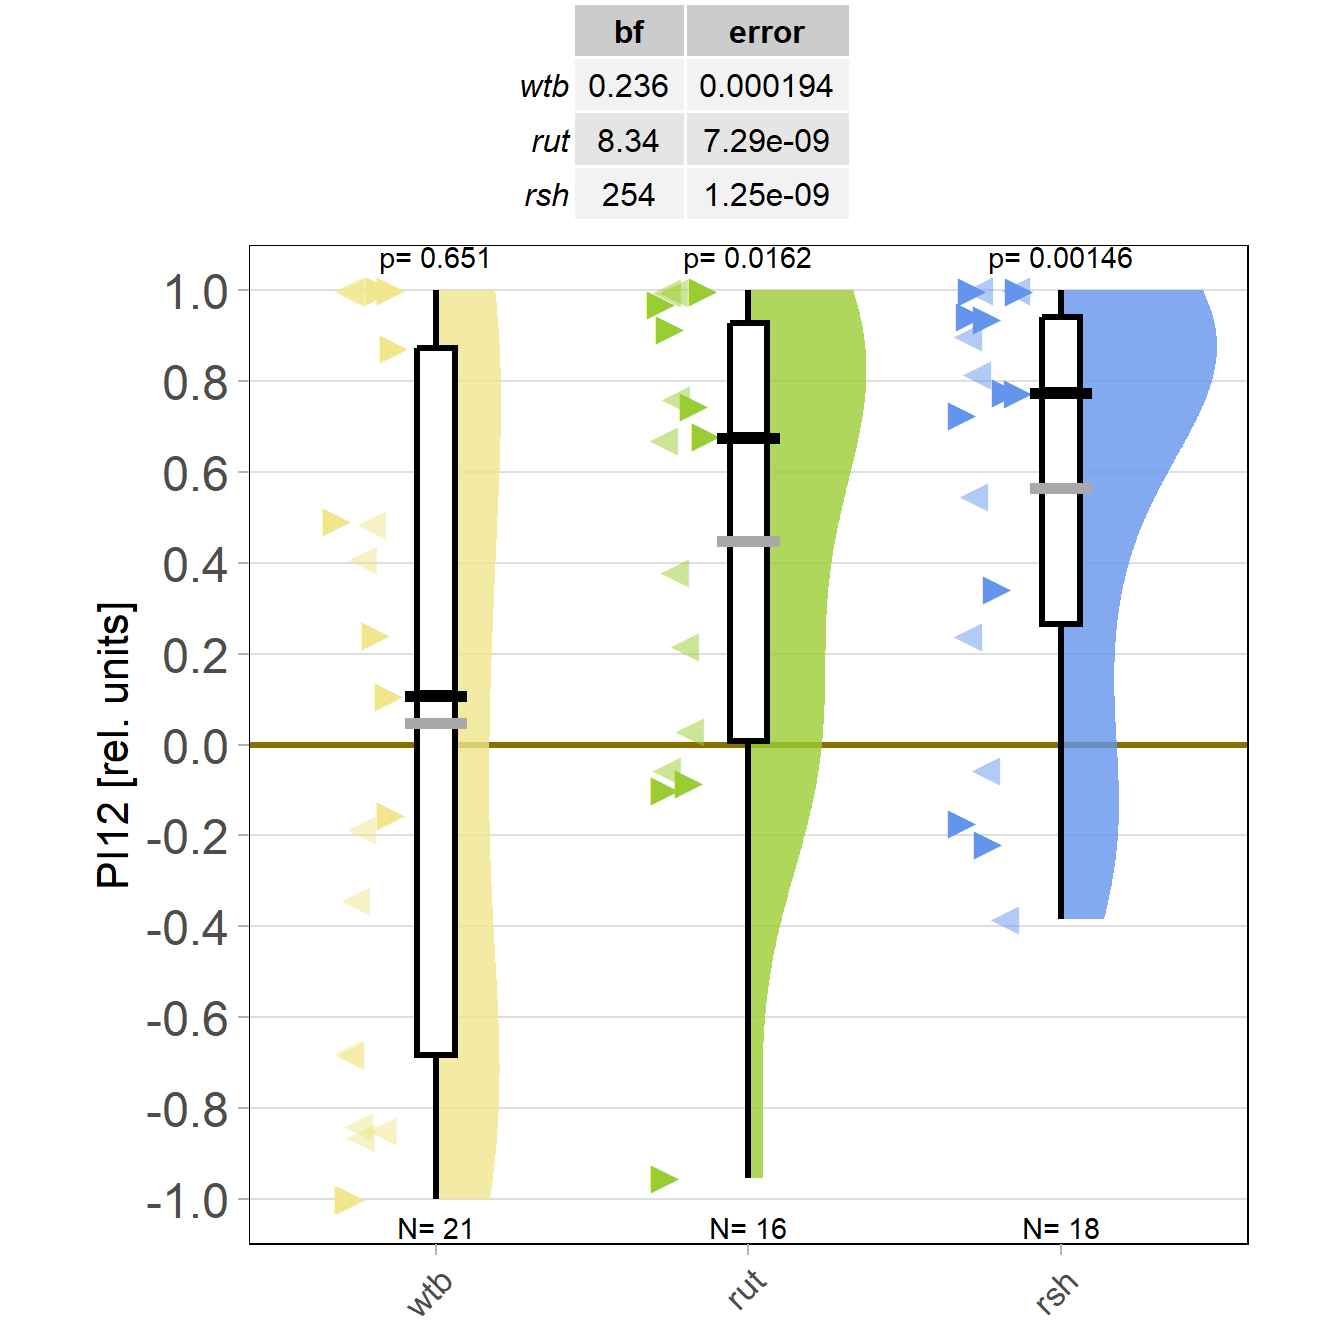
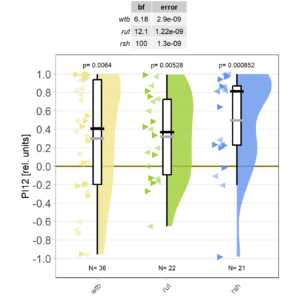
At long last, I got all the flies together that we need for sufficient statistical power. As the preliminary data had indicated, WTB flies don’t learn with the short training, while rut and rsh flies do just fine.
However, this may be due to genetic background effects, so we need to check the CRISPR mutants.
Starting it back up
Last week, the torque mete ran for two days and I managed to record a few radish flies:
Slowly collecting the mutants
Finally, thanks to Marcella gluing to fly wheels instead of one, the mutant data are starting to roll in on the shortened self-learning experiment:
First mutant data coming in
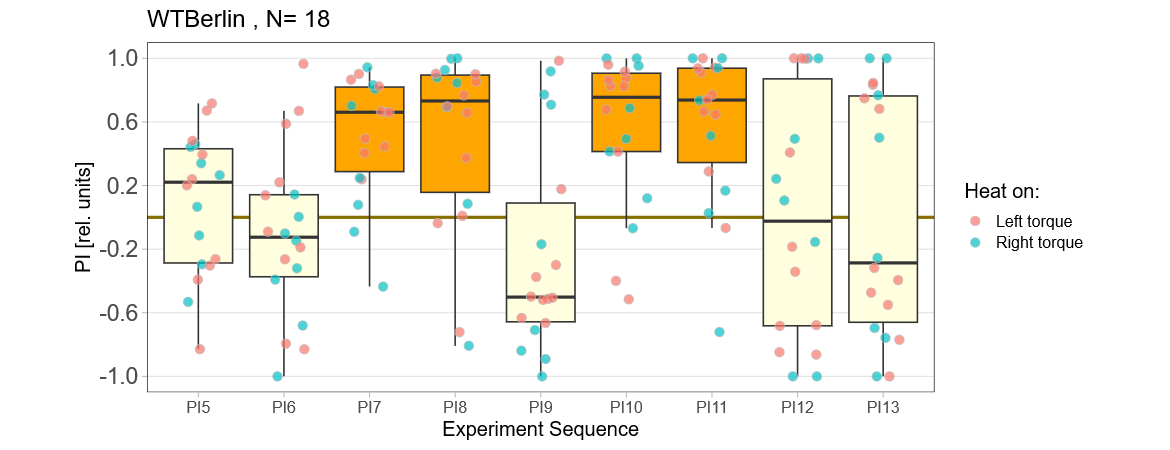
Short yaw torque learning, i.e., only one minute per period. Orange: training, yellow: test. WTB: wild type Berlin, rut: rutabaga learning mutants. With this short training of only 4 minutes, wild type flies show no torque preference in the after training, while at least the first few rutabaga flies show such a preference:
So far, I only could get one radish fly to make it through the experiment, so I cannot display it here.
Four minutes not enough
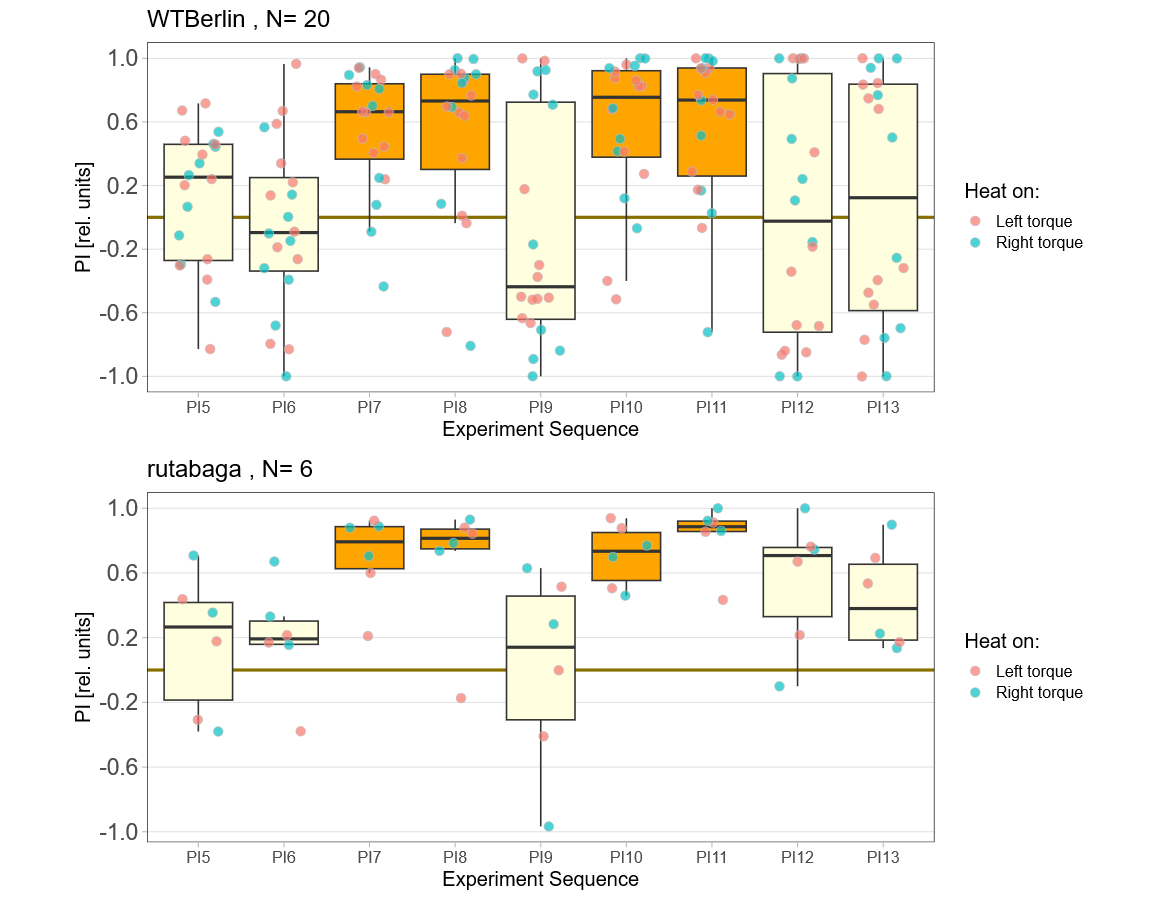
Eight minutes of yaw torque training work just fine for both wild type and mutant flies:
Reducing the training to four minutes is not enough for wild type flies:
Now it will be exciting to see if the mutants still do what they did many years ago: learn better than wild type.
Coded the regression analysis
I now switched the sign of the Optomotor Asymmetry Index in flies that were punished on producing right-turning torque, such that weaker punished torque shows up as a positive index. After that was done, I plotted the correlation between the optomotor index and the preference index:
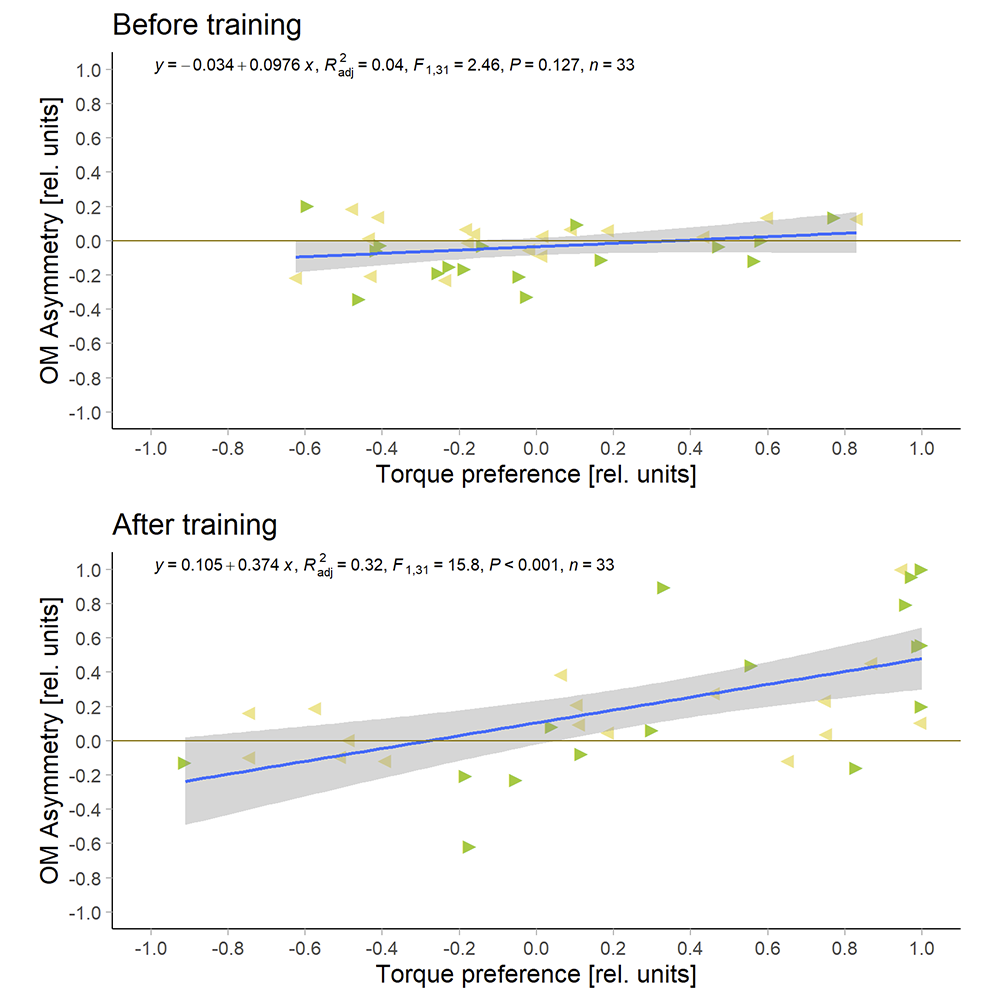
I had to get rid of eight flies where the optomotor response was already asymmetric before the training started, so now I only have 33 flies. But with these flies, there is no correlation before training and a very significant correlation after training.
Any suggestions about appearance of the graphs?
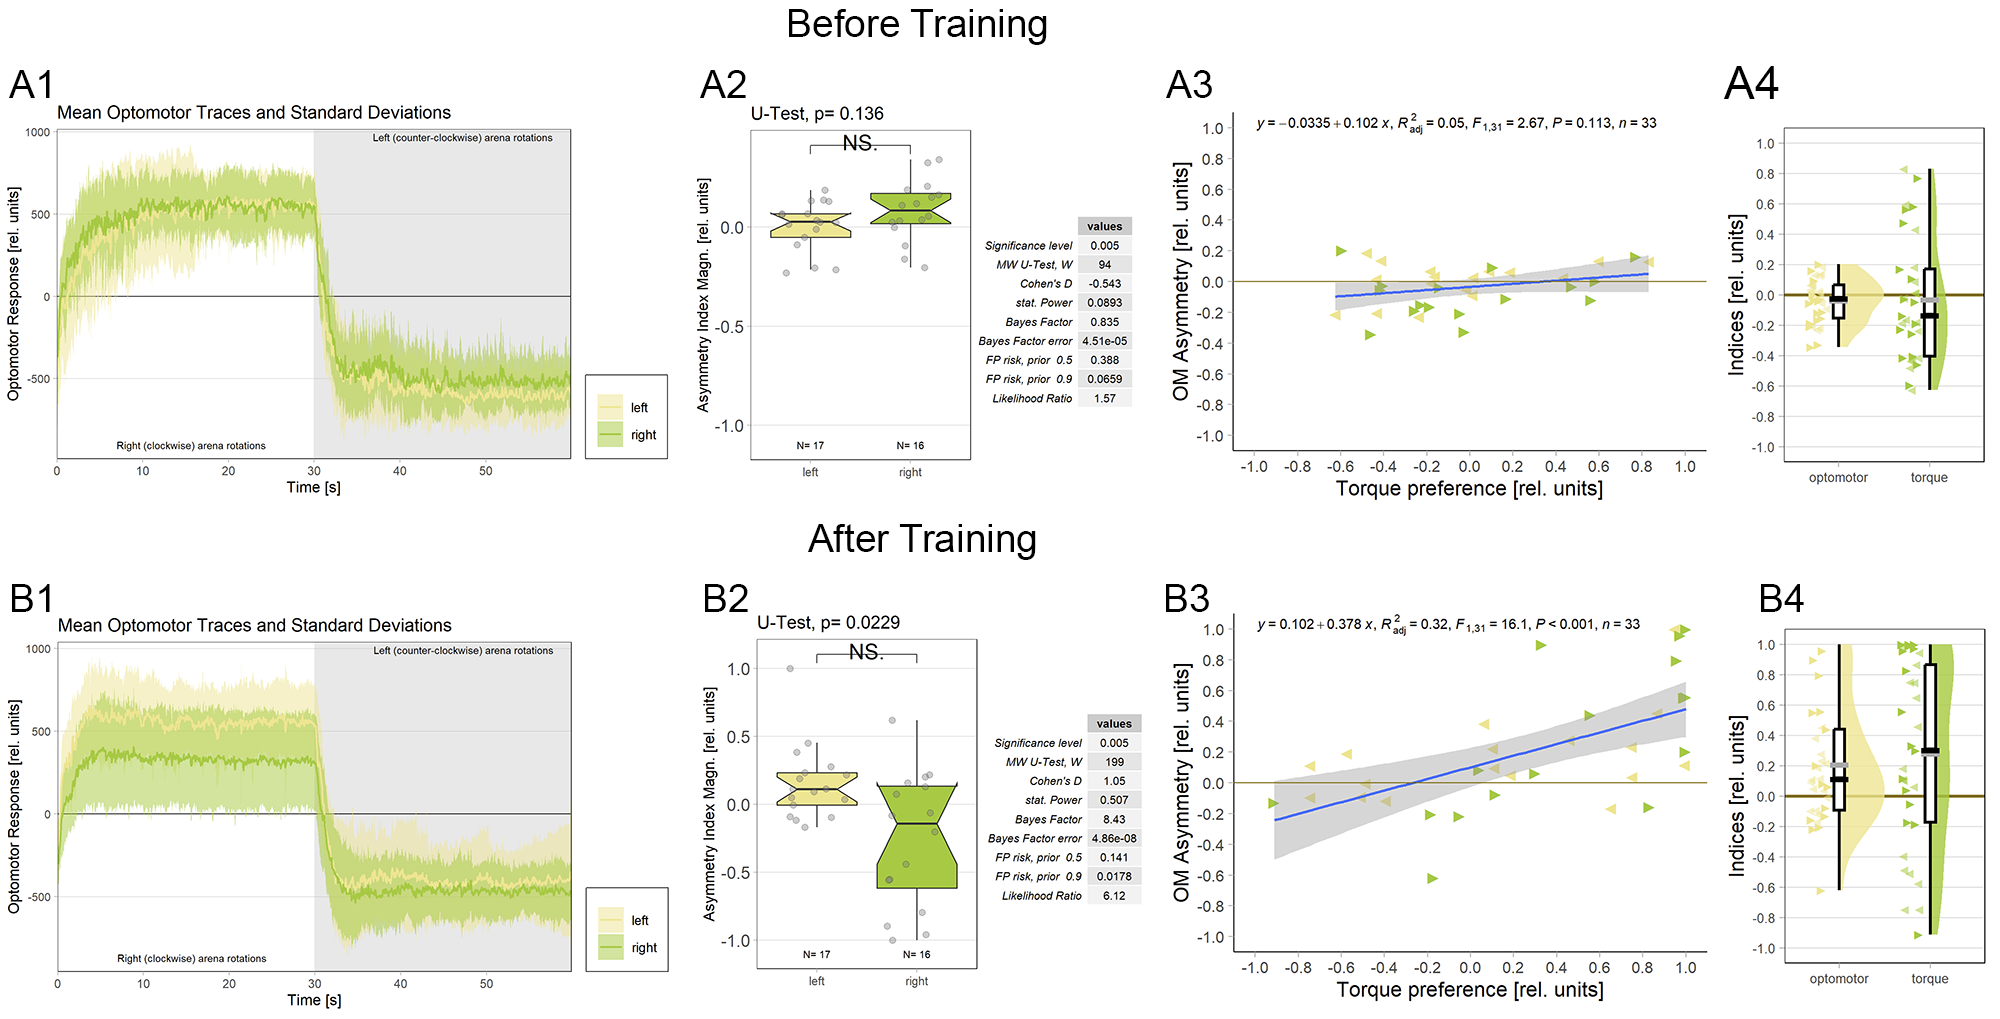
Would it be useful to plot optomotor and performance indices as raincloudplots next to the regressions?
This would be the complete figure:
Optomotor project nearing completion
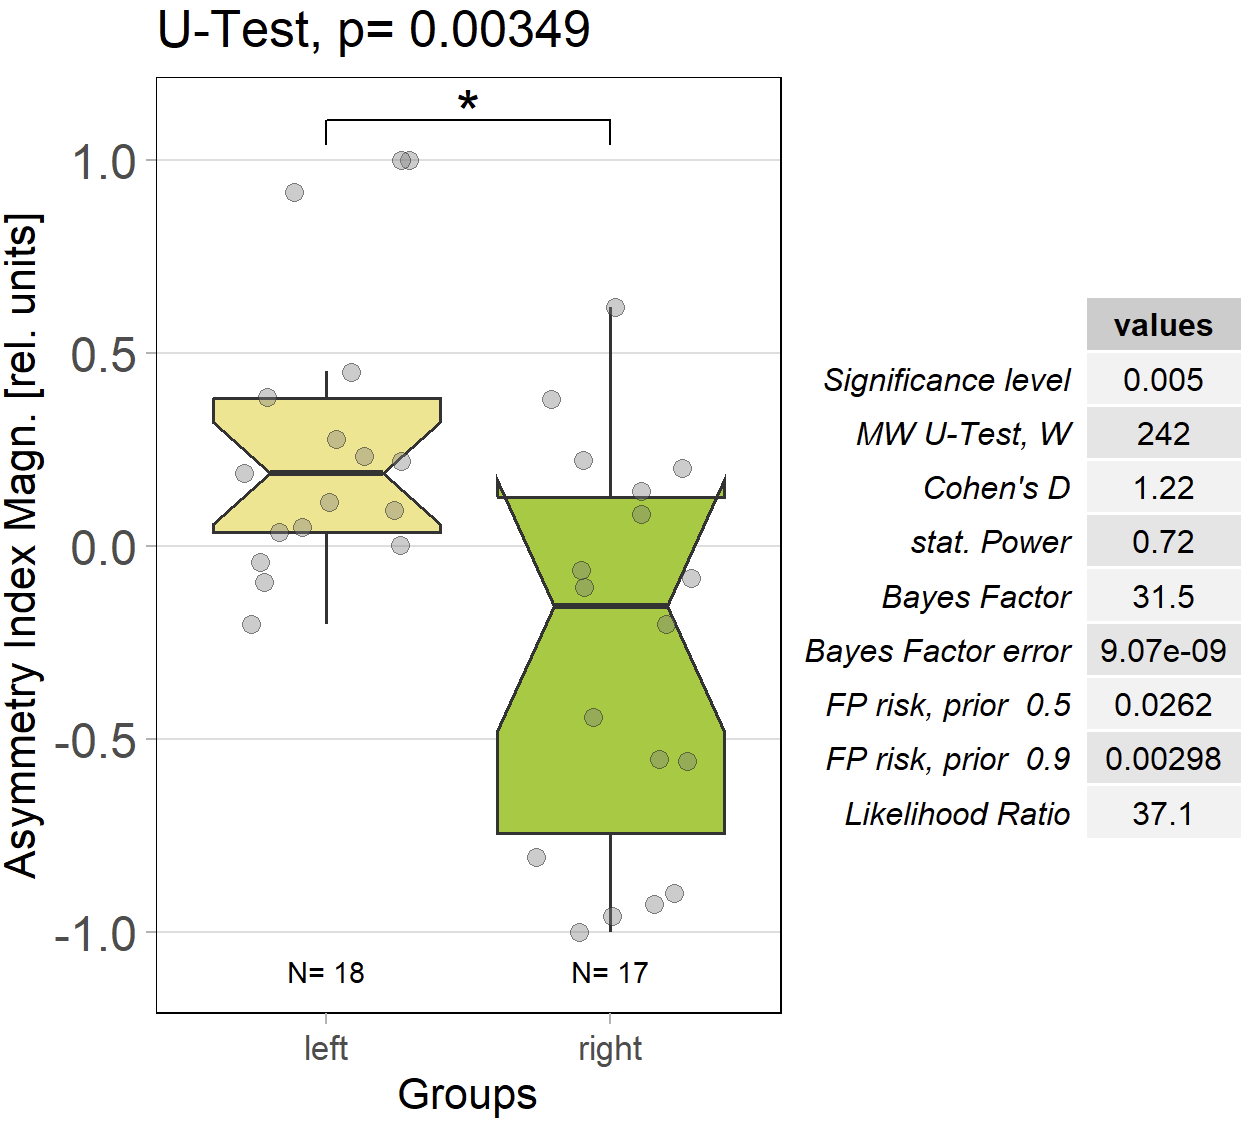
The results of comparing optomotor responses after self-learning remain solid. There still is a small asymmetry between the left/right groups, but nothing dramatic:
Little by little
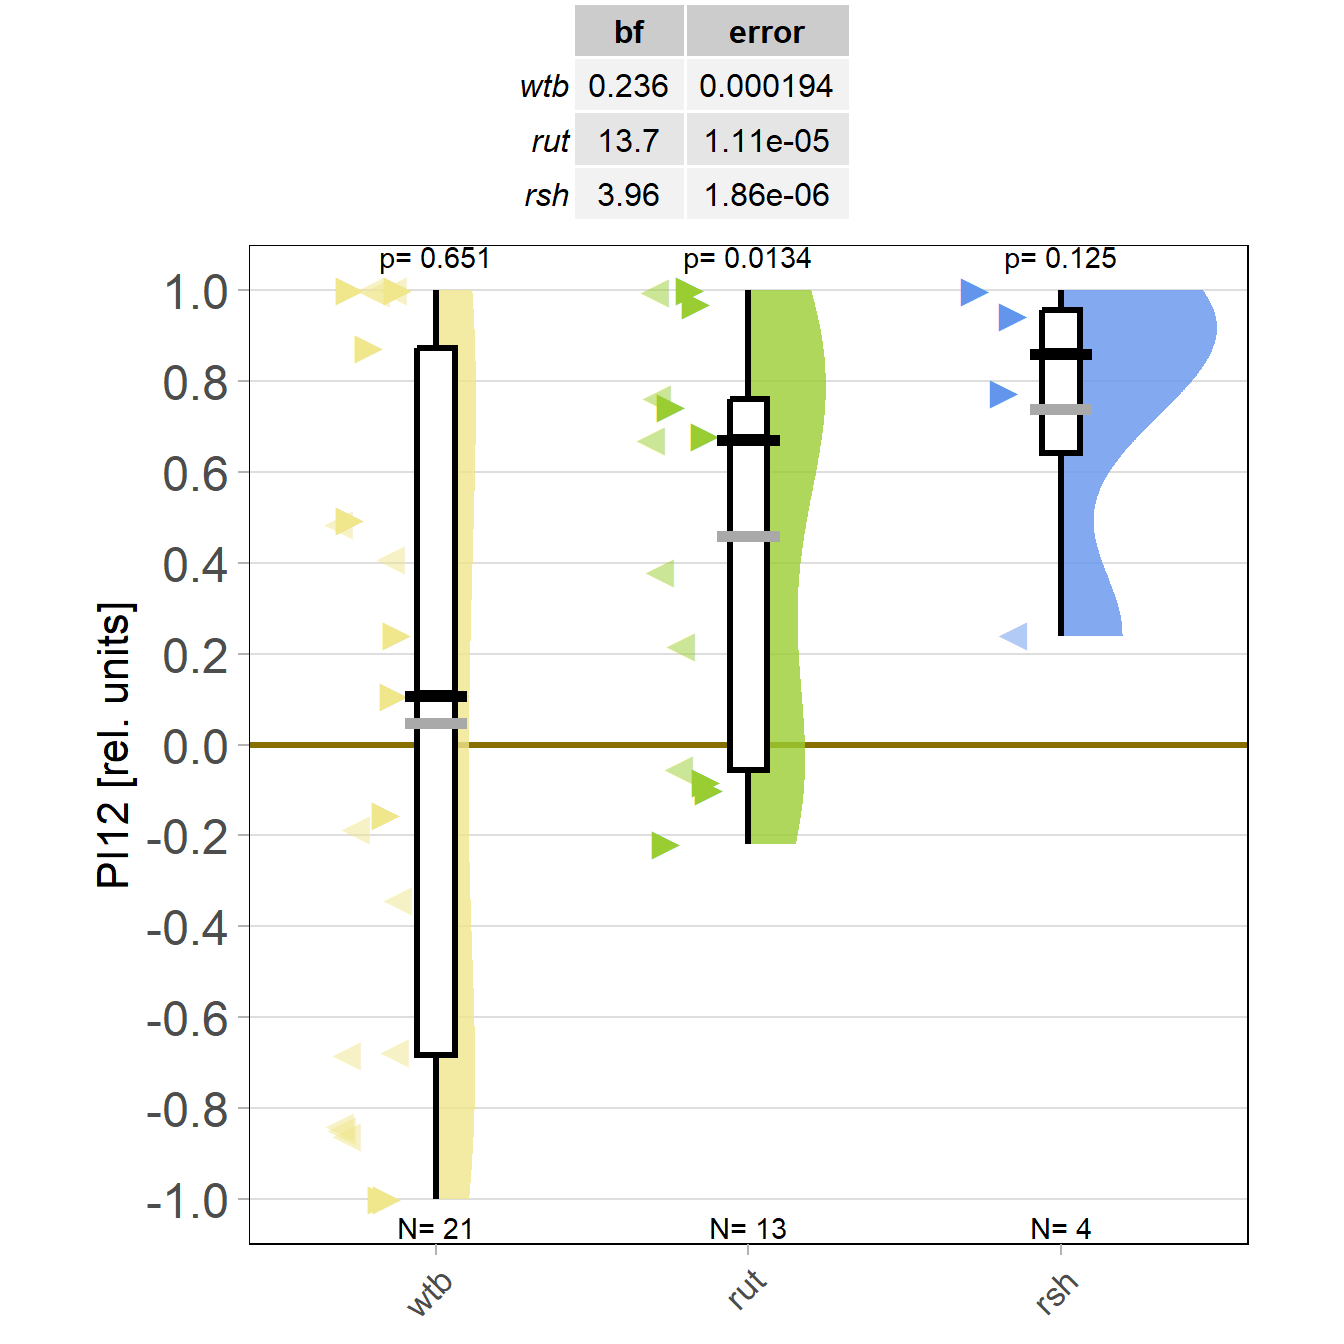
Despite very warm weather, some flies did fly, even though the learning performance of the control flies was really poor. At least for now, it looks like all stocks are learning and that rut and rsh flies learn at least equally well as the Berlin flies. I’ve also managed to fix the positive preference problem:
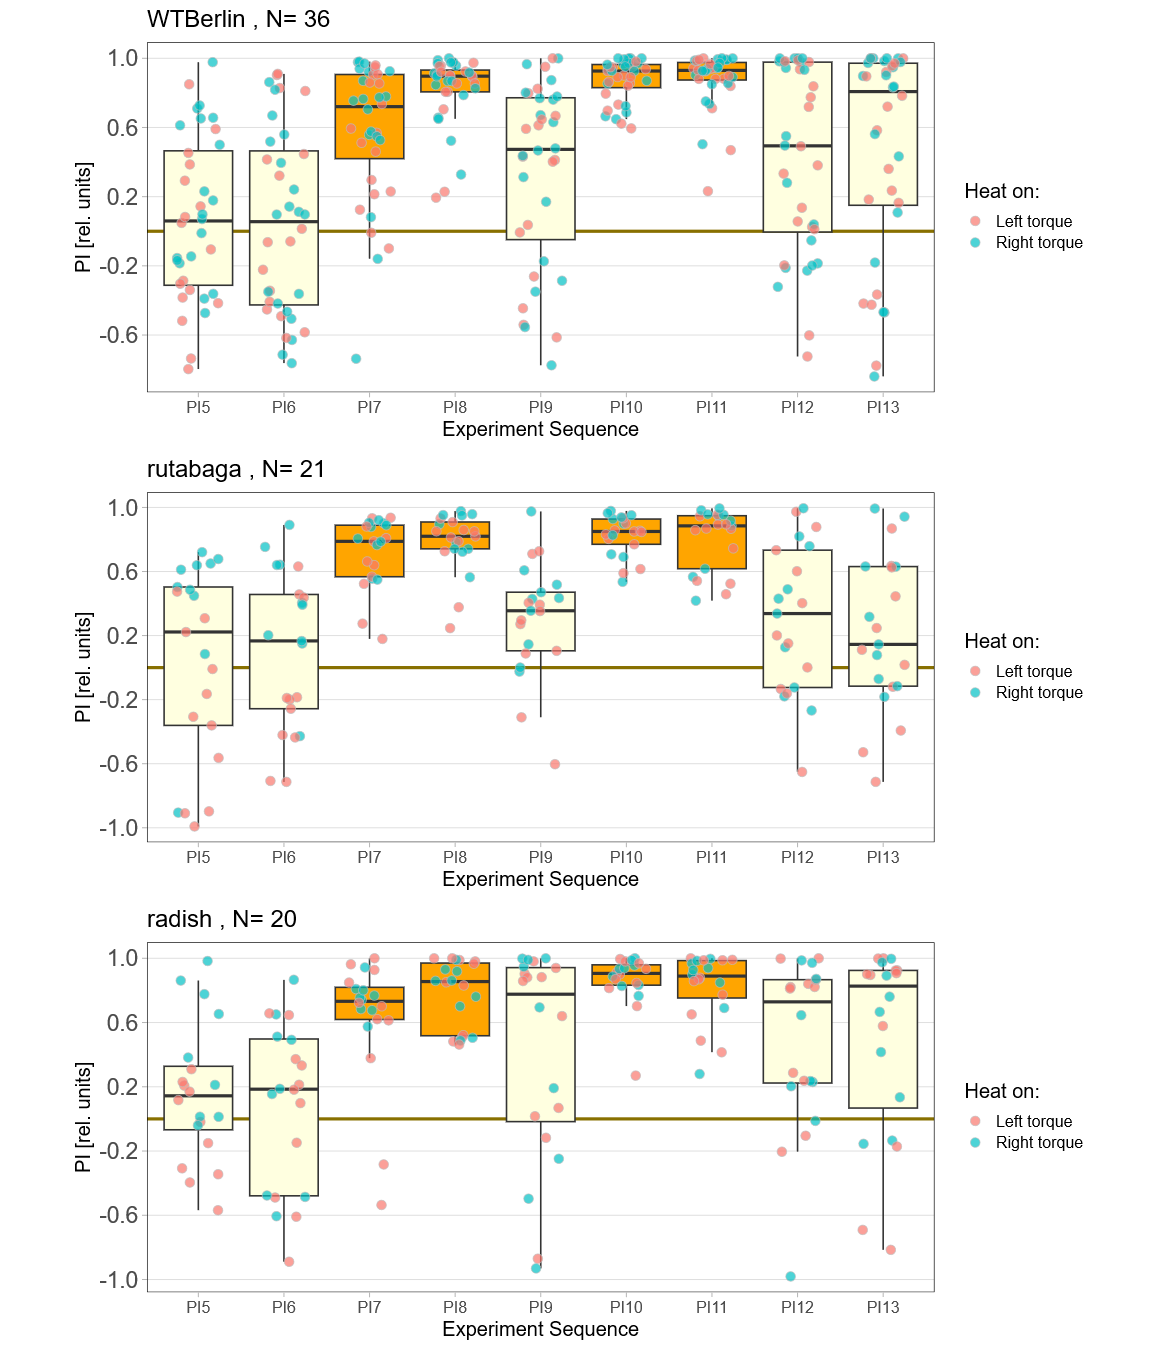
Kicked out Canton S
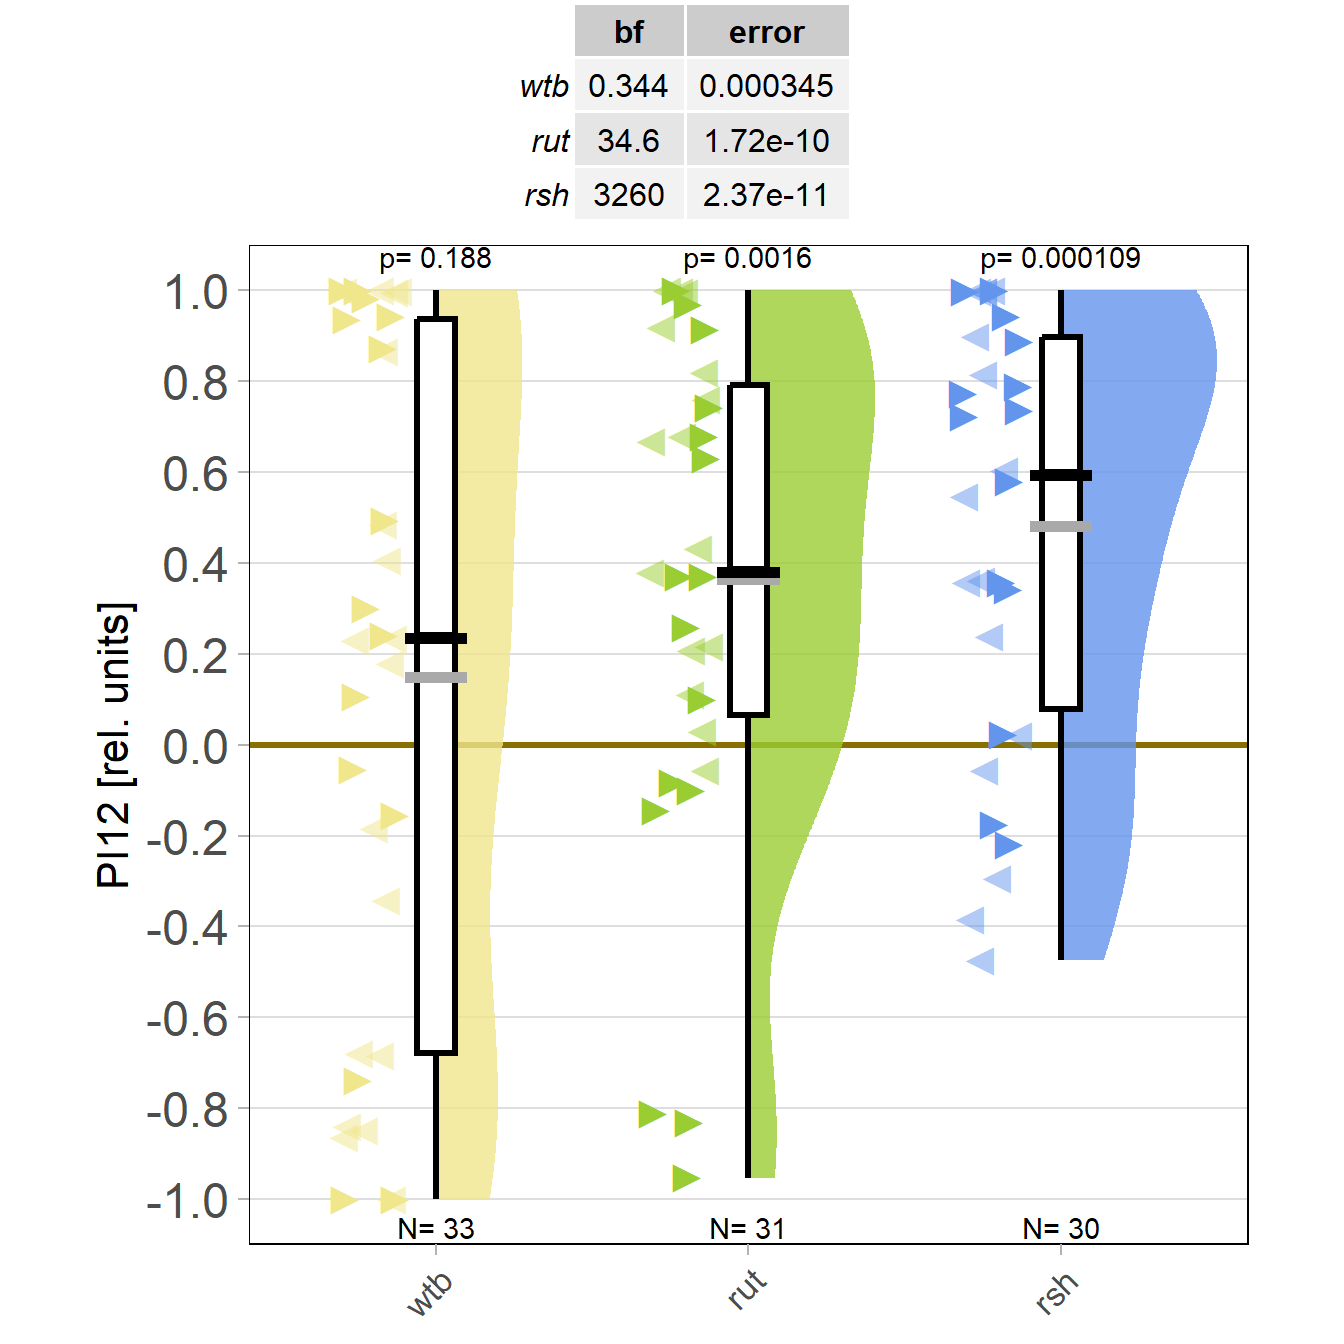
Since the Canton S strain I used wasn’t a perfect genetic background strain anyway and didn’t fly properly, I kicked it out and replaced it with the wild type Berlin data I had collected just prior to the rut and rsh mutants. Now I can collect data for two projects in one go: I check the rut/rsh learning mutants if they still behave the way they should and with the wtb control strain and continue collecting data to evaluate their optomotor responses after training. So now the learning scores for the three strains look like this:
It still doesn’t look like rut is better than wtb, so I’m still skeptical that the strain is really what it should be. The rsh data also don’t look very promising, but I still need to get more flies with a negative preference before the training.