Three Groups Example
on Monday, November 7th, 2022 12:06 | by Silvia Marcato
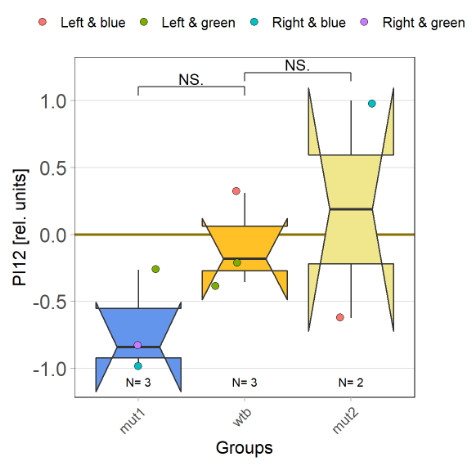
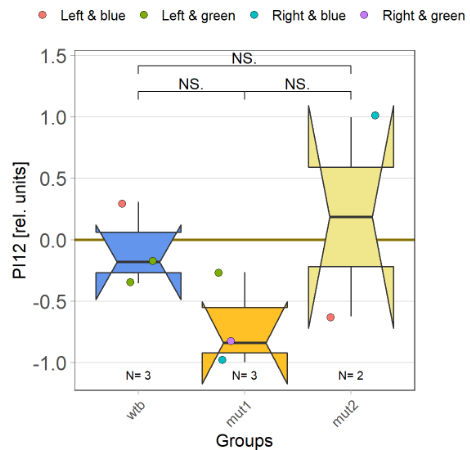
Pseudocode of the statical analysis with three groups according to the group descriptions.
# If n. of groups = 3 and n. of unique descriptions = 2, then perform
# the statistical analysis between singleton and each doubleton group.
# Else if n. of groups = 3 and descriptions are all identical/different,
# then perform the statistical analysis between each one of them.
if (NofGroups==3 & length(unique(groupdescriptions))==2) {
statistical_analysis(singleton, doubleton_1)
statistical_analysis(singleton, doubleton_2)
plot_results
} else {
statistical_analysis(group_1, group_2)
statistical_analysis(group_1, group_3)
statistical_analysis(group_2, group_3)
plot_results
}
wtb (control), mut_2 (experimental)

Category: R code
Leave a Reply