T-Maze experiment with yellow and red lights
on Tuesday, September 7th, 2021 8:40 | by Parva Nasimi
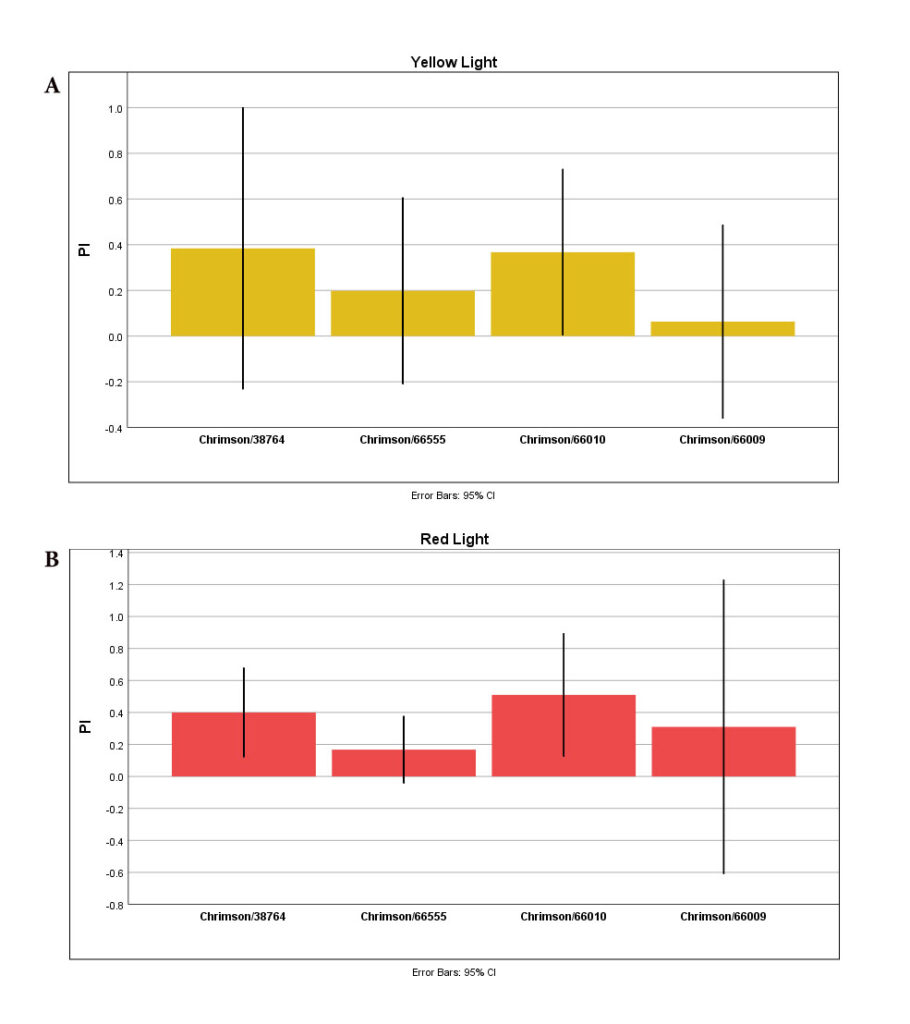
T-Maze experiment with yellow (A) and red (B) lights:
Graphs show “Mean Performance Index” for NorpA-UAS-Chrimson/38764, NorpA-UAS-Chrimson/66555, NorpA-UAS-Chrimson/66010, and NorpA-UAS-Chrimson/66009.
Flies (n=3) were given ATR-treated foods for 2days.
The same flies were used for both experiments, first with red light and the next day with yellow light.

Category: Uncategorized
Leave a Reply