Progress for week 25:
on Monday, June 22nd, 2020 1:58 | by Anders Eriksson
DTS coding
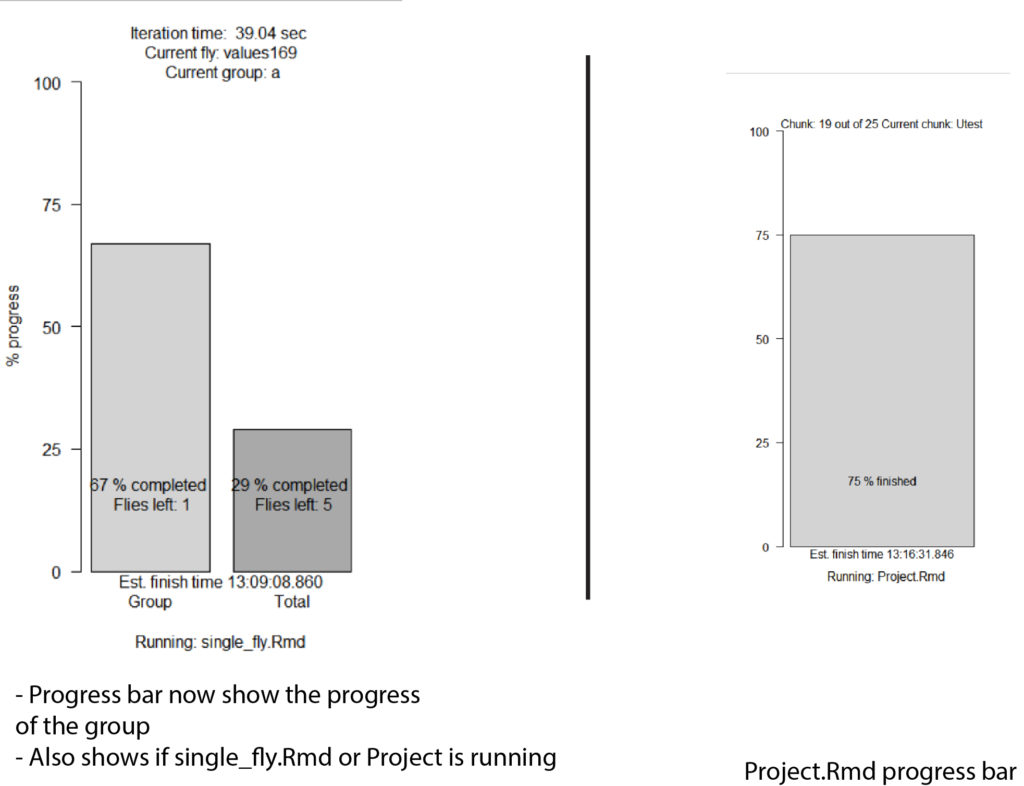
-Added progressbar for data validation
-Updated the progress bar (see figure 1)
-Fixed bug with wrong sample size (see figure 2)
-Fixed bug with unorganized barplots (see figure 2)
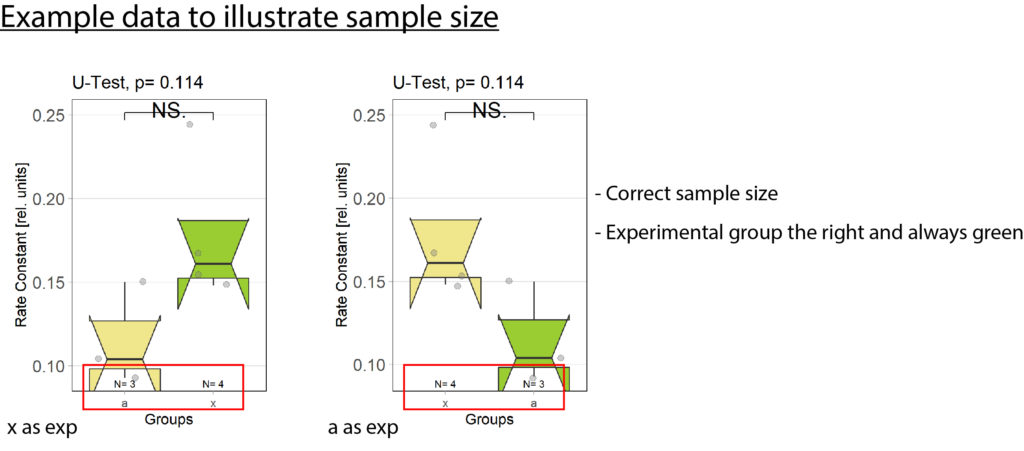
Exp always to the right: plotOMparams <- plotOMparams[order(plotOMparams$desc),]
plotOMparams$group <- factor(plotOMparams$group, levels=paste(unique(plotOMparams$group)))
Samplesize fix:samplesizes.annotate(boxes, as.numeric(table(plotOMparams$desc)))
Progressbar: progress <- c(round(l(100/(length(xml_list)))),round(flycount(100/(totalflies))))
Rescreening:
-Finished rescreening last Thursday. Started to evaluate the new data
Optomotor platform: Ran a few more tests to confirm that the machine was still working, it is. I also adjusted the 0 line so that it is at 0, by readjusting the “zero line” screw. Looks much better now but it is still not perfectly at 0. A difference 0.1 on the computer screen translates to 100 in the evaluation chart.
Optomotor platform:
Ran a few more tests to confirm that the 0 line is always at 0. Readjusted the “zero line” screw. Looks much better now. It is still not perfectly at 0 but a difference of 0.1 in the chart translates to 100 in the evaluation graph.

Category: Lab, Optomotor response, R code, Uncategorized
Leave a Reply