Updates on Optomotorics and DTS evaluation
on Monday, December 16th, 2019 1:57 | by Anders Eriksson
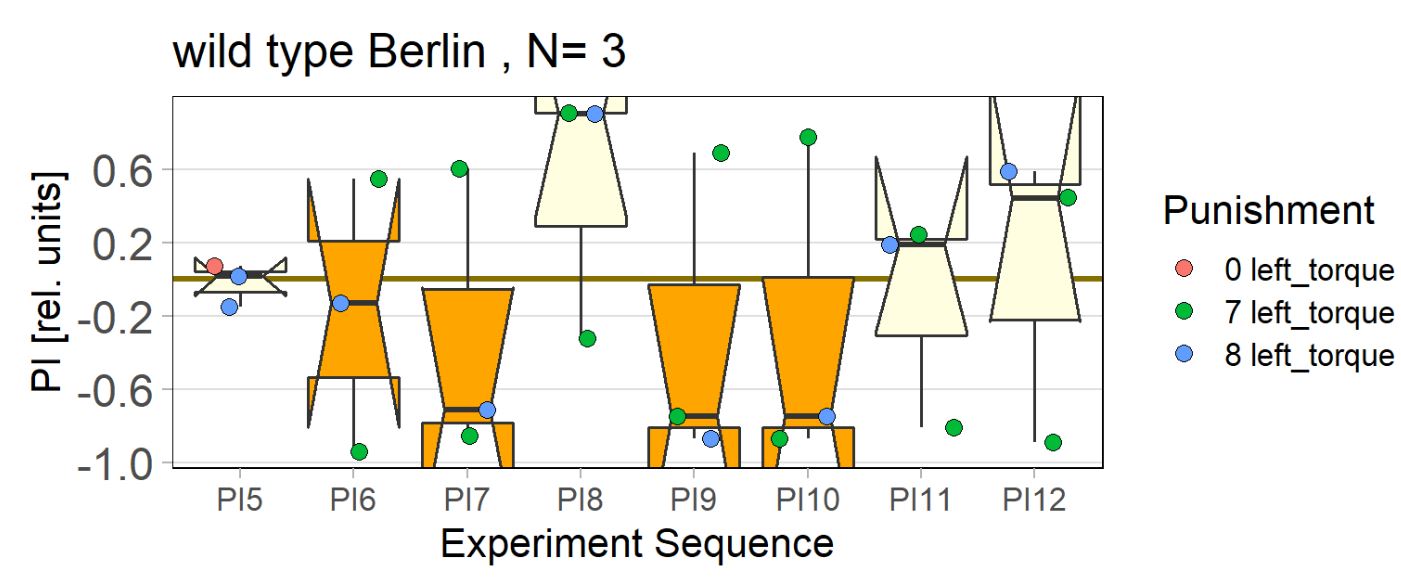
DTS: The graph below is an example image of how color according to category looks like. The output now adds a unique color for each category. The one below has three different colors as the pretest phase does not use any pattern and is therefor read as its own category.
Optomotorics: The software worked as it should although it had a couple of issues. Wrong information in xml sheet was one of them: this is now fixed so that it enters duration as seconds and the correct terms for a_pos and j_pos are used
The other issue was that at the end of the experiment about 40-50 data points were missing/removed. My speculation was that this either had to do with data being removed at the end of the experiment or that it ended prematurely. Turns out that the later was the cause.
As simple as it might seem, there was a lot of investigation to find this bug. To fix this I simply had to replace if curr_count >= self.test_time() - 100:
with if curr_count >= self.test_time() - 30:

Category: Uncategorized
Leave a Reply