Program testing & Histogram Comparison
on Monday, October 8th, 2018 9:20 | by Max von der Linde
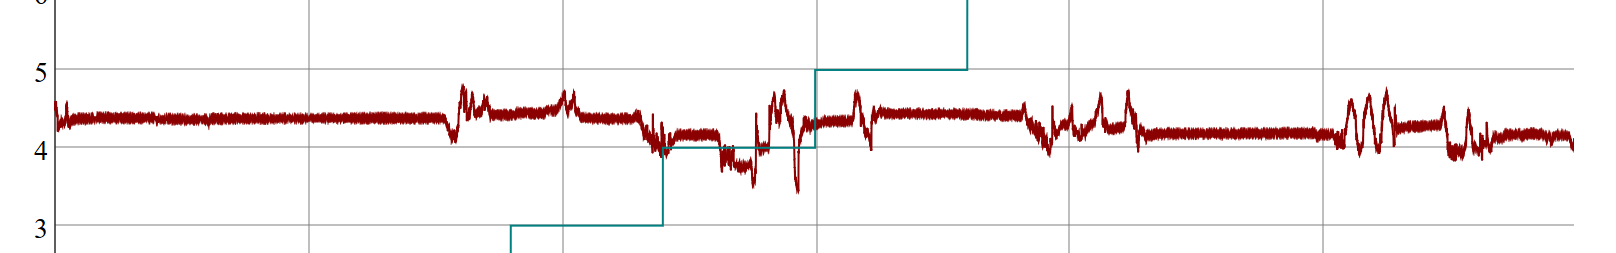
Is the program doing its job? Manual stimulation of the platform:
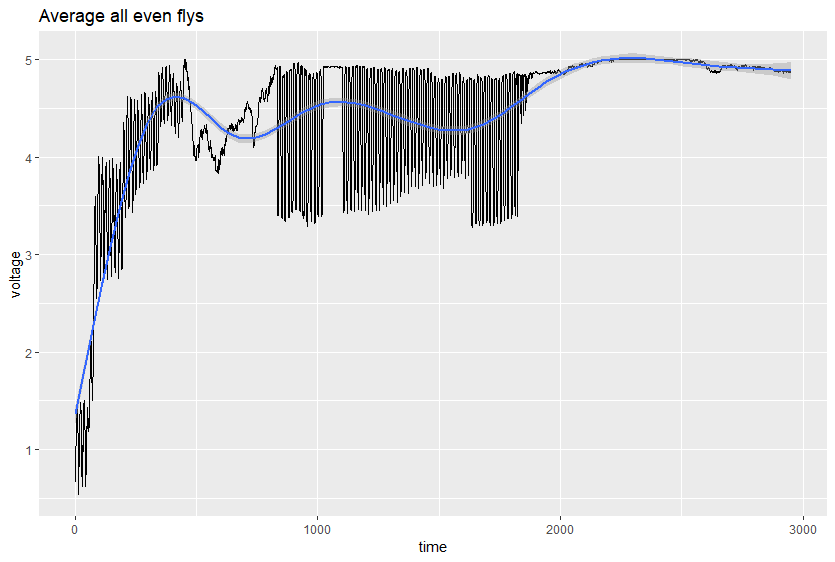
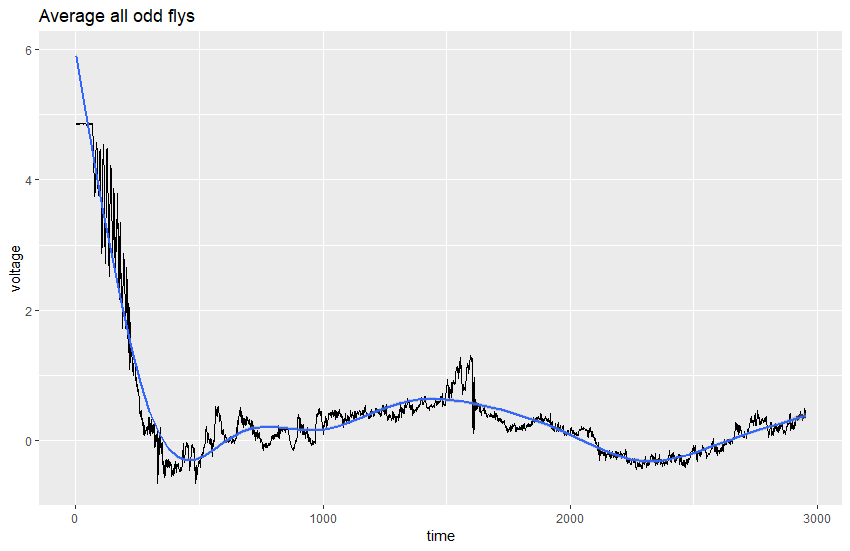
-> yes it is
Histograms
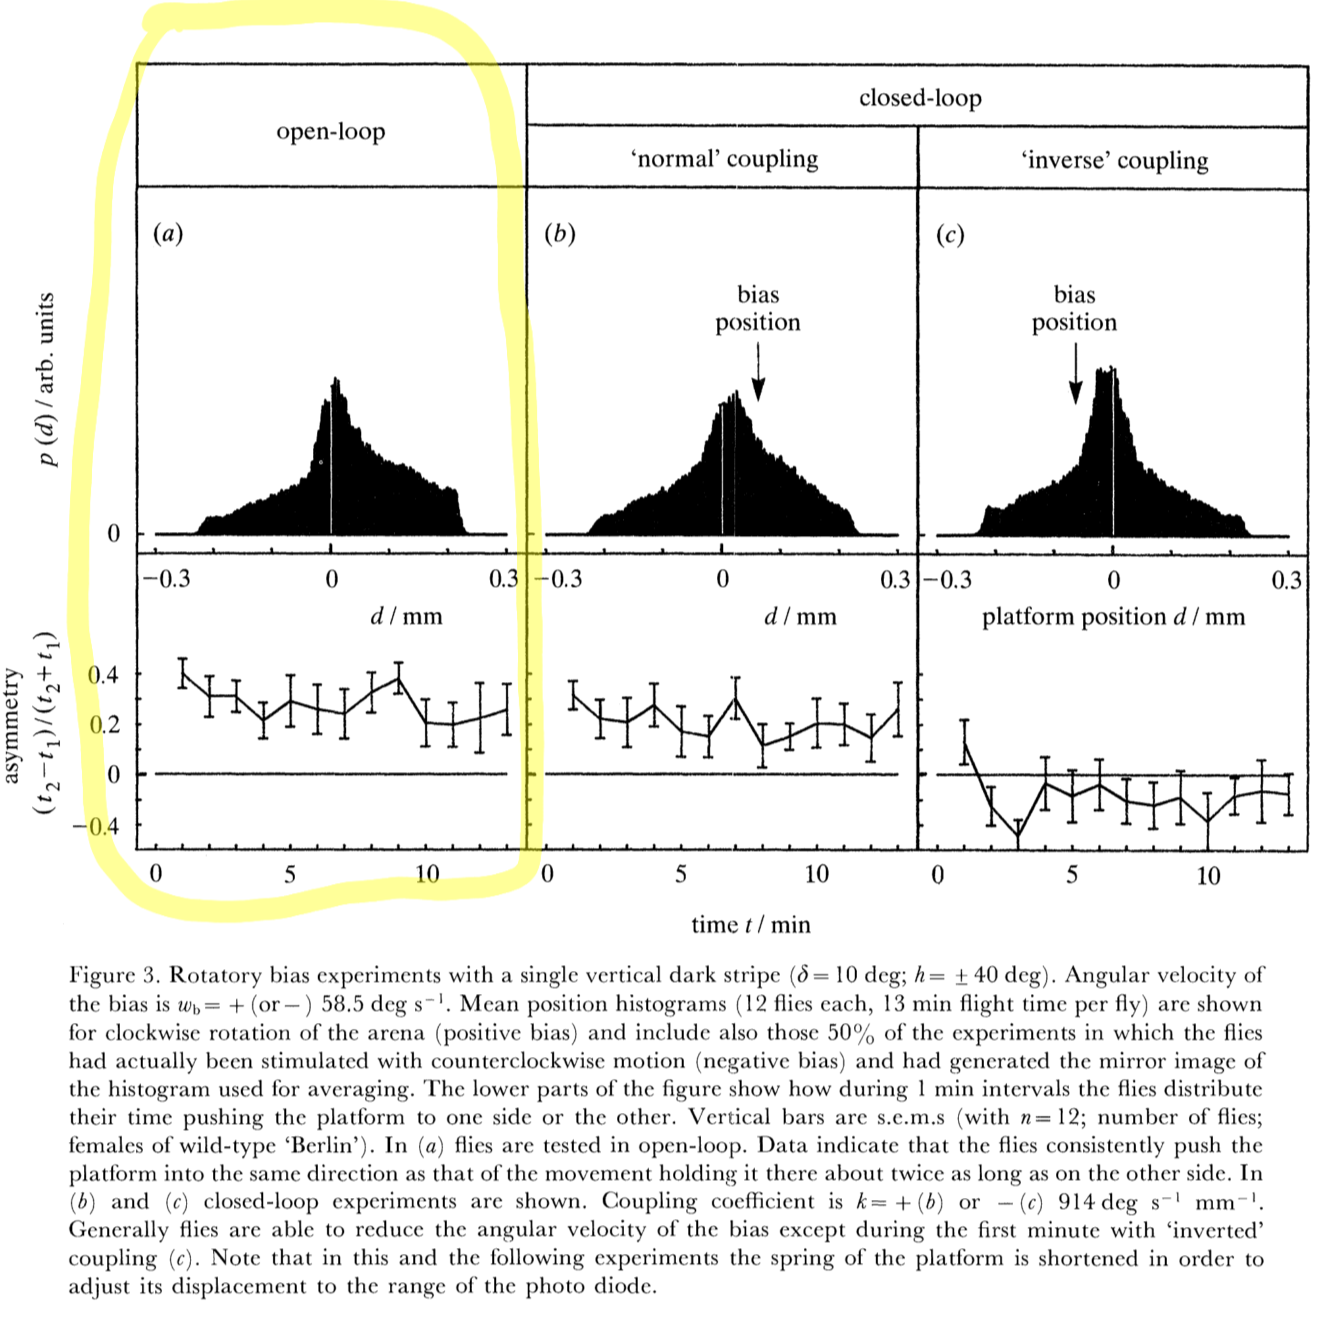
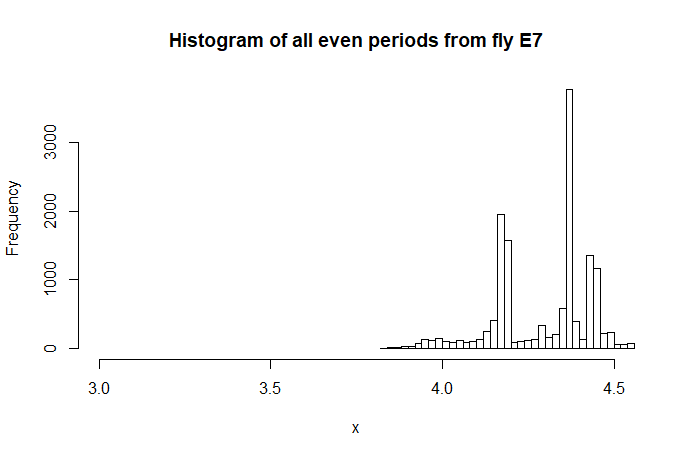
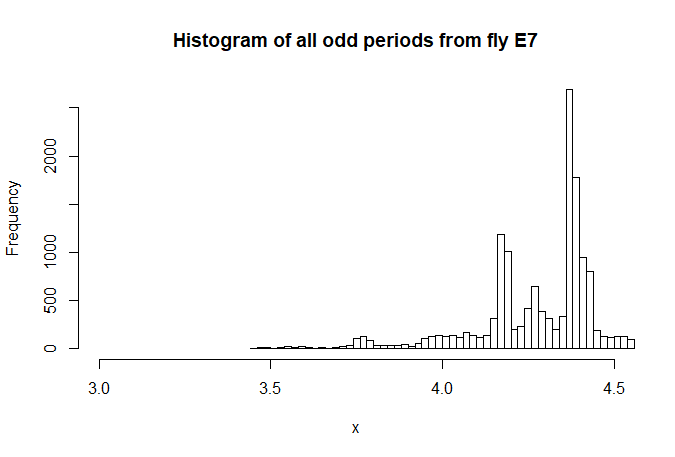
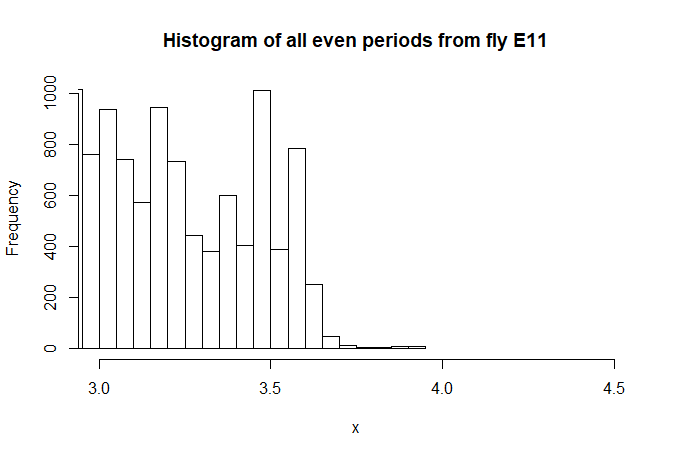
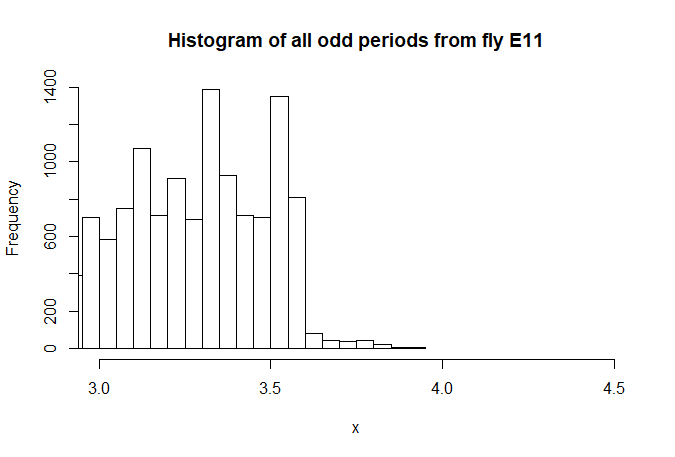
Why frequency histograms? I want to compare my data to the data from “Can a fly ride a bicycle?” (Wolf 1992):
example fly E7:
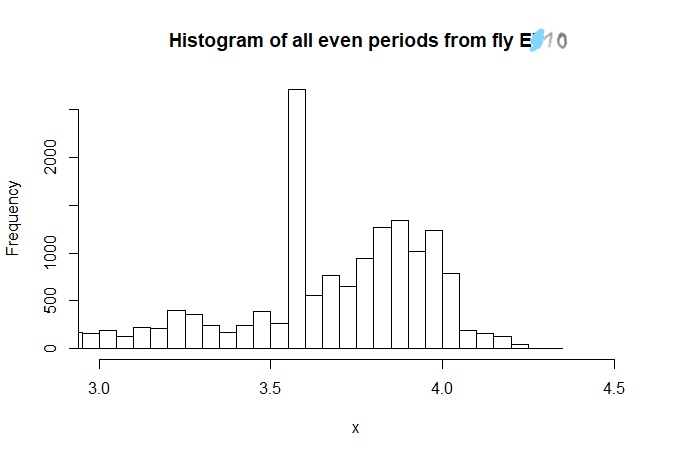
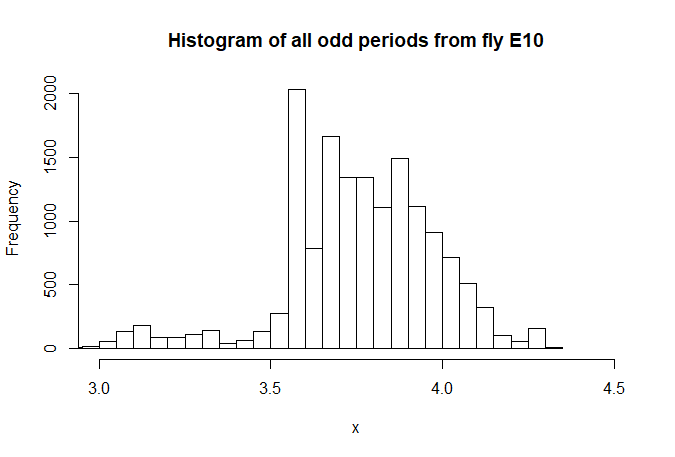
example E10:
example E11
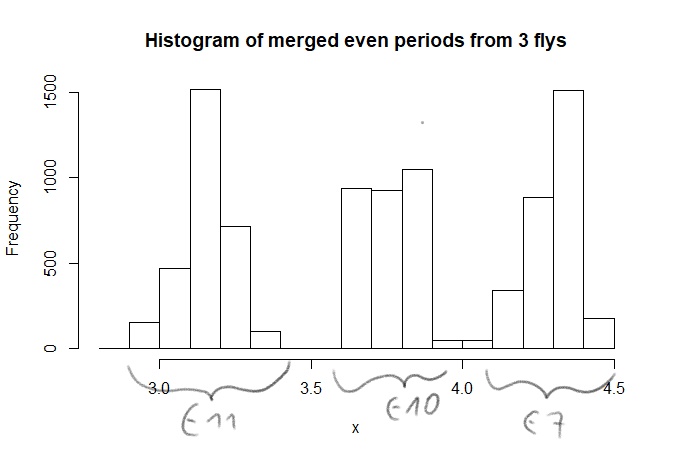
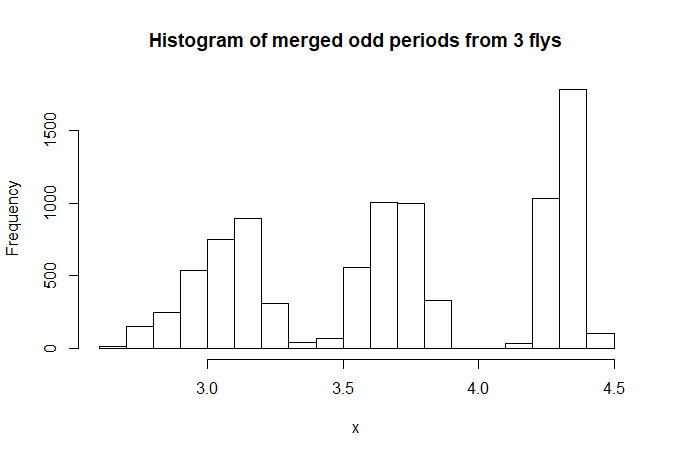
Histogram of 3 flys (periods of idividual flys have been merged -> one odd and one even period per fly):
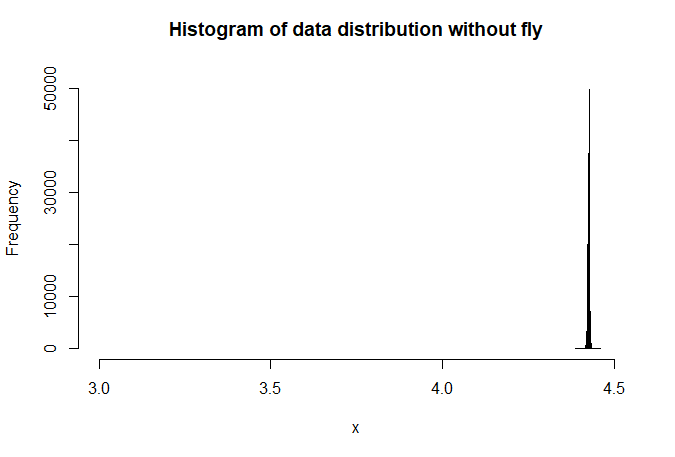
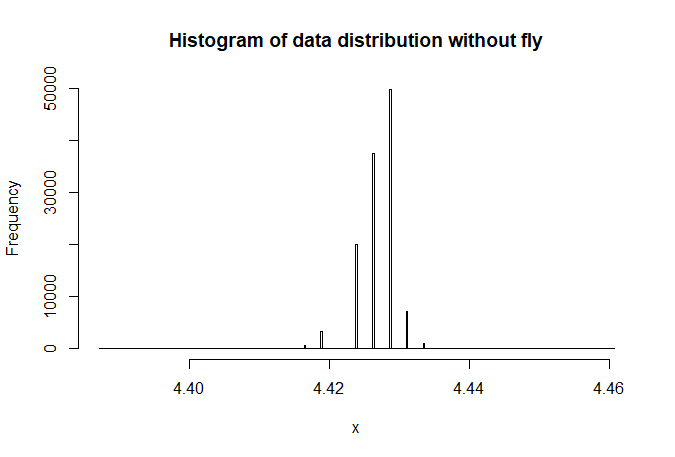
Histogram of platform without fly:
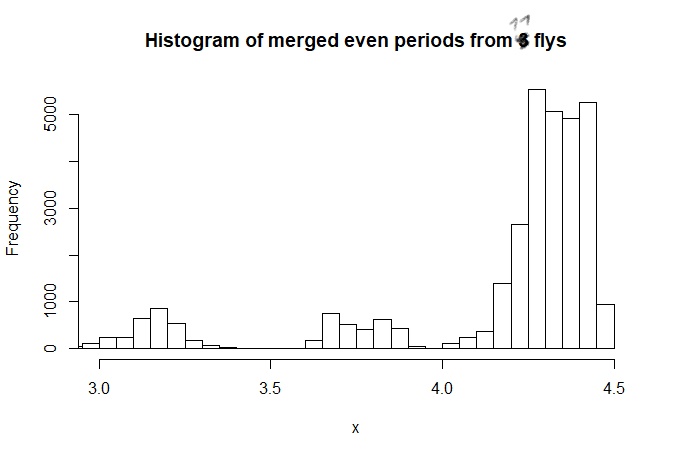
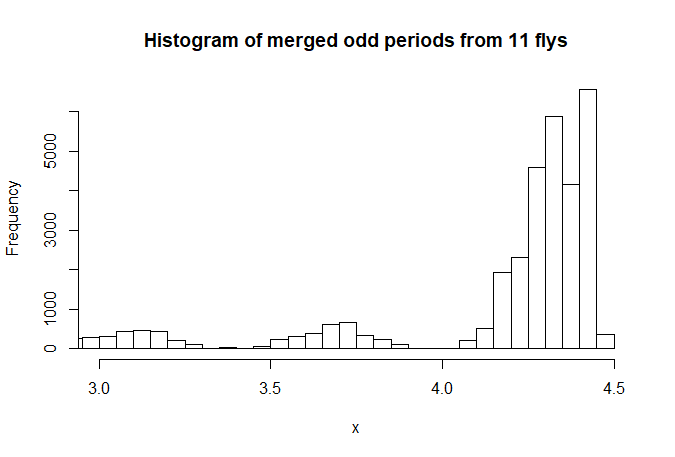
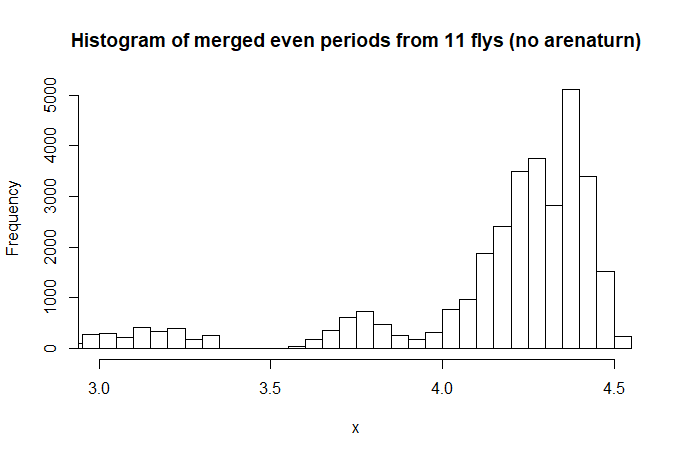
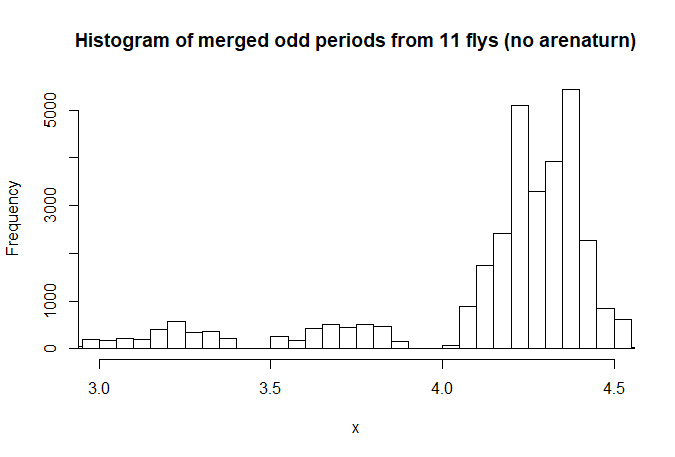
Histogram of 11 flys (periods of idividual flys have been merged -> one odd and one even period per fly):
Histogram of 11 flys (no arenaturn):
Fly 3 (discussion model)
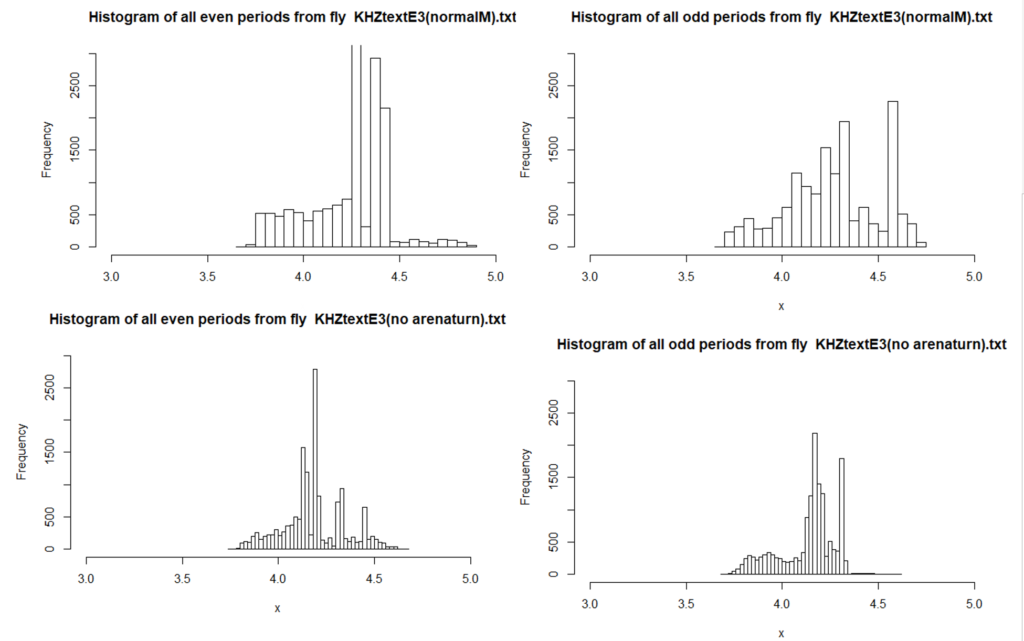
All Histograms of different tests for fly 3
-> merging makes little sence if the distribution is completely different areas for each fly!

Category: Uncategorized
Leave a Reply