Datahandling OptoMotorics
on Monday, September 17th, 2018 12:31 | by Max von der Linde
Table with the generated fly test data:
| Test | Description | Average right | Average left | Differece | general |
| Ex4 | normal | 4.55382 | 4.624879 | 0.071059 | 4.5893495 |
| Ex4 | repositioned | 4.562121 | 4.579682 | 0.017561 | 4.5709015 |
| Ex5 | normal | 4.273299 | 4.434383 | 0.161084 | 4.353841 |
| Ex5 | repositioned | 4.562121 | 4.579682 | 0.1610834 | 4.5709015 |
| Ex6 | normal | 3.535669 | 3.587334 | 0.051665 | 3.5615015 |
| Ex7 | no arena | 3.349097 | 3.337588 | -0.0115097 | 3.343343 |
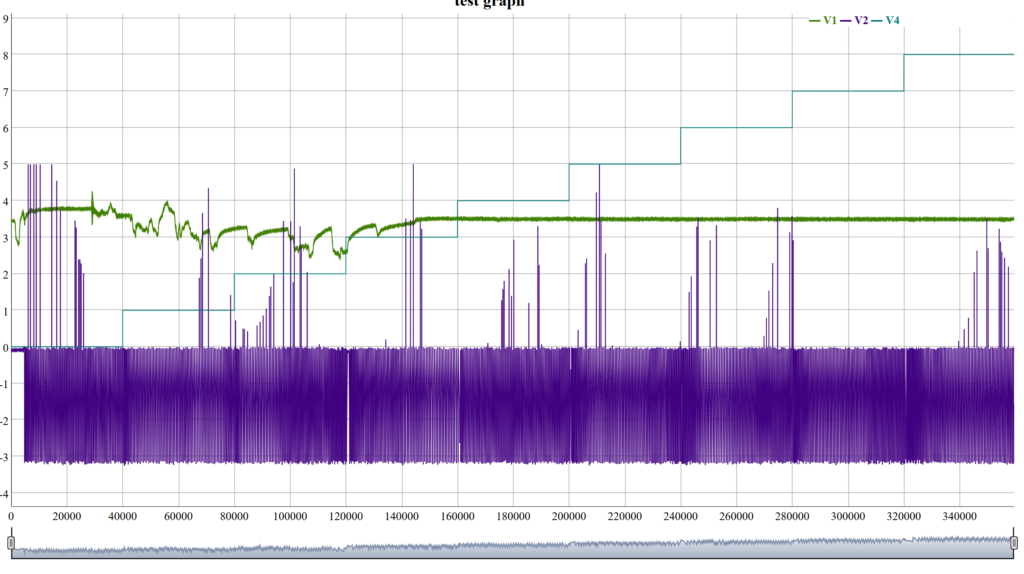
| Ex8 | bad fly | 3.42903 | 3.394603 | -0.034427 | 3.411816 |
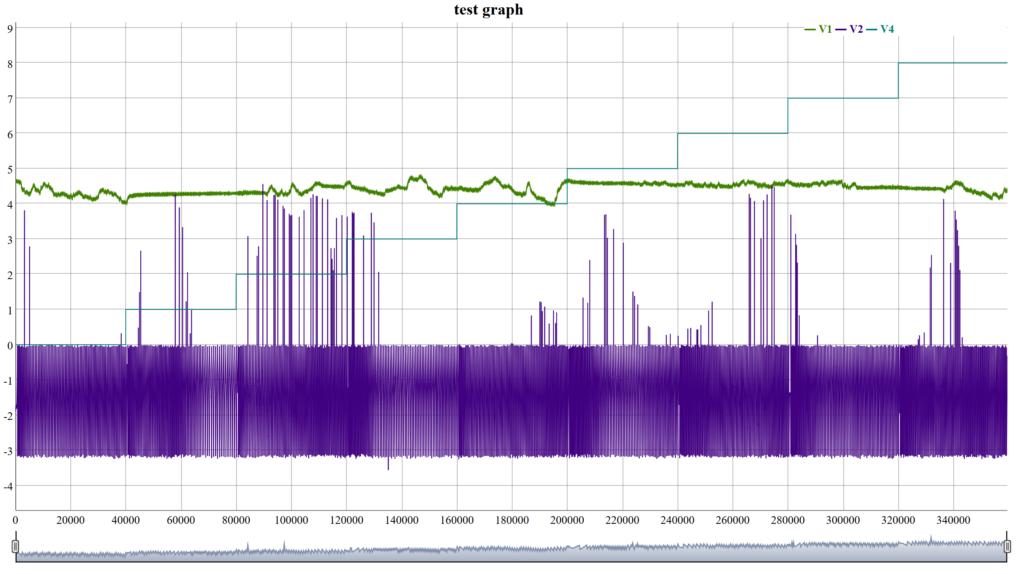
| Ex9 | no arena | 4.391139 | 4.363279 | -0.0278599 | 4.377209 |
| Ex9 | normal | 4.404213 | 4.456195 | 0.05198185 | 4.430204 |
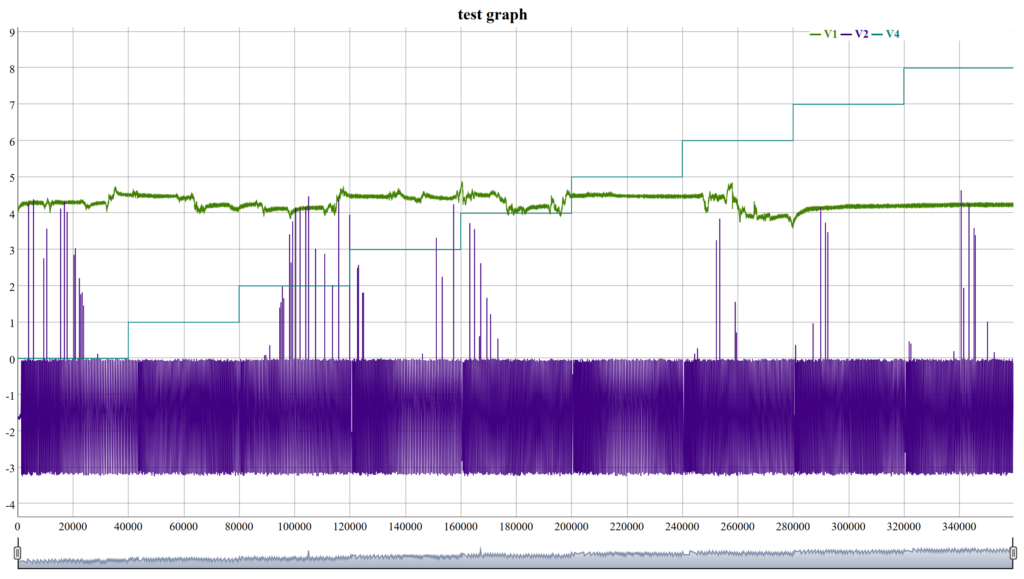
| Ex10 | no arena | 4.259827 | 4.195971 | -0.0638559 | 4.227899 |
| Ex10 | normal | 4.243121 | 4.360124 | 0.1170035 | 4.301622 |
Ex8:
Ex9:
Ex10:

Category: Uncategorized
Leave a Reply