The T-Maze experiments : Middle analysis and Correlation plot
on Saturday, July 14th, 2018 12:06 | by Naman Agrawal
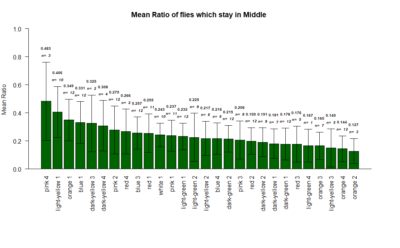
The mean ratio of the flies that stay in the middle during the experiments.
Correlation plot between the mean ratio of the flies that stay in the middle versus the Weighted PIs
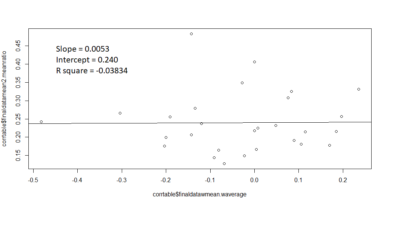
Slope = 0.0053
Intercept = 0.240
R square value = -0.03834
contrary to the expectations, there seems to be no correlation .

Category: lab.brembs.net, neuronal activation, operant self-learning, Optogenetics, R code
Leave a Reply