Mean trace of all flies and how degrees of freedom vary over learning
on Monday, July 23rd, 2018 6:40 | by Christian Rohrsen
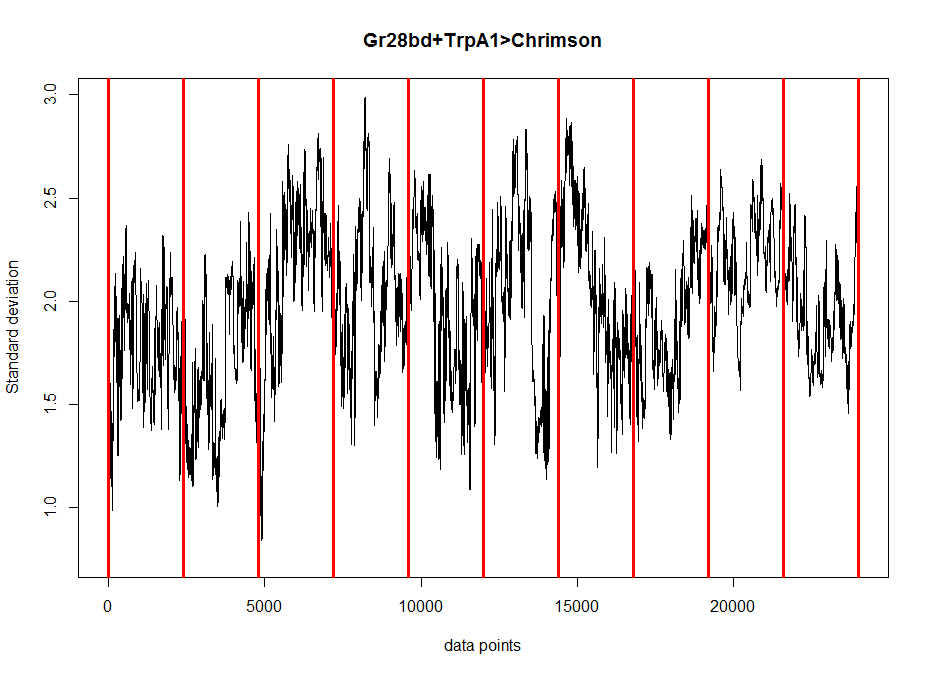
Mean trace of the positive control in the Joystick to get to see what are the overall dynamics and maybe to get an idea what might be the best score to pick.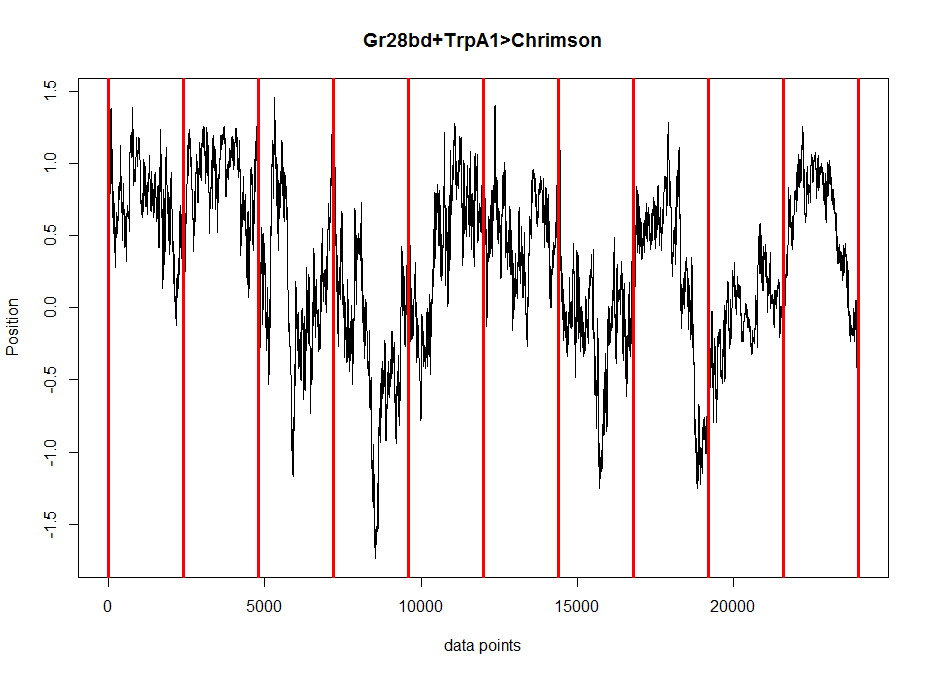 Here the standard deviation of the flies along the time axis. This is just to see if all the flies have more similar phenotypes with each other or not at each time.
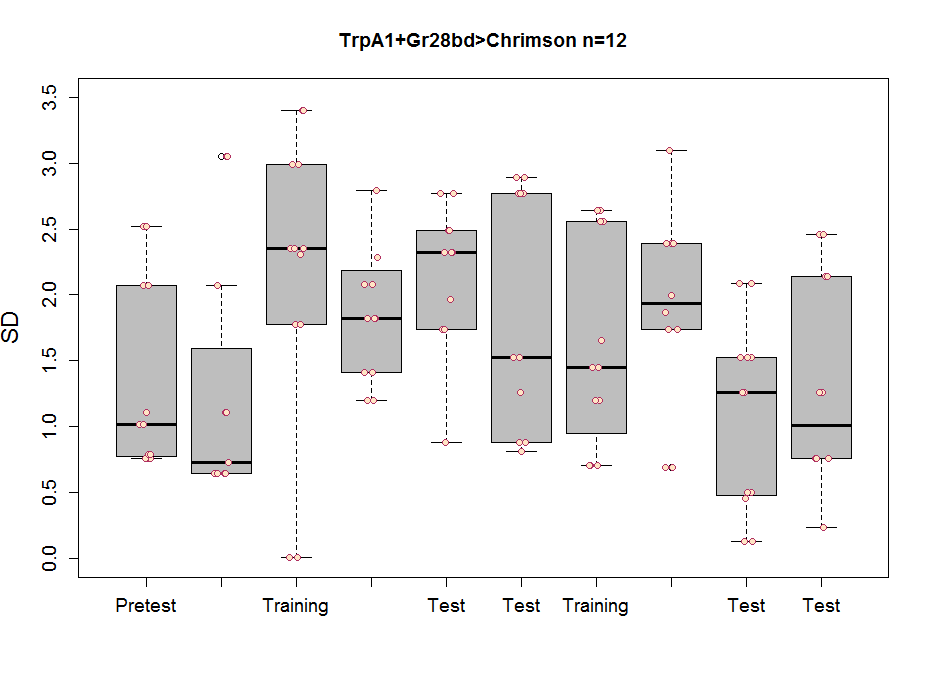
This is to see if the flies have less degrees of freedom at any segment by measuring the standard deviation at each segment. There does not seem to be any effect. Although this might be mixed with the wiggle scores. I think measuring entropy is a better measure.
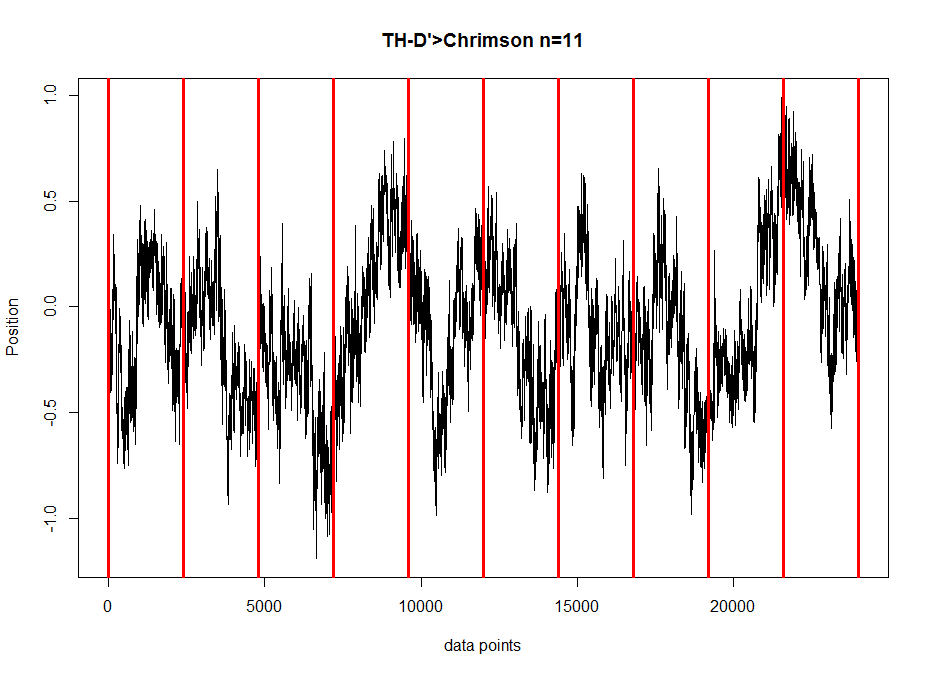
All the same plots as above but for TH-D’, the interesting line from the screen.
Standard deviation across flies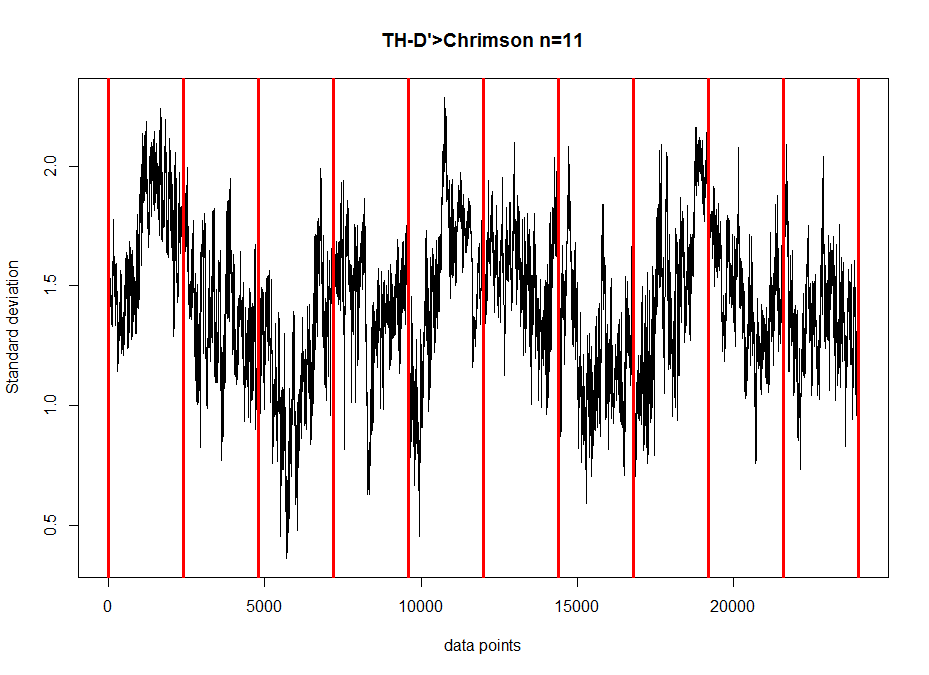
Standard deviation across segments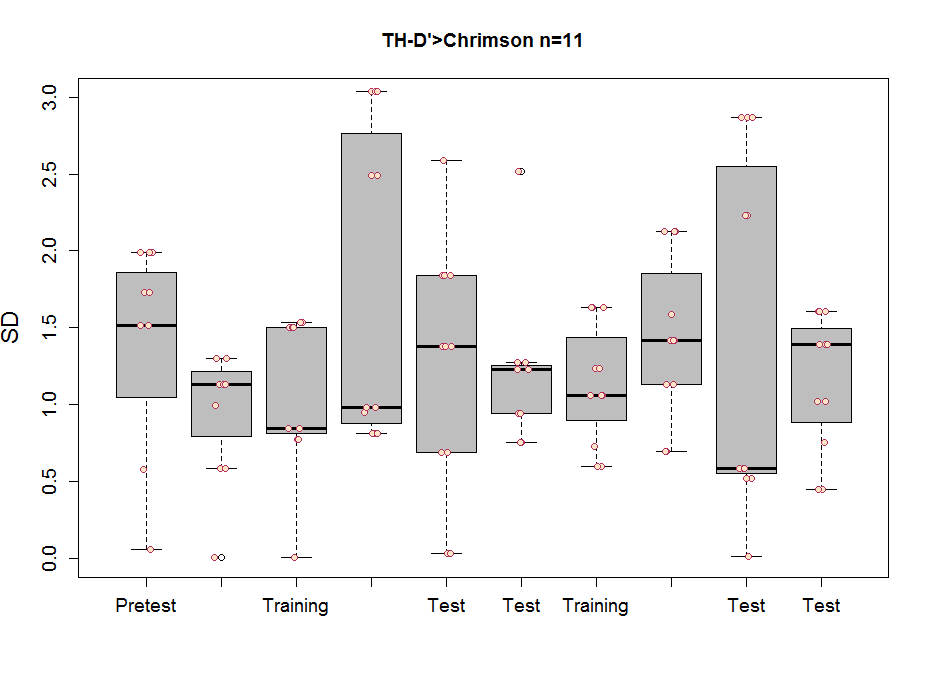

Category: neuronal activation, Operant reinforcment, operant self-learning, Optogenetics
Leave a Reply