Tmaze experiments initial results
on Monday, June 4th, 2018 2:16 | by Naman Agrawal
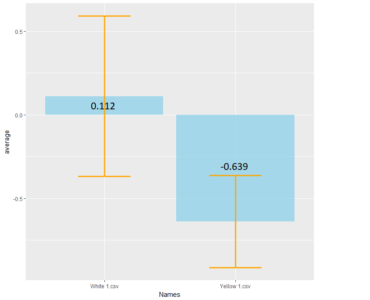
 the first graph shows Bar plot of Mean and standard deviation of PIs for Genetic control (n=9) and Positive control (n=5).
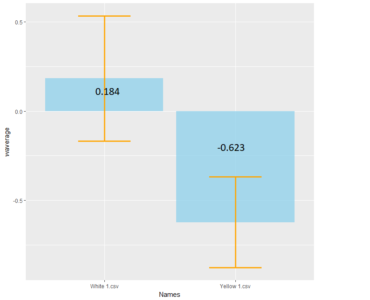
The second graph shows weighted mean and weighted standard deviation of the same.
Weighted mean is calculated by multiplying the weights (total number of flies in that experiment/total number of flies in all the experiments) with the PI for that experiment, and taking the sum thereafter for all the experiments.

Category: neuronal activation, operant self-learning, Optogenetics, TrpA
Leave a Reply