First tests of fly prediction under a mean of the flies on single data points
on Monday, February 8th, 2016 12:11 | by Christian Rohrsen
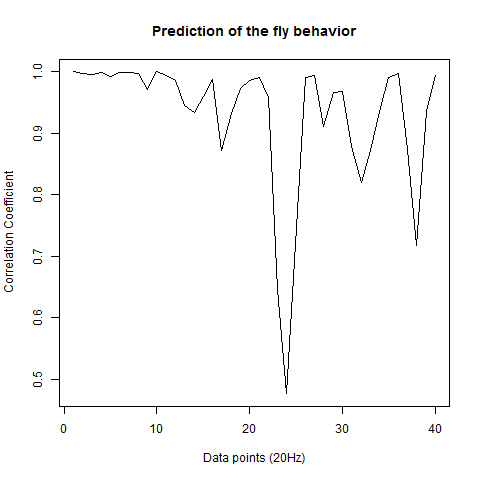
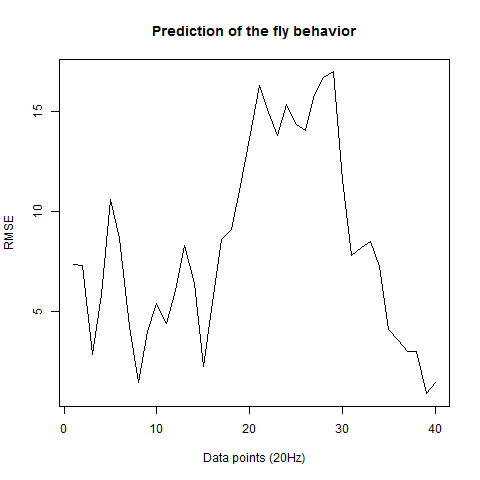
These were done the week before last one but I could not upload it last time, so here are they. These are the results for predicting 4-5 flies of each group. Just one prediction from the middle of the time series for the 40 data points ahead in the future. First group is c105;;c232>TNT.
This is c105;;c232 x WTB
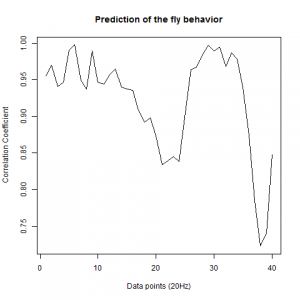
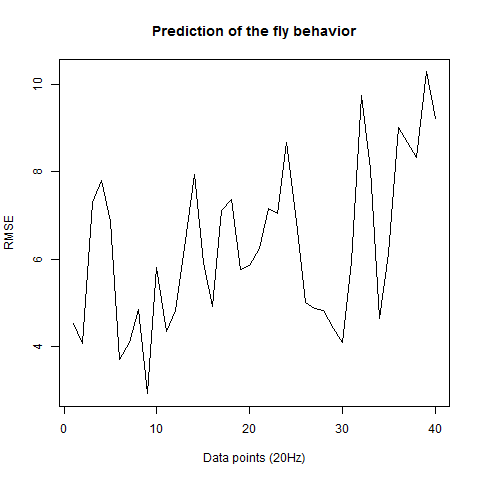
This is UAS-TNT x WTB 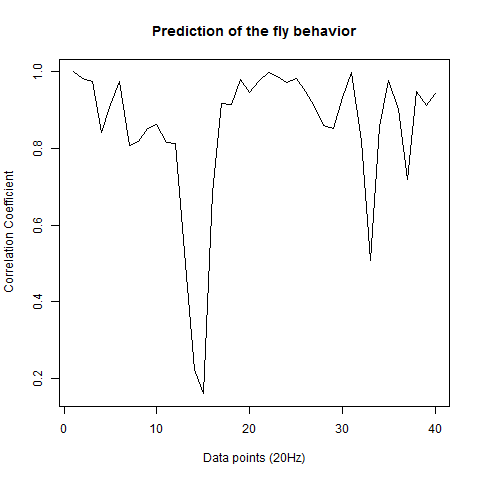
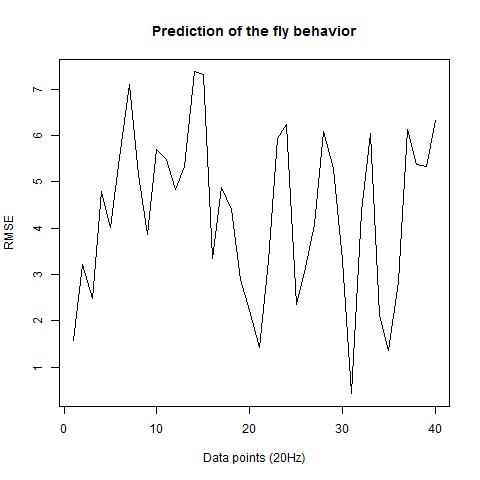
As I saw that the graph had so much zig-zag I told Pablo to make a bigger number of tested flies and this is what he is presenting today.
In addition I did analyze other parameters which are all saved under a PDF file below (Strokelitude). This contains some parameters with doubtfull processing which I still don´t trust so I have to find a better way for the calculation of it.

Category: R code, Spontaneous Behavior, strokelitude
Leave a Reply