Fly behavior prediction in the platform
on Monday, February 15th, 2016 2:25 | by Christian Rohrsen
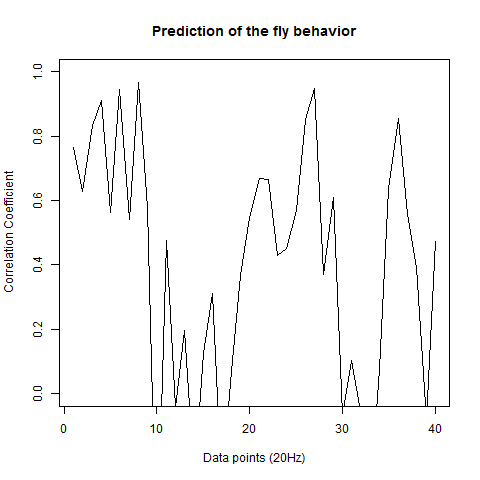
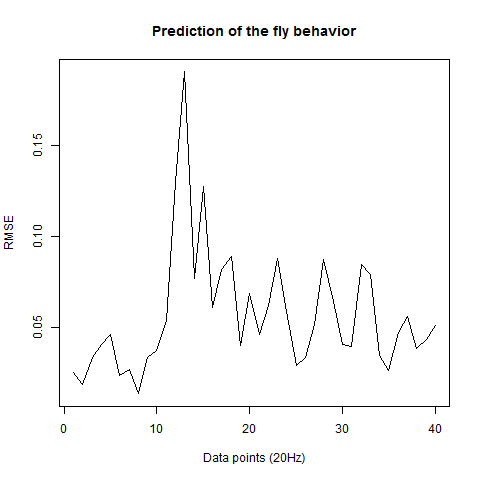
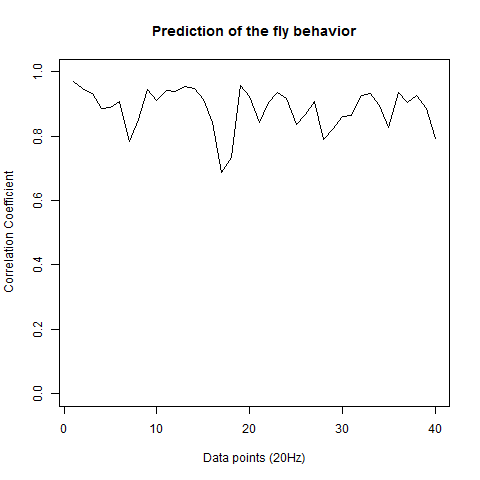
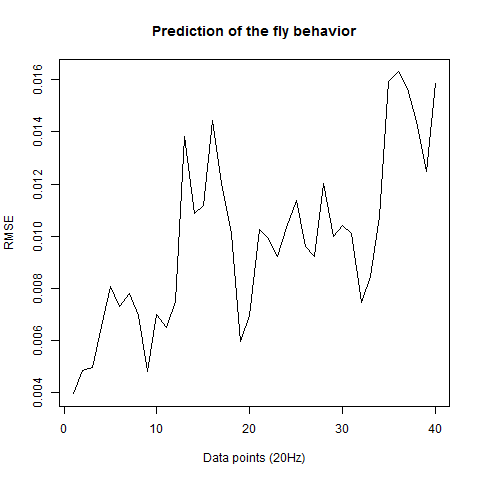
This is the prediction analysis of flies in the platform under a 20min experiment under dark conditions. The number of experiments change drastically among groups because of technical problems: WTBxTNT is 4, WTBxc105;;c232 is 22, for the experimental line is 6 (c105;;c232>TNT), for the platform without flies is 10. I show the root mean squares and the correlation coefficient for each group.
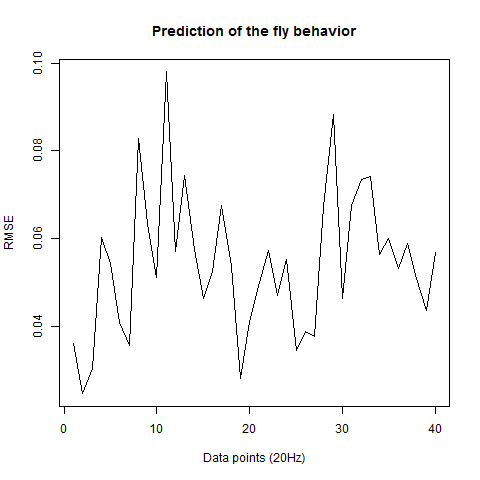
This is the experimental group: c105;;c232>TNT.
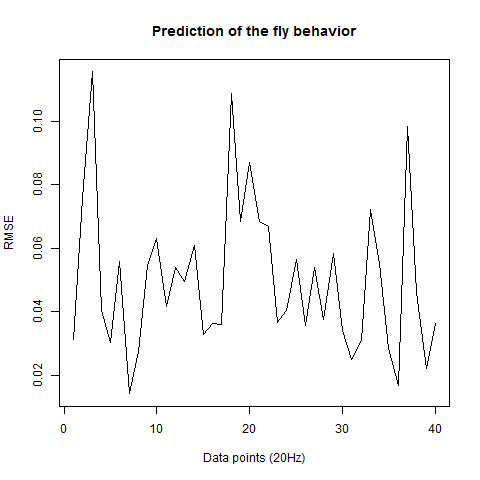
The group without flies on the platform. I expect here to get a very good predictability overall:
WTBxc105;;c232 group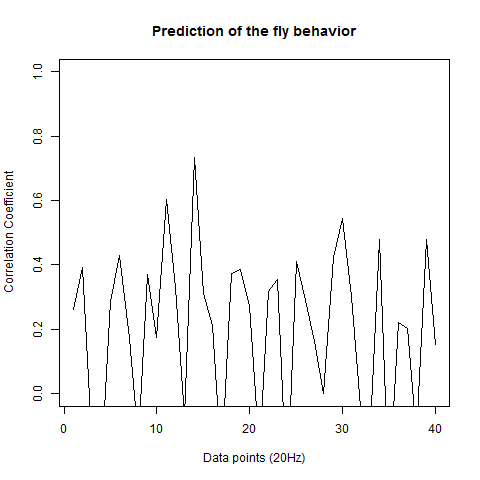
 WTBxUAS-TNT
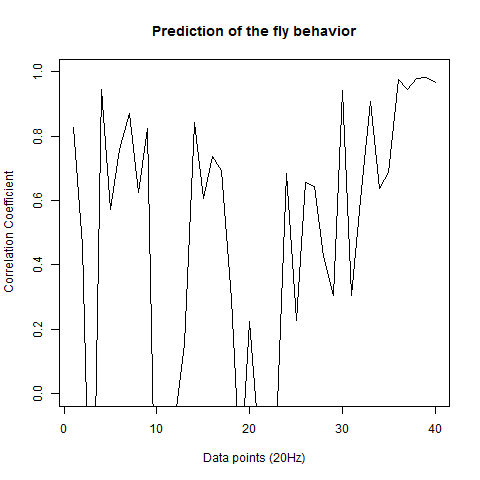

Category: R code, Spontaneous Behavior, strokelitude
Leave a Reply