Data analysis of the prediction of wingstroke amplitude with 40 datapoints.
on Monday, February 8th, 2016 11:38 | by Pablo Martinez
After we got the data of the behavior of the fly with strokelitude, we have made the analysis of 40 datapoints. Those datapoints were randomly picked in the middle of our dataset (10 minutes) and we made a second prediction, taking the points just before the end of the flight. For that we made a double correlation with those two predictions for each line and those are the results:
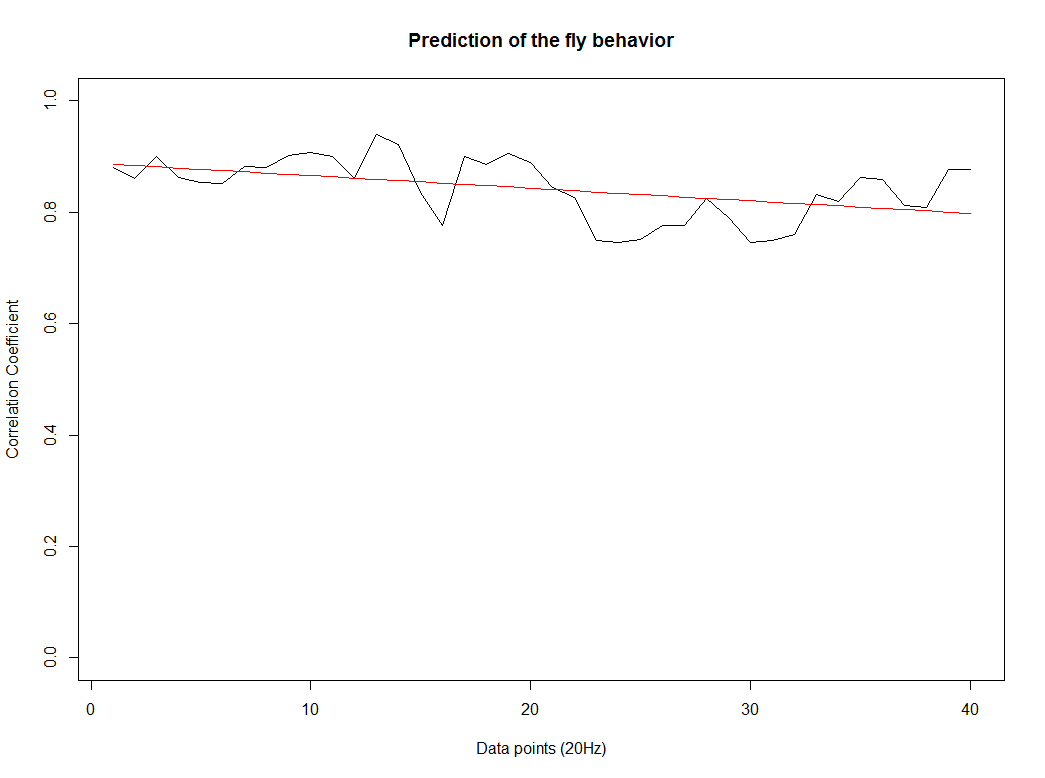
For the two control lines,
WTB x C105;;C232
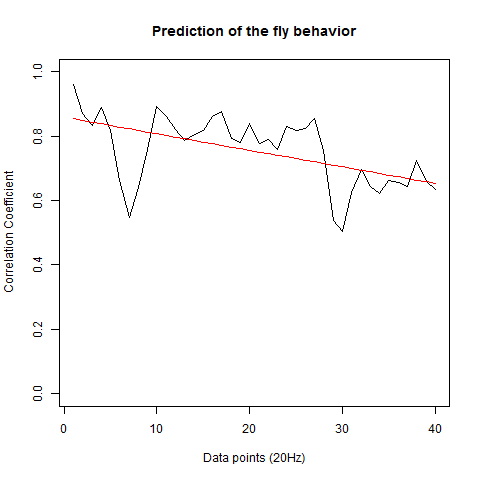
UAS-TNT-E x WTB
And for the experimental line (UAS-TNT-E x C105;;C232)
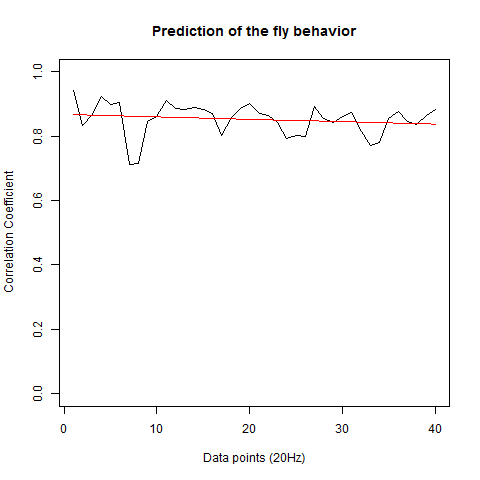
As long as the linear regresion decreases, more impredictable is the fly so its behave like non-linear function. The two controls are suposed to be more impredictable than the control line. There is more decrease in those two lines comparing to the experimental line, although is not too remarkable.
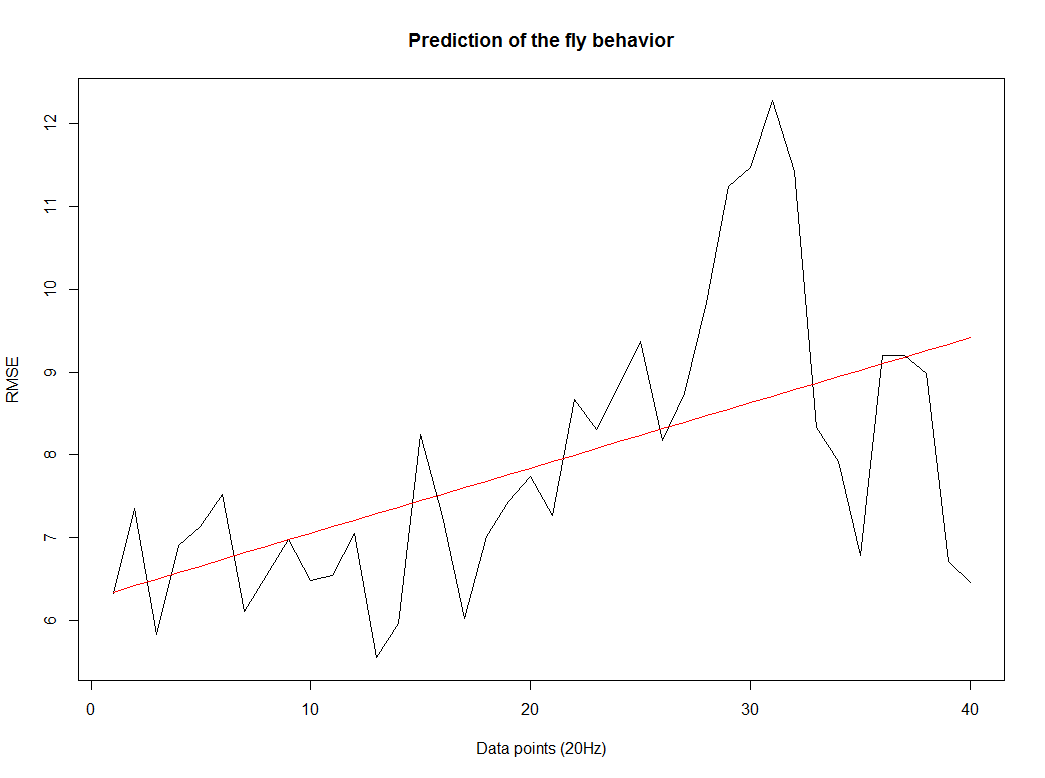
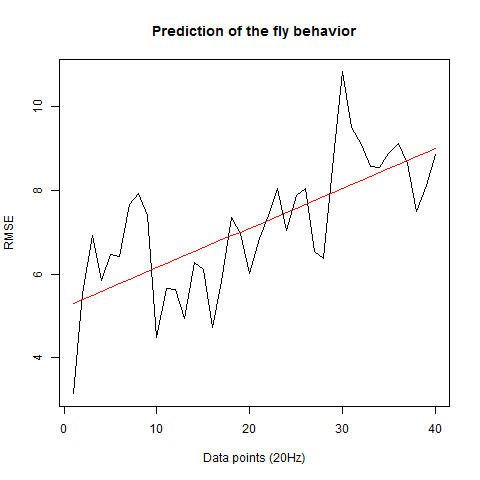
We also made an RMSE analysis, Christian explained it in his post. “RMSE measures just the differences of the absolute points whereas correlation coefficient is rather if the direction and degree of variation correlates (covariates)”
Here we have the plots:
WTB x C105;;C232(control)
UAS-TNT-E x WTB(control)
experimental line (UAS-TNT-E x C105;;C232)
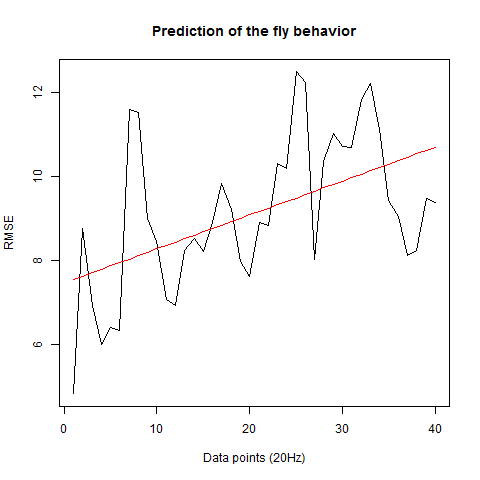
As long as the linear regresion increases, the absolute points differ from the prediction and the normal trace.

Category: Spontaneous Behavior, strokelitude, Uncategorized
Leave a Reply