Prediction analysis
on Sunday, January 17th, 2016 7:02 | by Christian Rohrsen
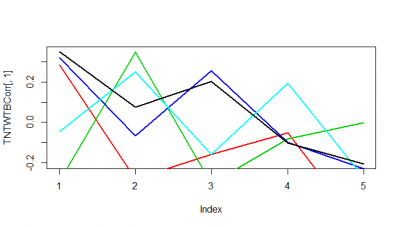
These are just 5 flies (WTBxTNT) from the strokelitude where I measured the correlation coefficient on the Y-axis. In the X-axis, first bin is from 0-2 s of prediction, second is 2-4s and so on.
It seems as if some flies do nicer than others. Although it seems to me that a correlation coefficient from 0.3 isnt a big thing with all this variability. I have to find out the best binning though, I think it needs to be much more in the short term.
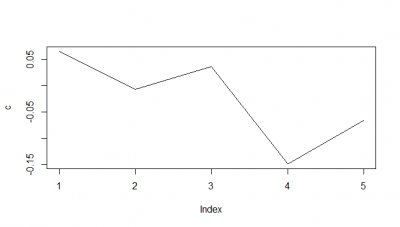
When I do the mean of the 5 flies measured, I do see a very slight decay. But once more I would say the decay is from the bin 1 to the second.
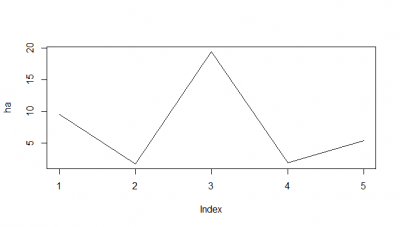
Here I tried another way, the RMSE, which according to literature and to my own reasoning should be a better analysis. I think RMSE measures just the differences of the absolute points whereas correlation coefficient is rather if the direction and degree of variation correlates (covariates). I find a very weird result. The fit is bad, the it gets better (but it should be just a chance event because correl coef decreases) and then it get very bad and so on.
I think for the future I have to make ensembles of two k neighbours maybe, which seem to increase the prediction power 10-15%. And maybe not look that much into the future as it was done here (10s).
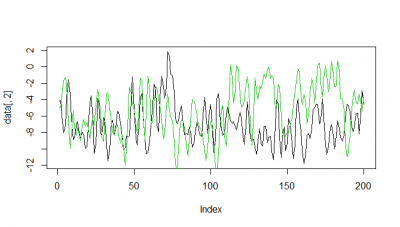
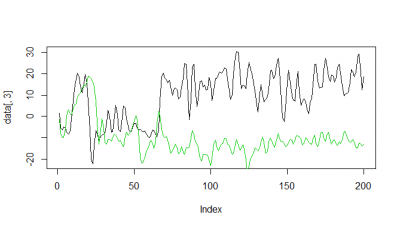
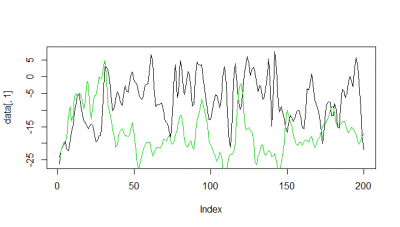
Here some examples of predictions vs observations:

Category: R code, Spontaneous Behavior, strokelitude, Uncategorized, WingStroke
[…] also made an RMSE analysis, Christian explained it in his post. “RMSE measures just the differences of the absolute points whereas correlation coefficient […]