Variability of Phototaxis 4: Buridan
on Friday, November 6th, 2015 1:56 | by Isabelle Steymans
In the previous experiment, where all the tubes were tested individually, we saw different distributions between this subgroups. Therefor I wanted to test the activity and in particular the speed of single flies of each of this subgroups, to see if this result could be explained by a difference of these parameters. For that I started doing first the Benzer-paradigm to split the flies. Then I took random flies of each of the 6 tubes, cut their wings under cold-anesthesia with 24 hours recovery and after that, tested them in the Buridan.
Below there are the transitionplots of all the different tubes tested (Fig.1-Fig.6). You can see that the flies of the different subgroups seem to have quite similar Transitionplots.
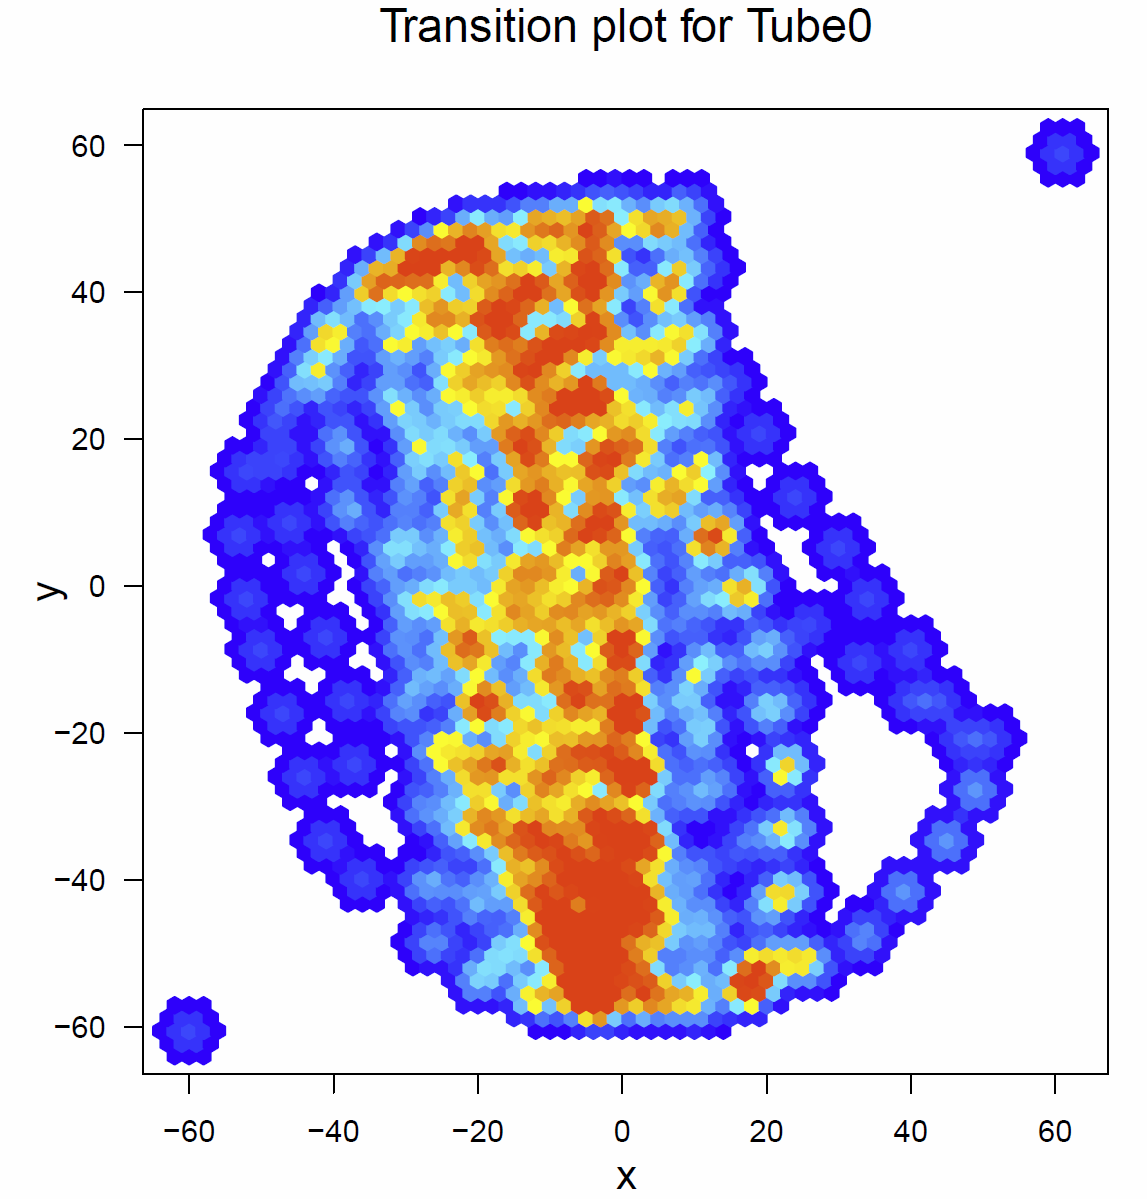
Fig.1 Transitionplot for tube 0
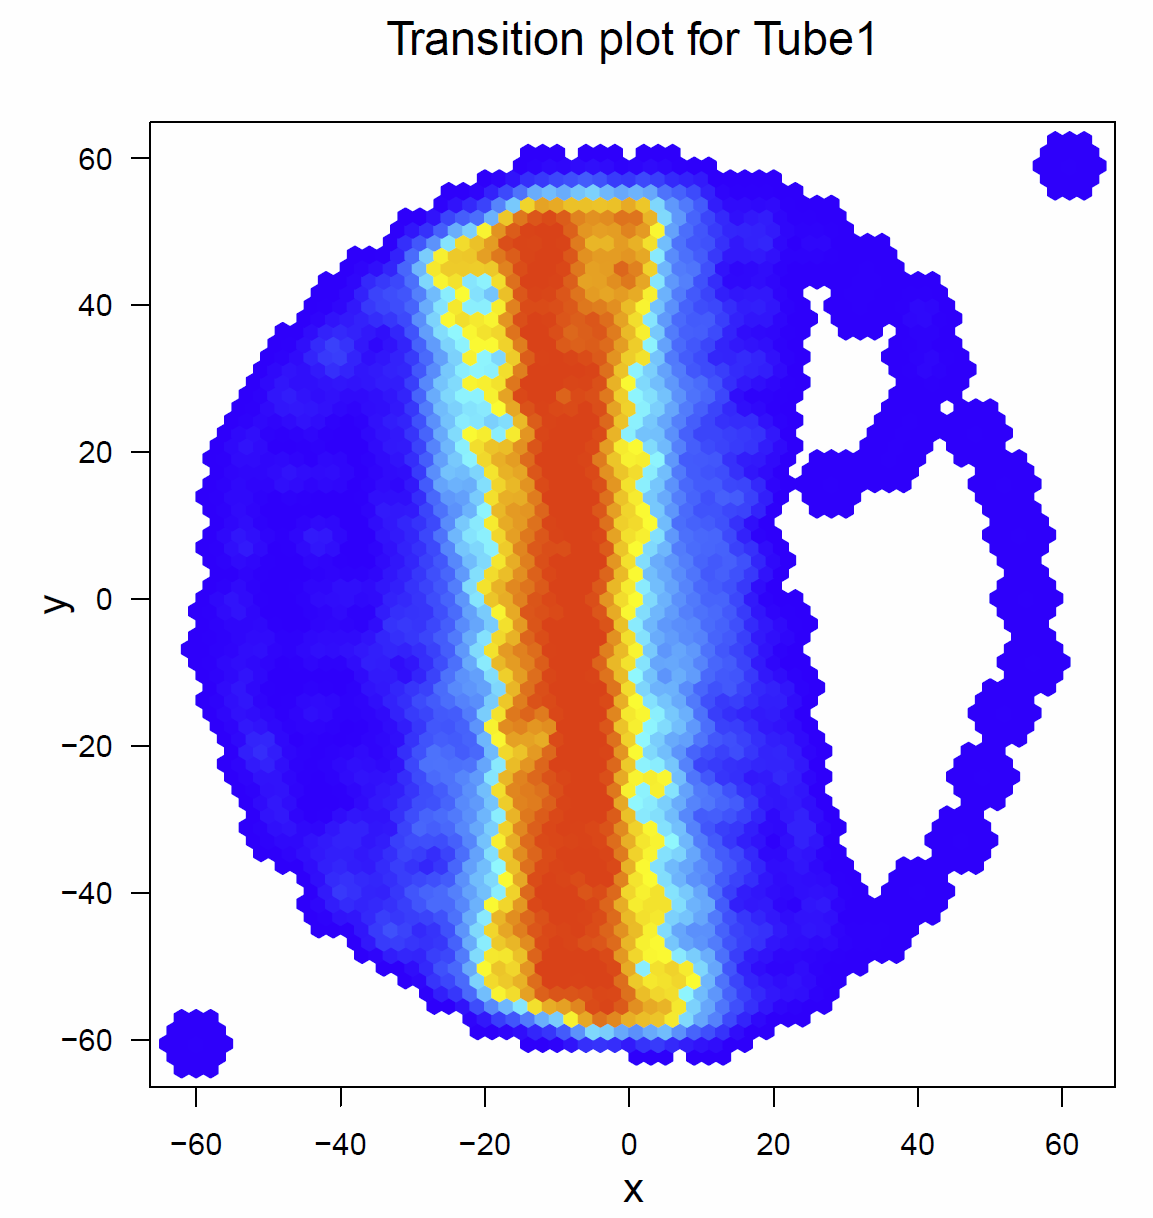
Fig. 2 Transitionplot for tube 1
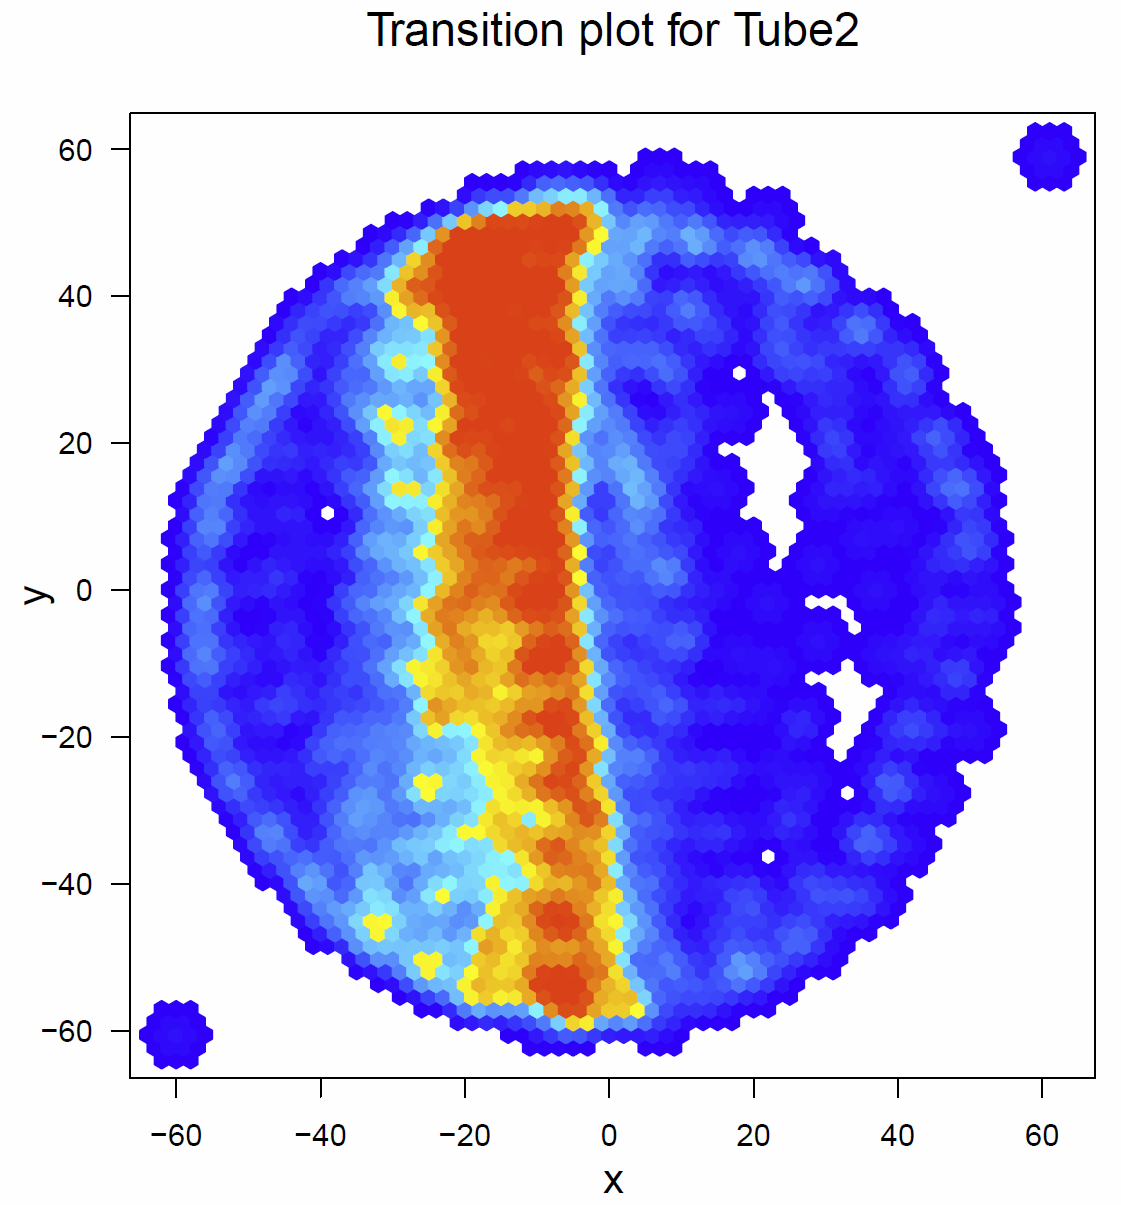
Fig. 3 Transitionplot for tube 2
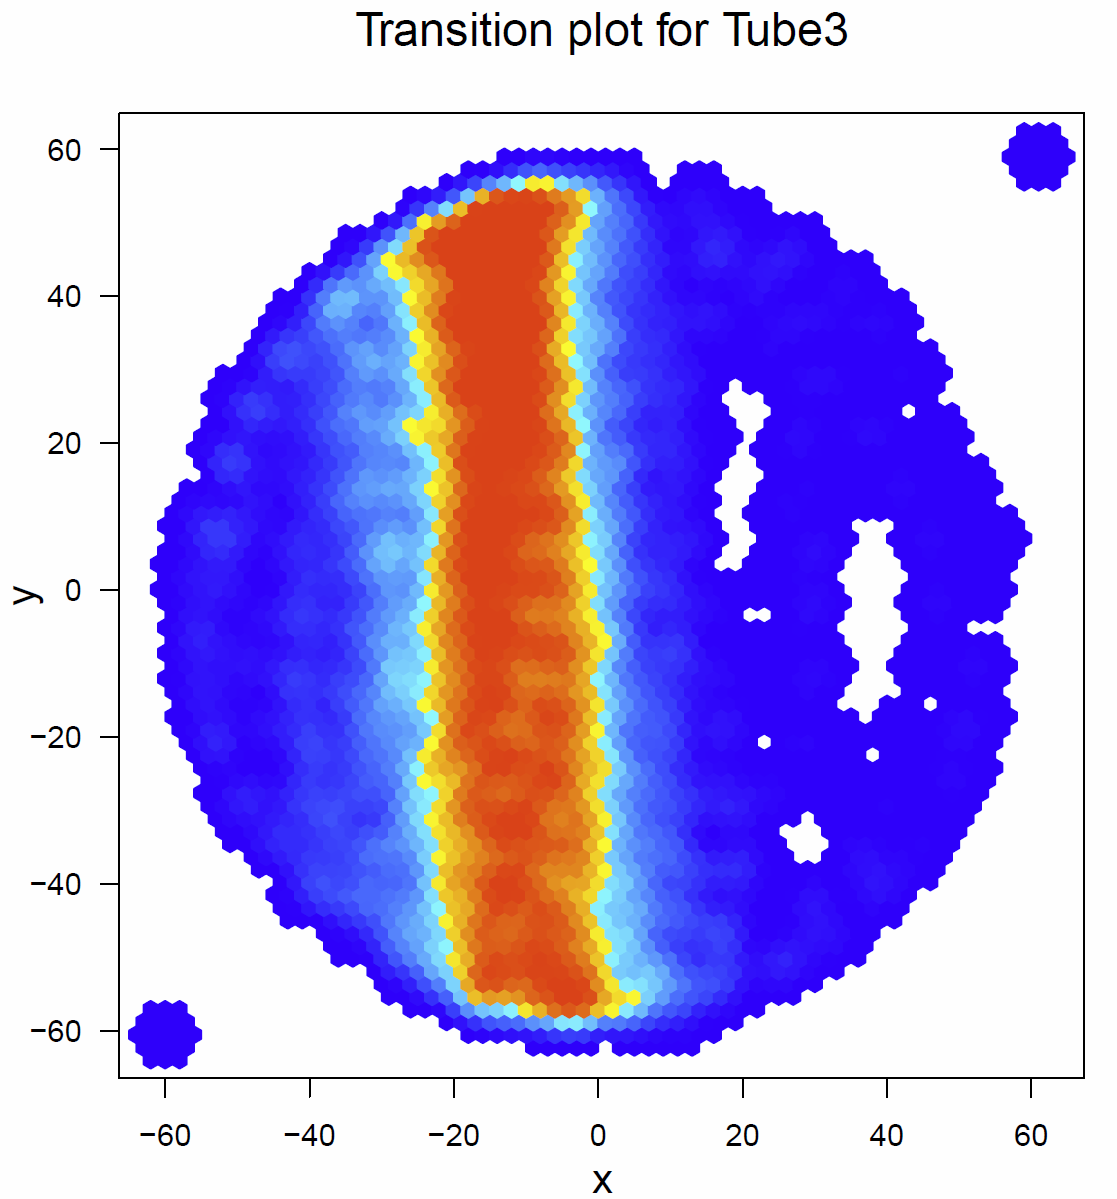
Fig. 4 Transitionplot for tube 3
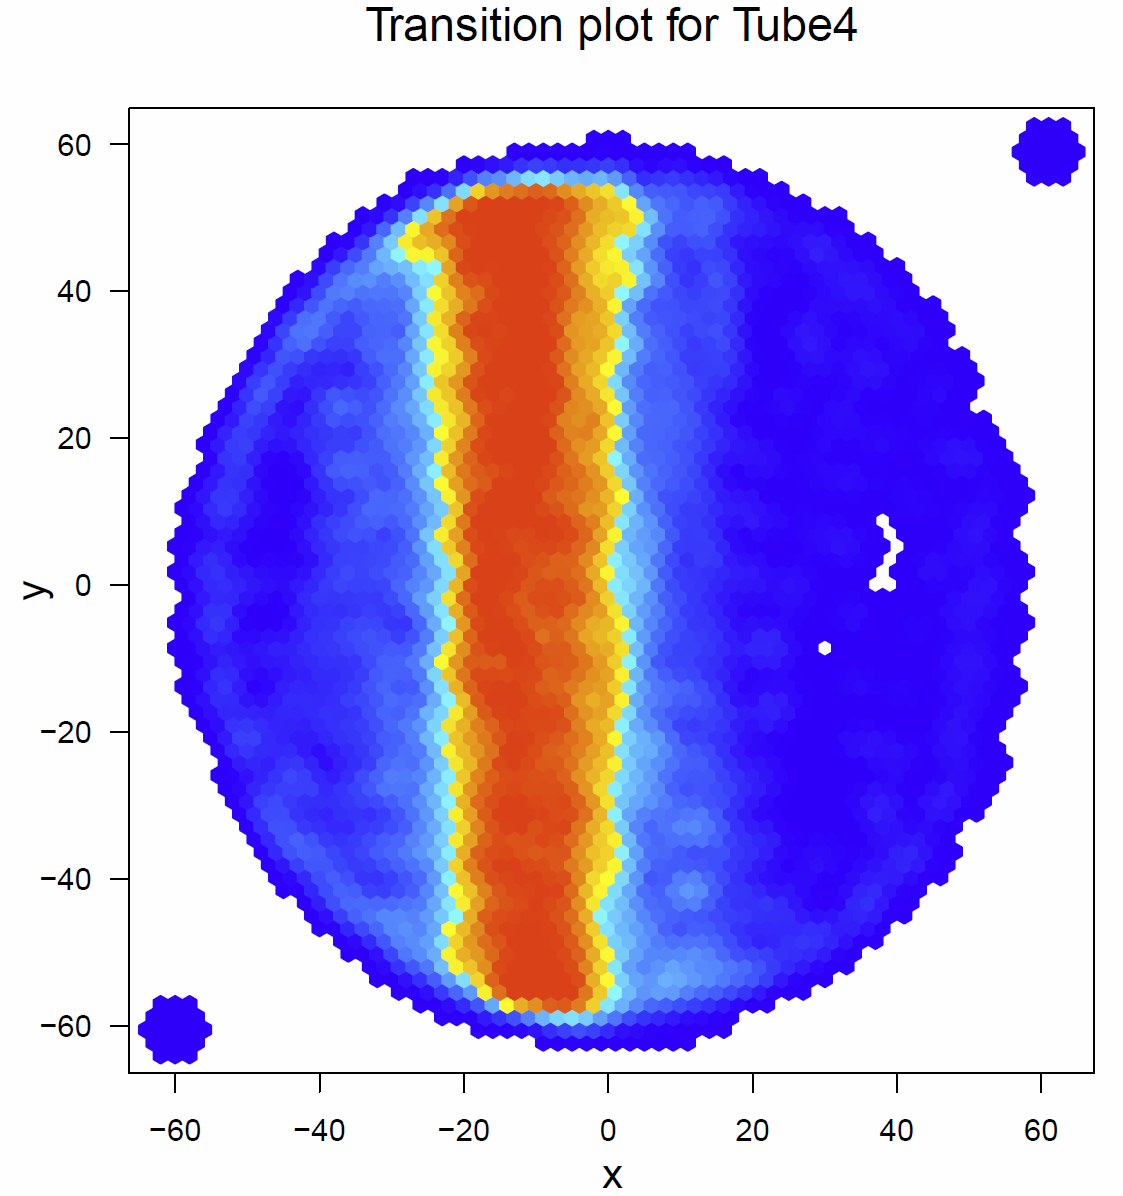
Fig. 5 Transitionplot for tube 4
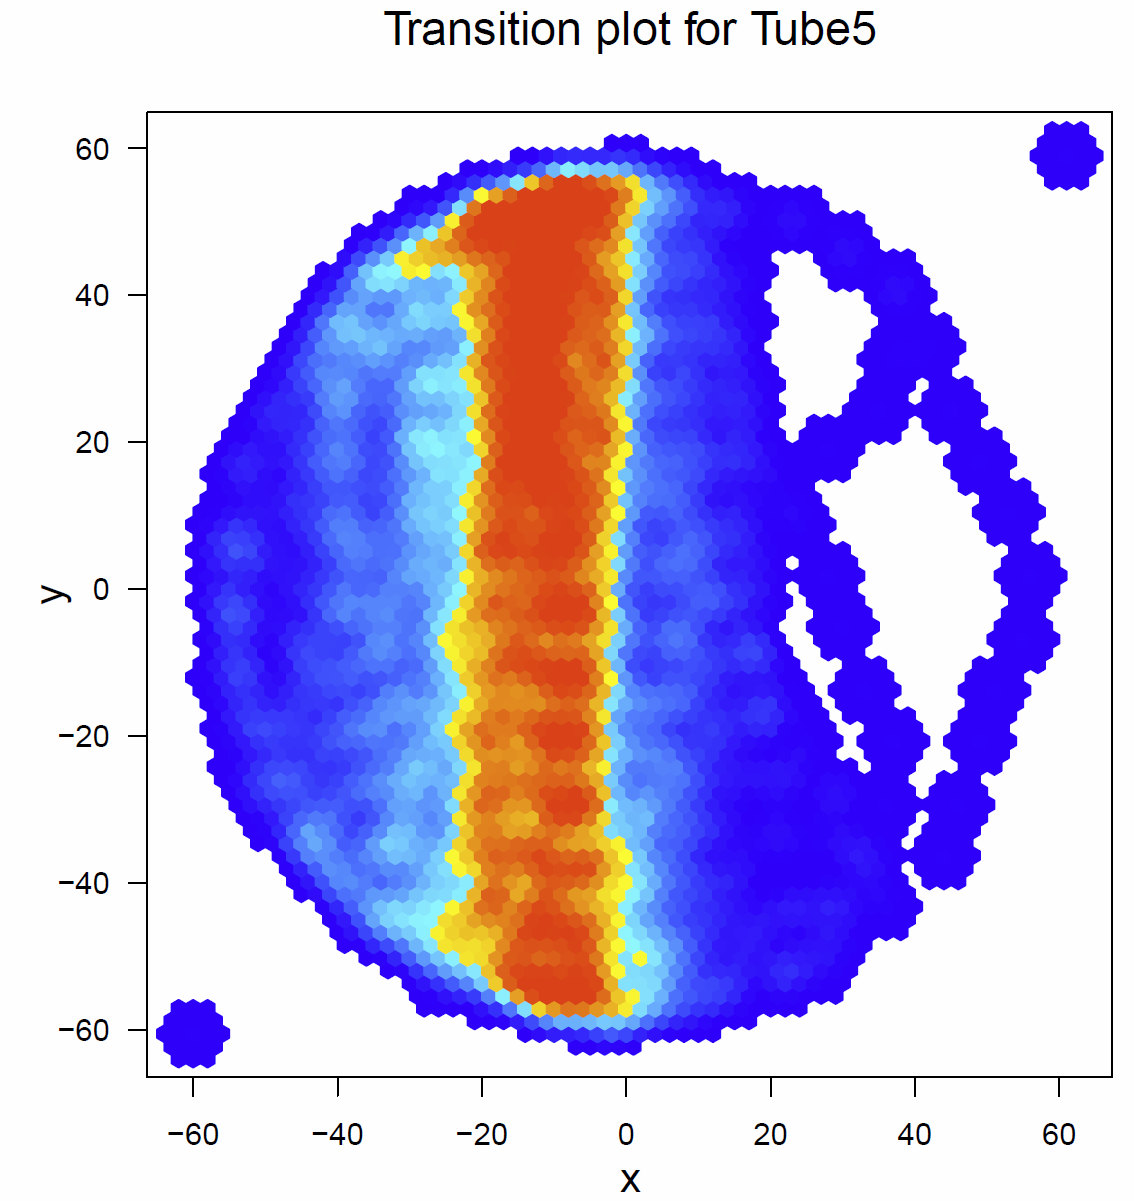
Fig. 6 Transitionplot for tube 5
In addition I had a look on the activitytime per minute (Fig.7+8), the distance traveled per minute (Fig.9), the pause duration and lengh (Fig.10+11), the number of pauses (Fig.12+13) and the median speed (Fig.14). All activity metrics were calculated in two different ways, the first computation (time-threshold: TT) considers every movement as activity and every absence of movement lasting longer than 1 s as a pause. The second approach (speed threshold: ST) uses the distance traveled by the fly in a sliding window of 1 second duration, measuring its mean velocity during that second.
The activitytime of the flies of the tubes 1, 2,3 and 5 is very similar, however in the tubes 0 and 4 it seems to be more elevated. (Fig. 7+8) If we compare these results to the traveled distance (Fig. 9) we see that tubes 4 shows a higher distance as well, tube 0, in this case, is more similar to the tubes 1, 2,3 and 5. For the flies of tube 4 this can be explained by the pause duration and the number of pauses per minute (Fig. 10+12+12) because they show less pauses per minute and a slightly reduced duration of this pauses. In addition we see that the median speed (Fig.14) is lower in the flies of the tube 0, the rest of the tubes are quite similar.
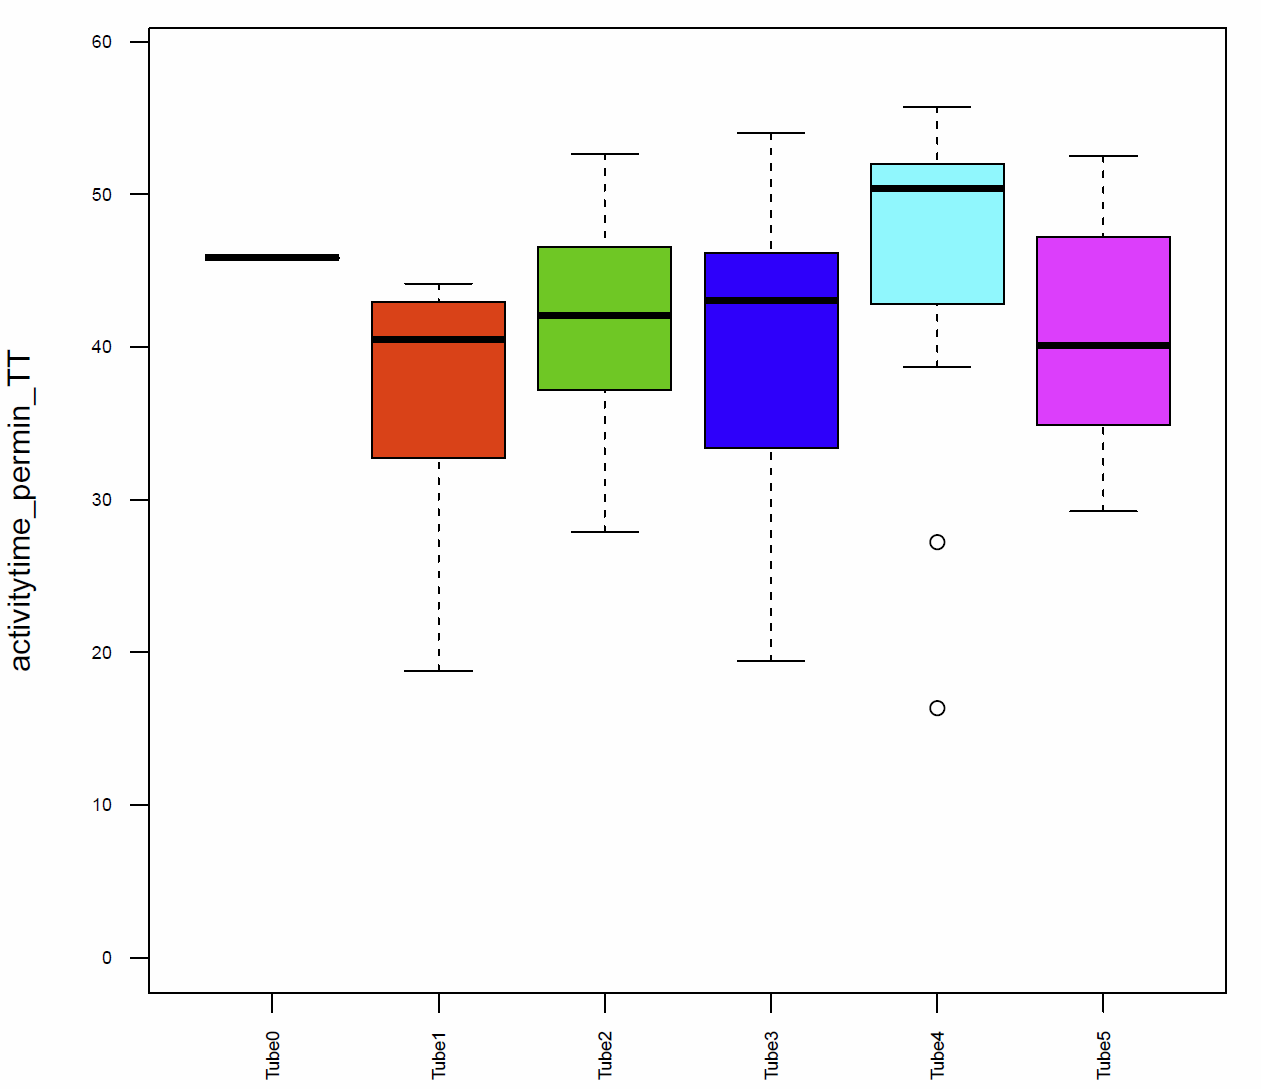
Fig. 7 Activitytime per min TT
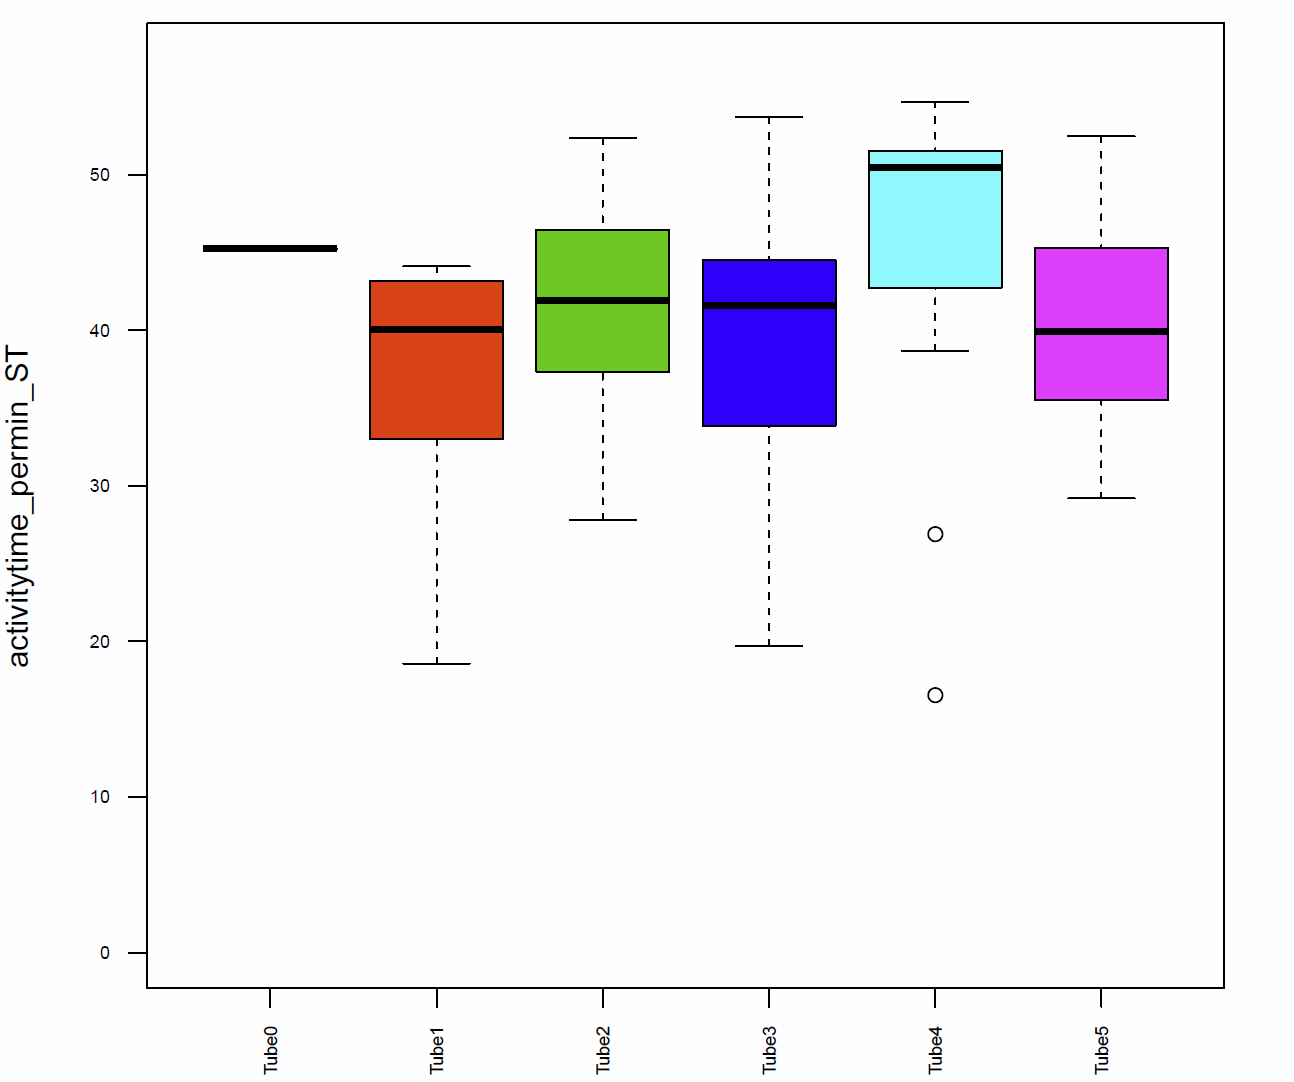
Fig. 8 Activitytime per min ST
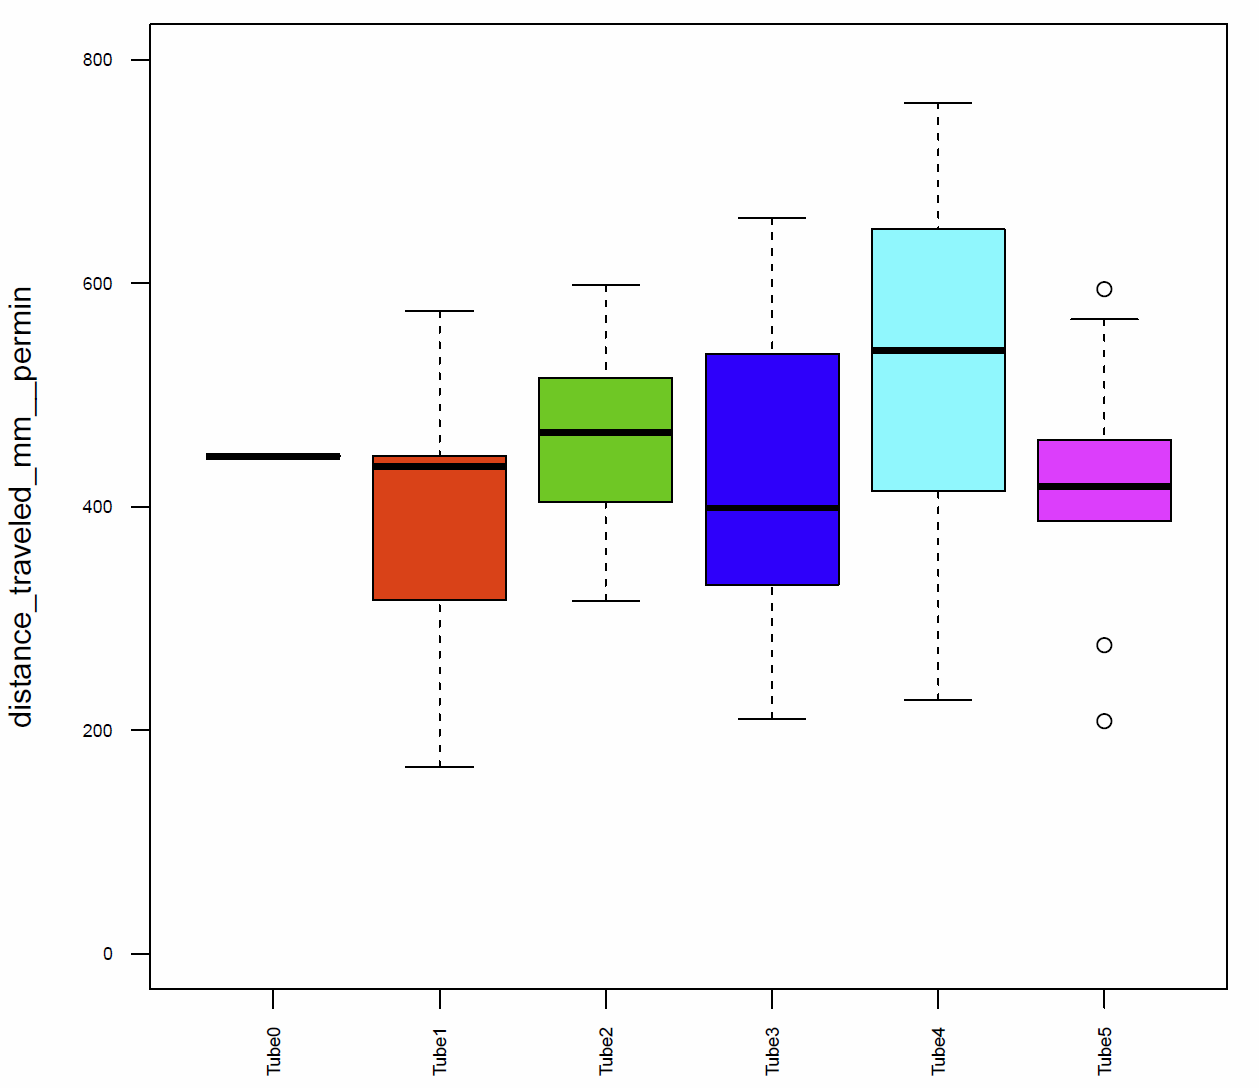
Fig. 9 distance traveled per min
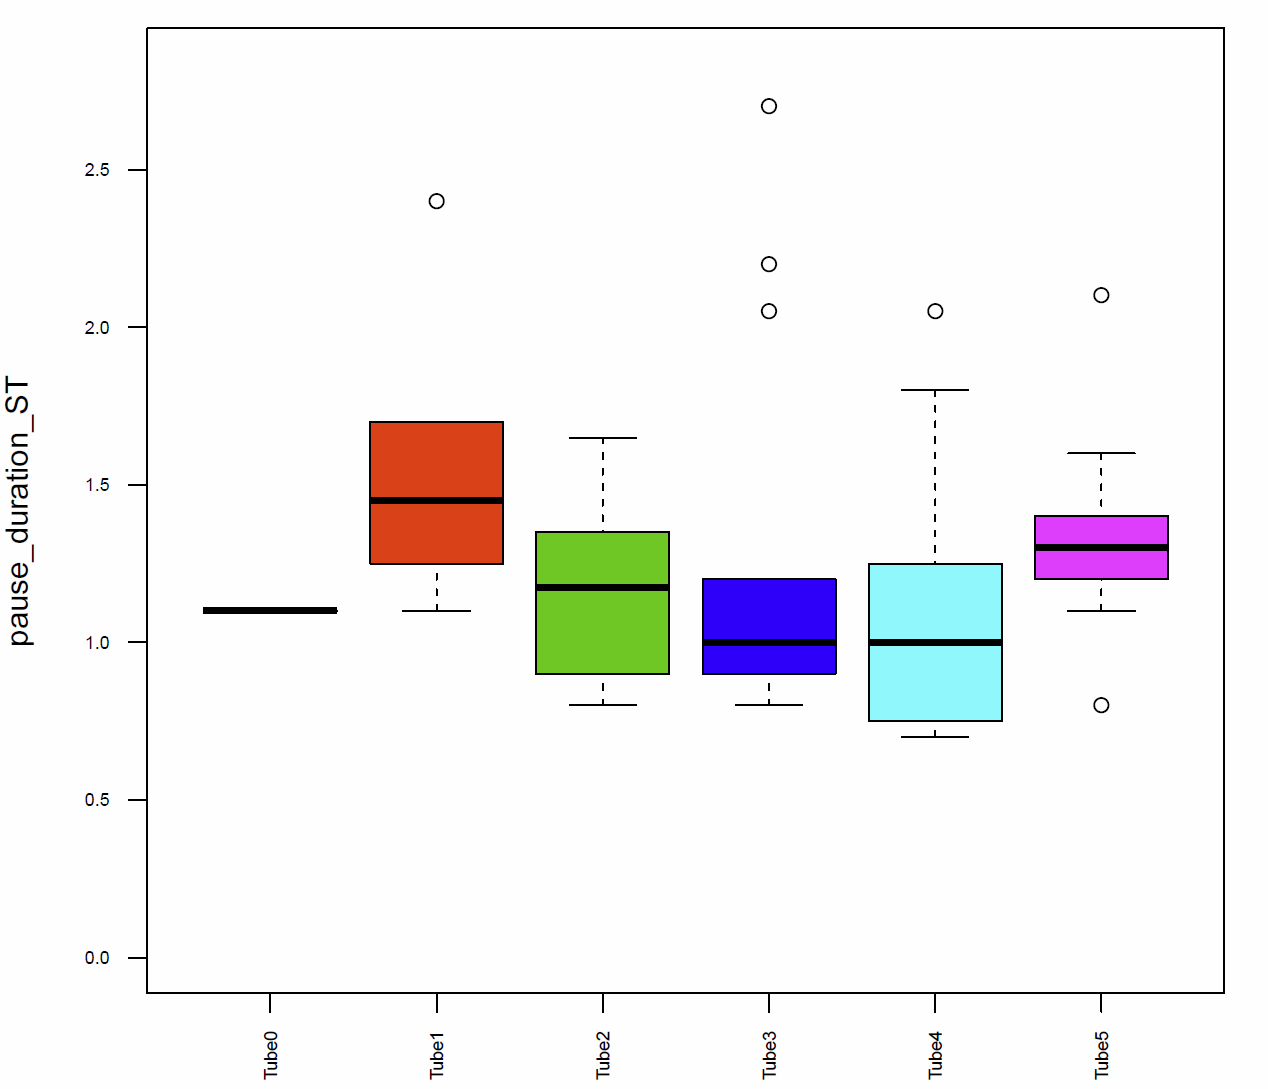
Fig. 10 pause duration ST
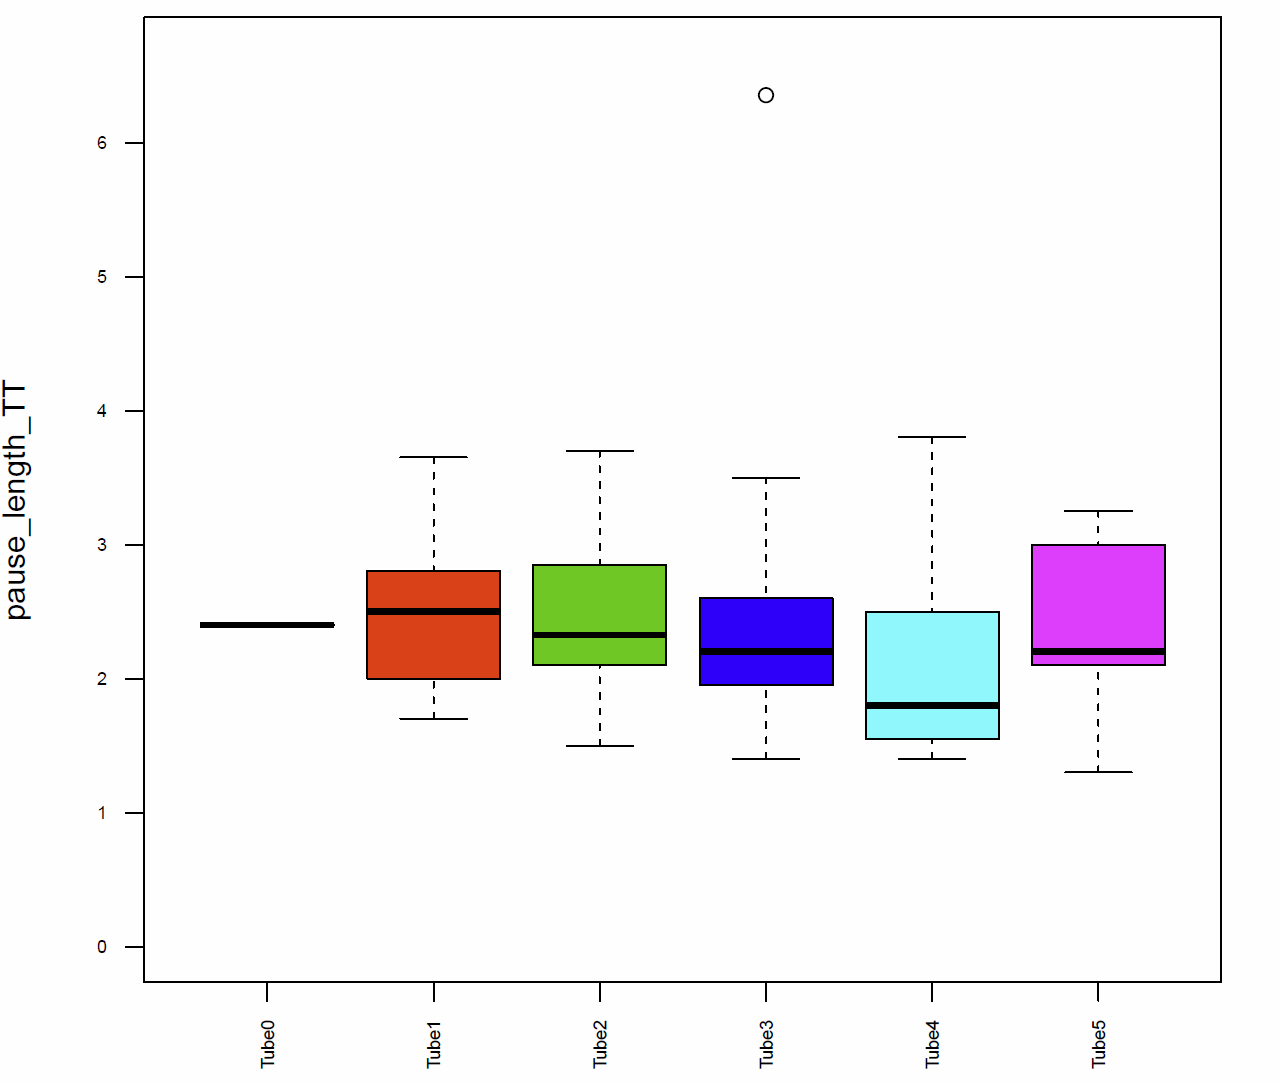
Fig. 11 Pause lengh TT
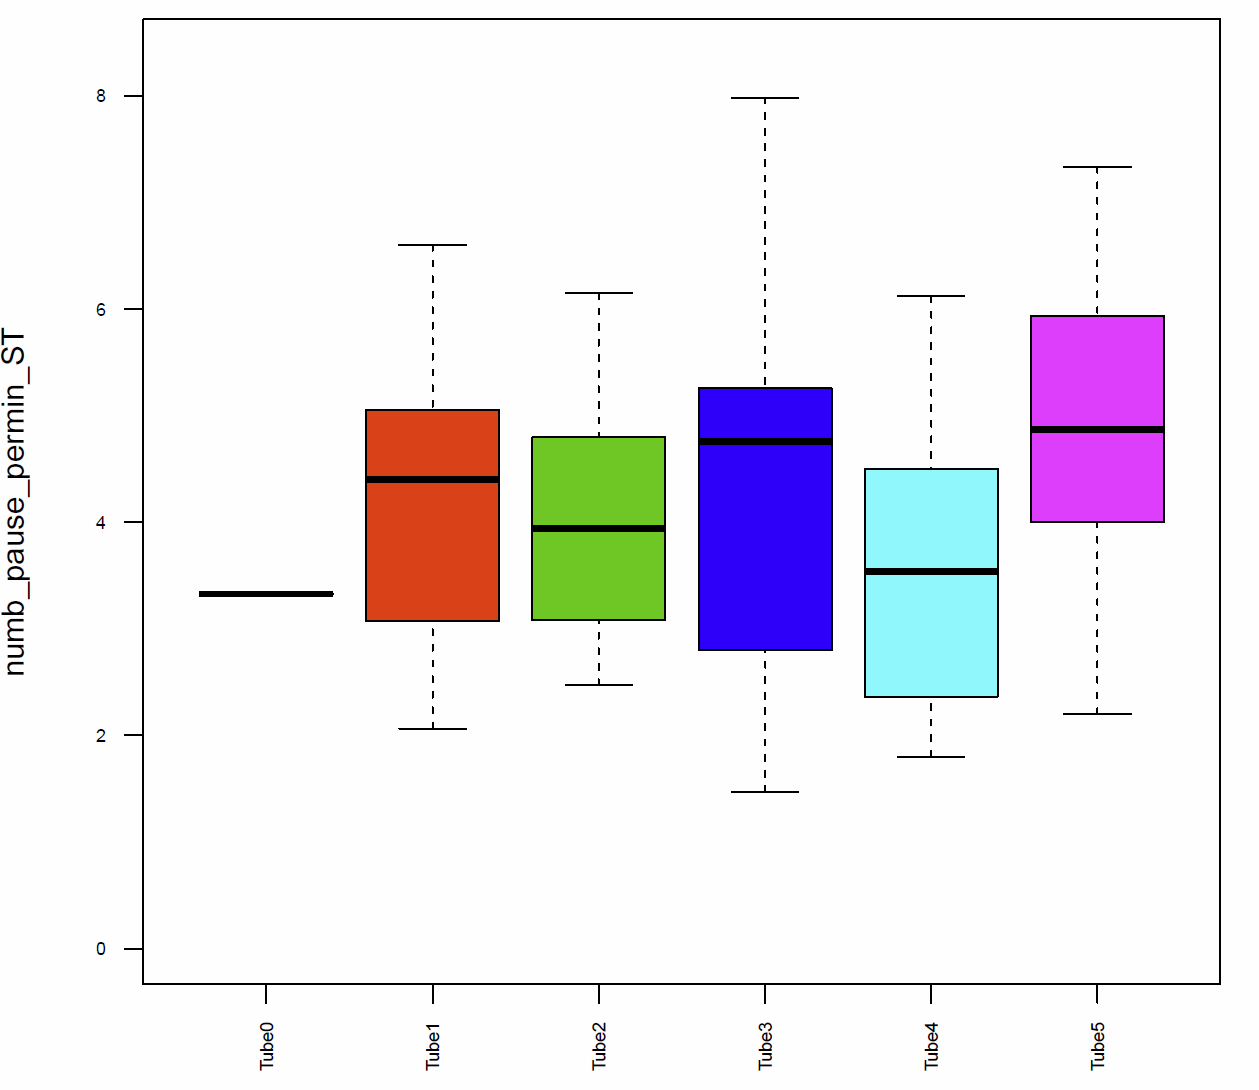
Fig. 12 number of pauses per min ST
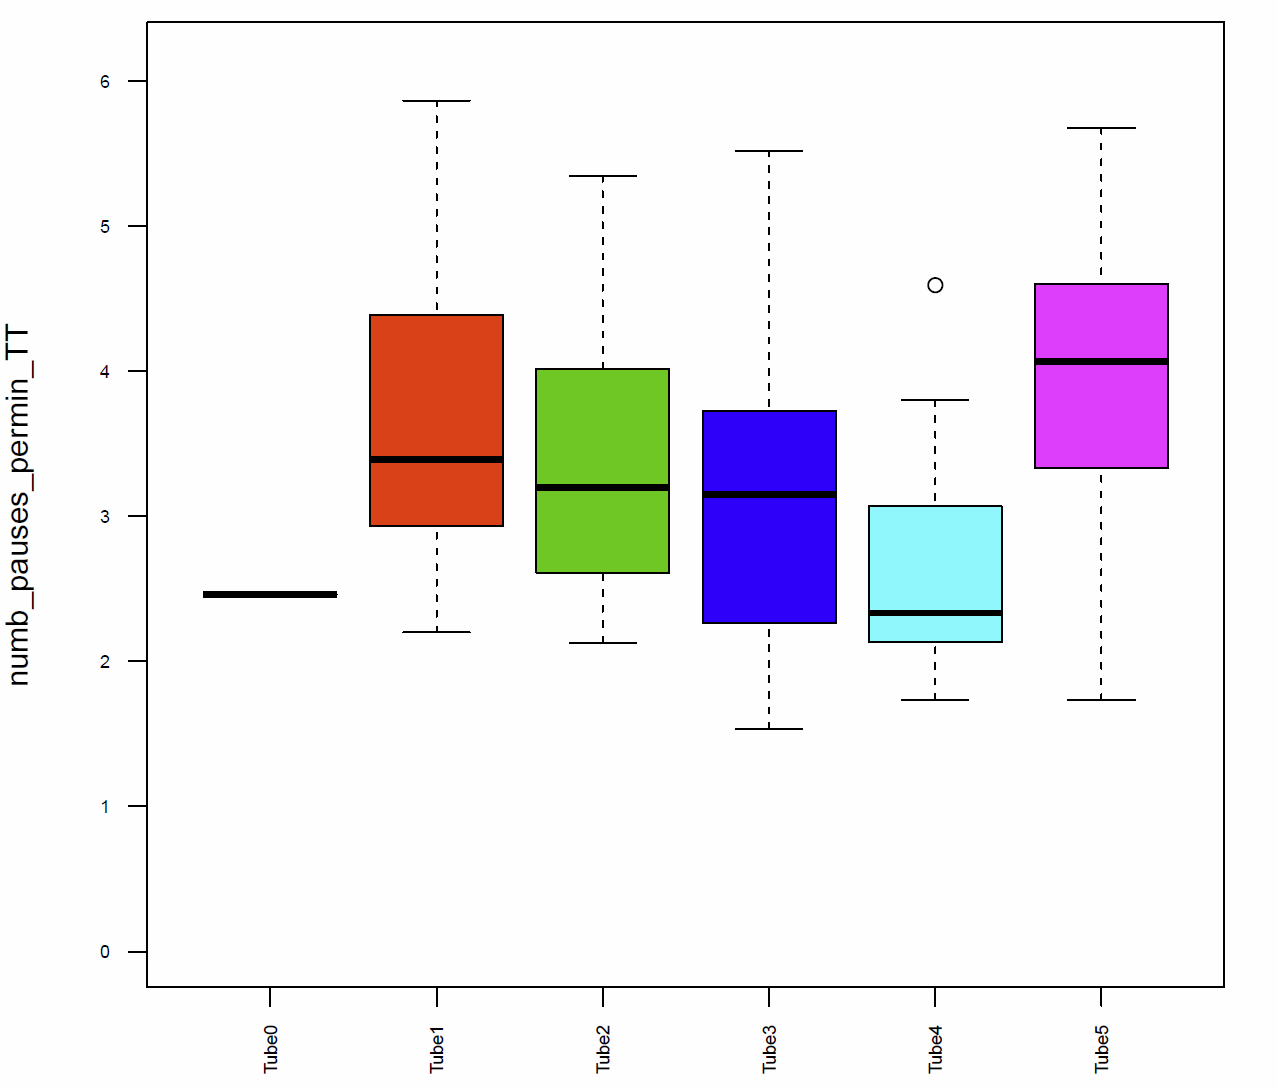
Fig. 13 number of pauses per min TT
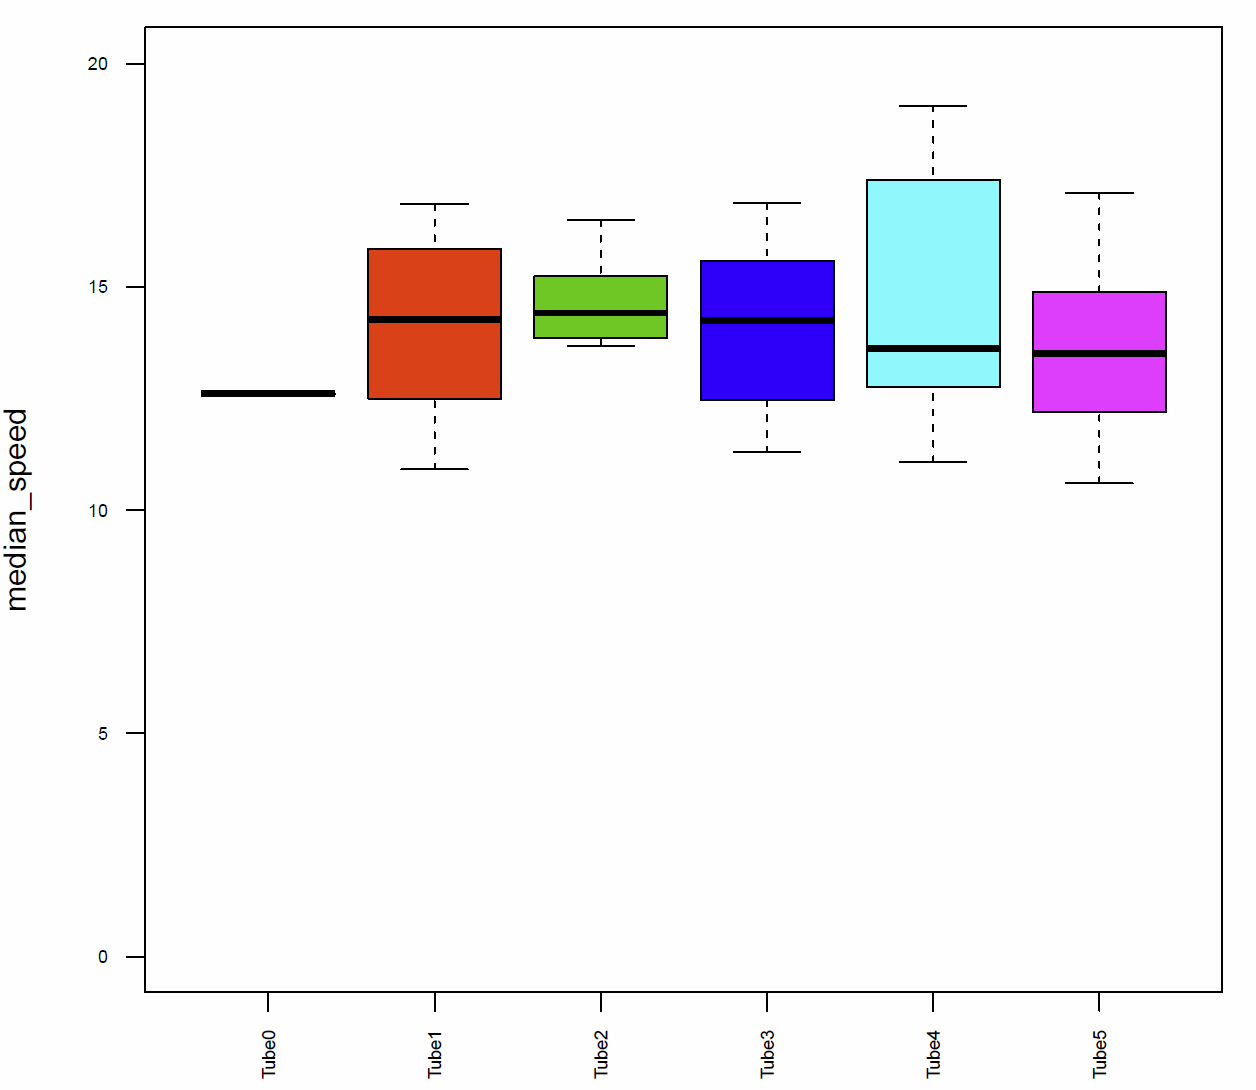
Fig. 14 median speed

Category: buridan, Individual choices in population paradigm, wing clipping
Leave a Reply