Analysis for spontaneity in platform
on Monday, September 21st, 2015 2:26 | by Christian Rohrsen
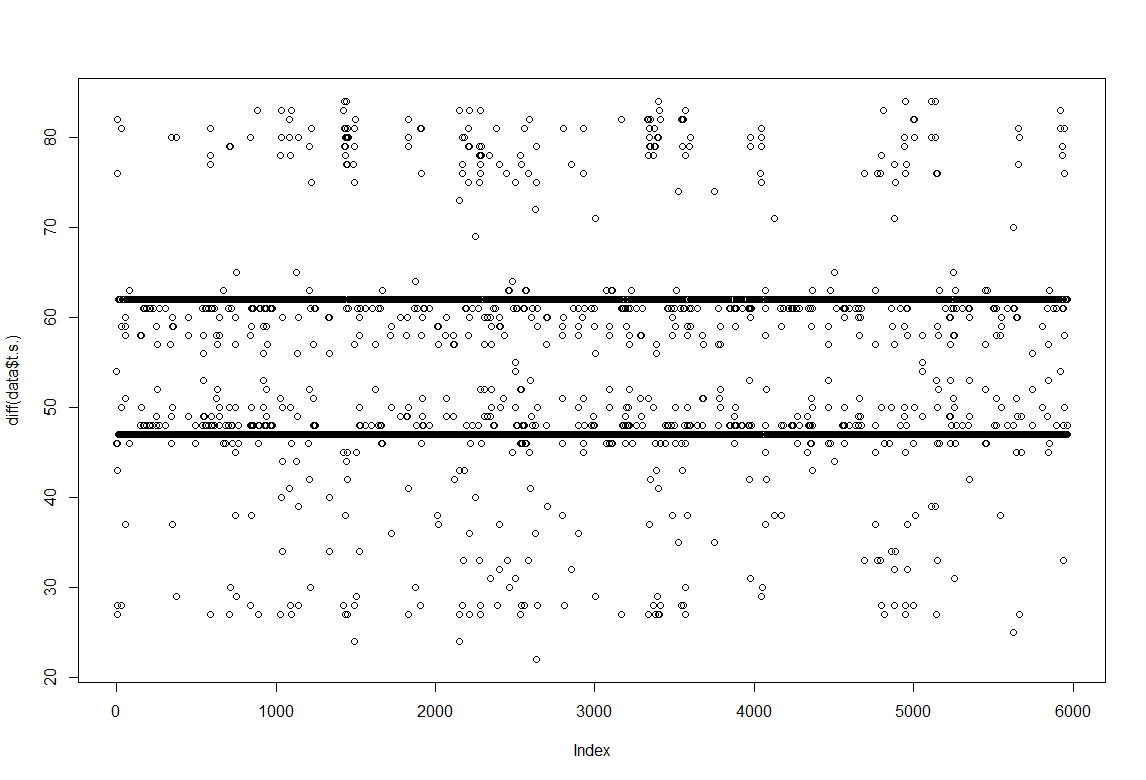
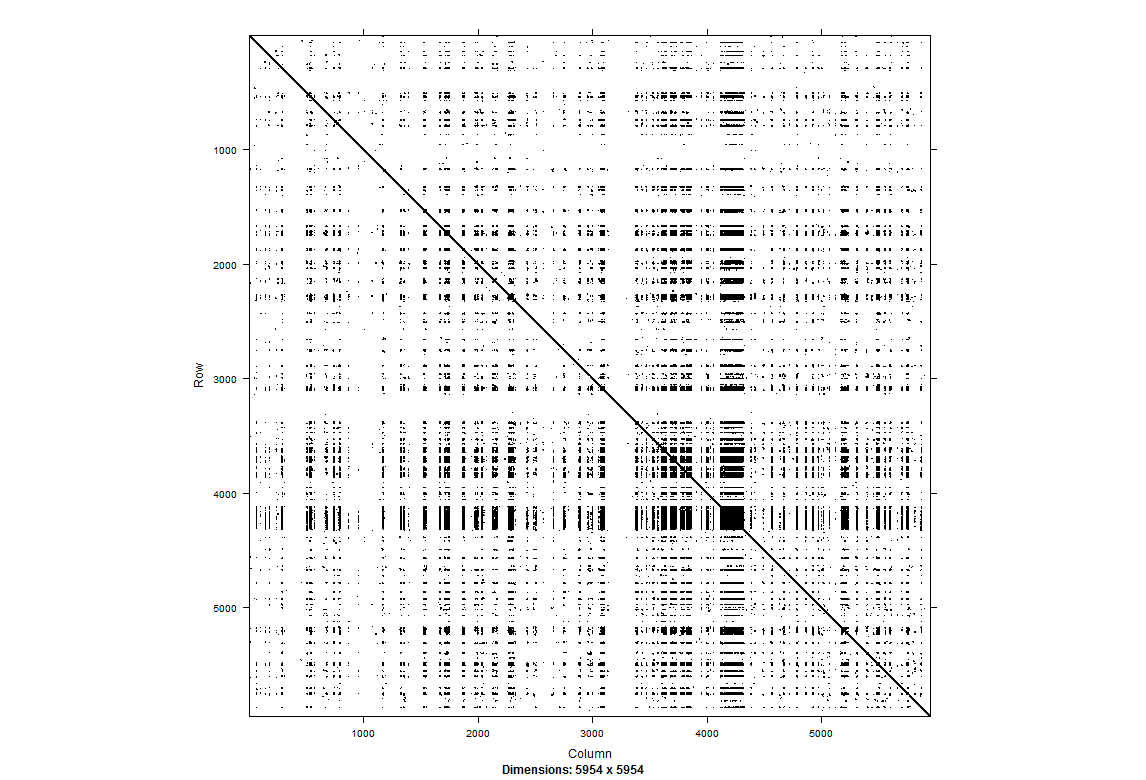 The sampling rate is not homogeneous and this affect a lot the processing of the data for non linearity. What can be done? On the right we see a recurrent plot of one single fly in darkness for 5 min. It seems to be to some extent periodic, not much chaotic (but I need more experience to really guess that) For more information https://www.recurrence-plot.tk/rqa.php.
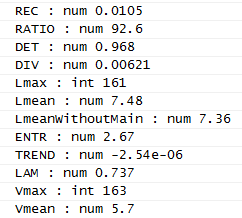
In the table below we see a low recurrence but high determinism among many other parameters.
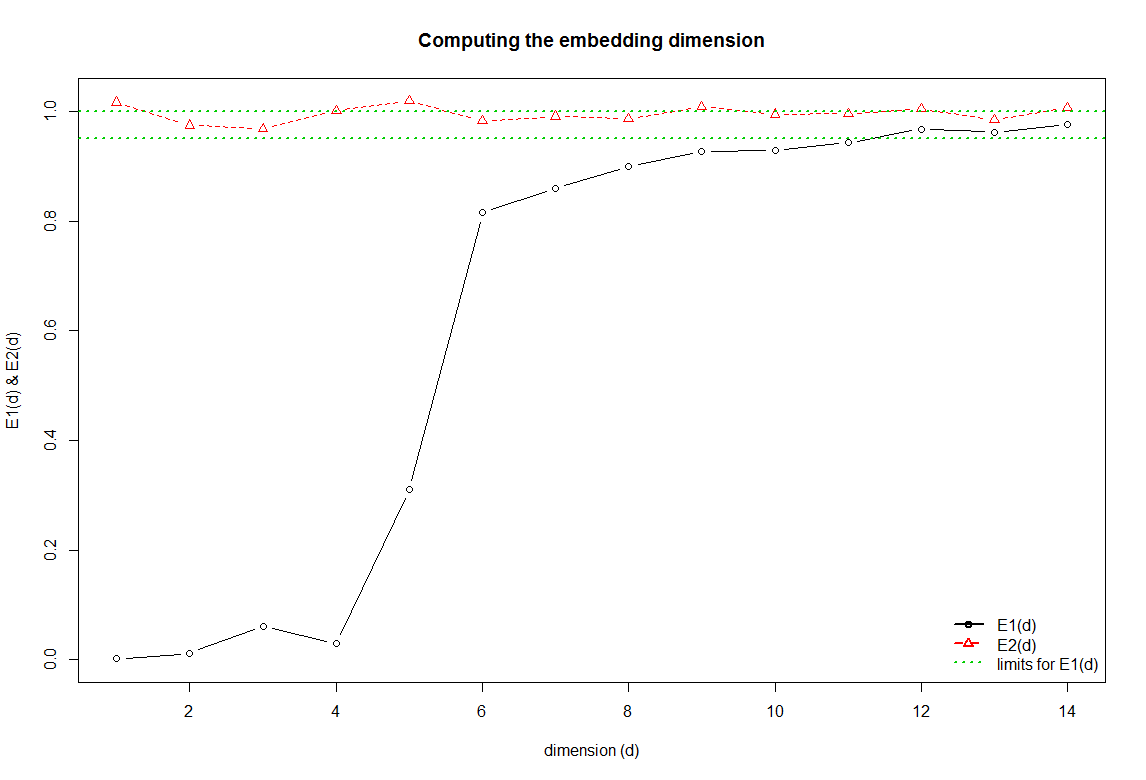
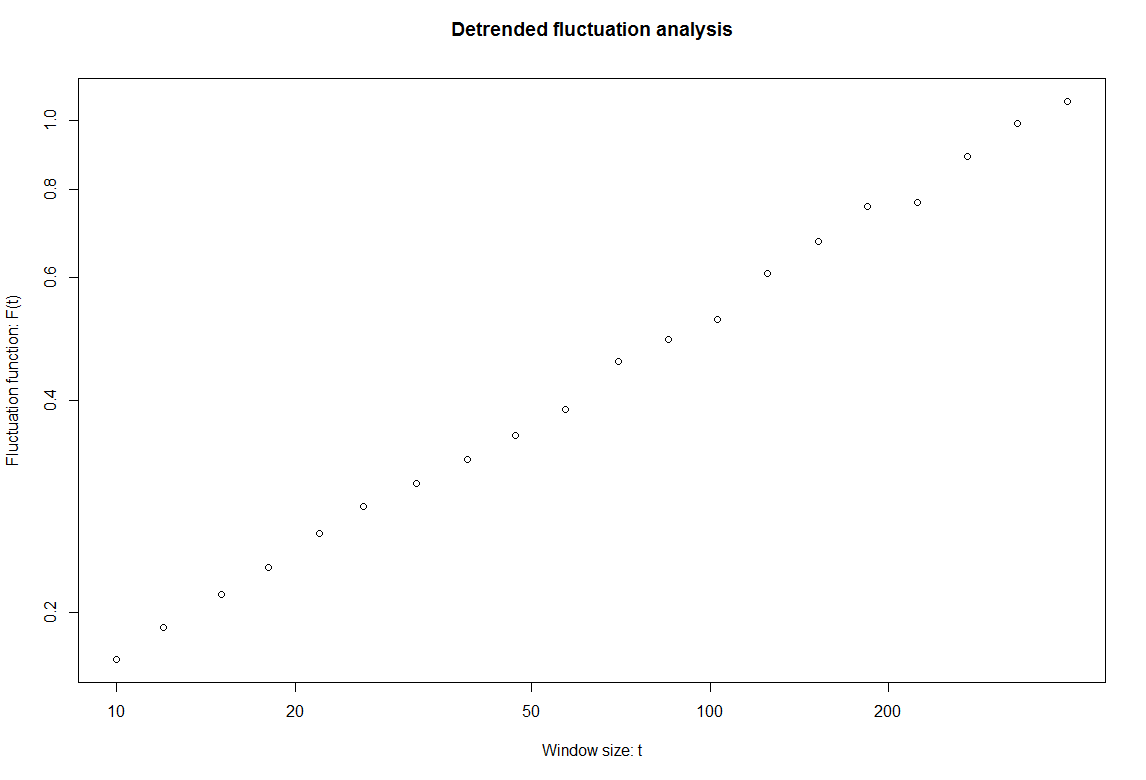 The E2 line shows values around 1 the whole time when the sample is random. This is contradicting the above. The detrended fluctuation analysis show a value around 0.5, which means that if these data was modelled as random it would look like white noise.

Category: R code, Spontaneous Behavior
Leave a Reply